-
Icon
-
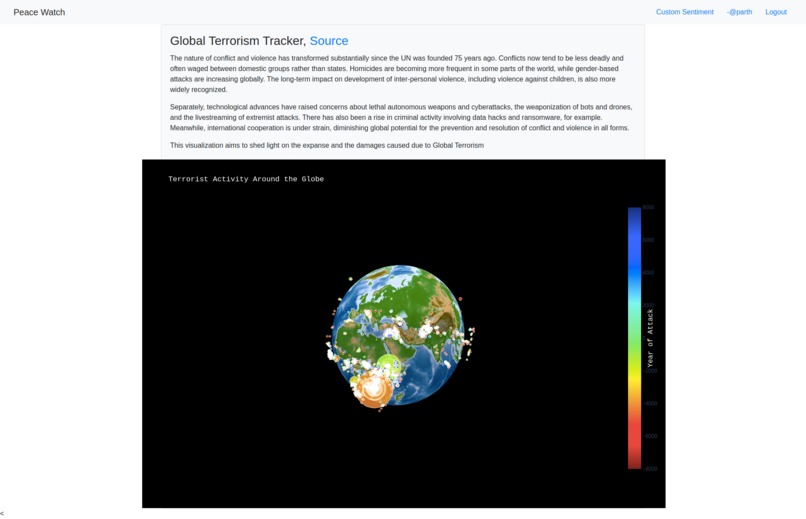
War Visualization
-
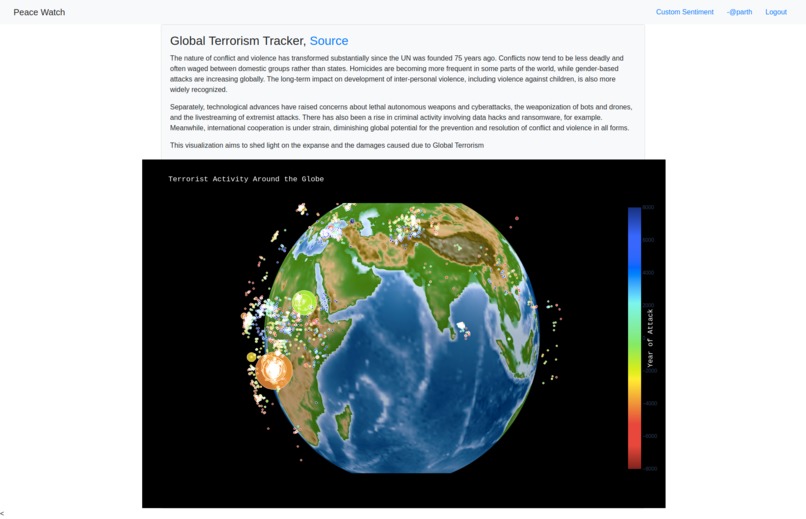
War Visualization 2
-
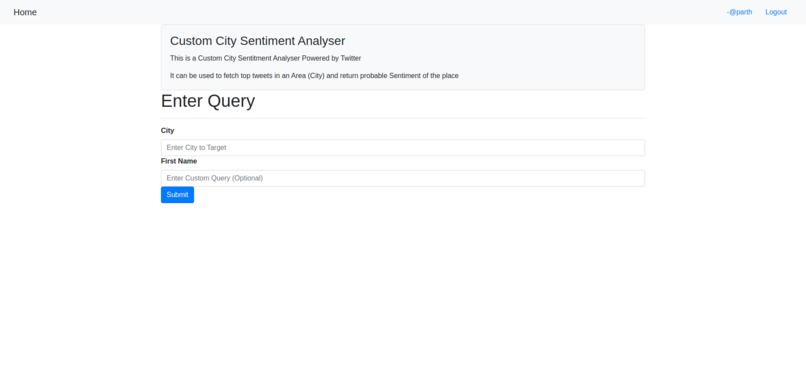
Sentiment Analyser
-
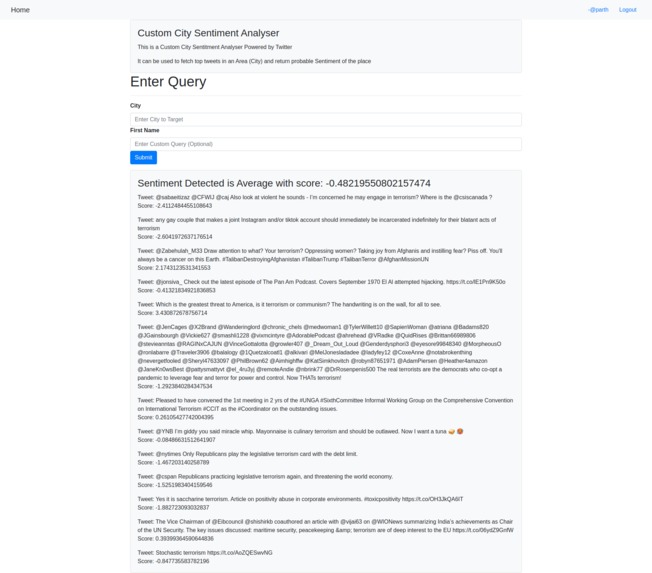
Sentiment Analyser Processed


Inspiration
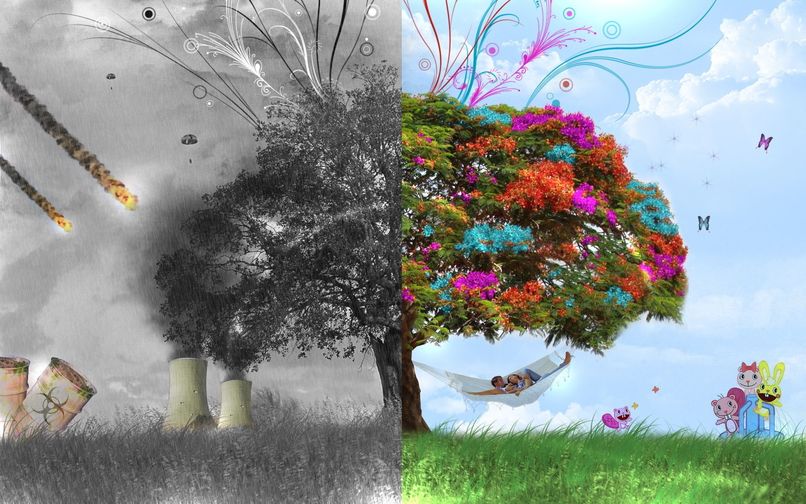
What if can quatify the happiness of a place in just minutes. The power of Big Data and AI enables us to tap into data feed of a region and topic and use that to do map out the sentiment of area. SImilarly on opposite end of the spectrum, what if there was a way to easily identify the sheer magnitude of loss and destruction, our 3D visualization enables us to do so.
What it does
There are basically two components to the solution
- War Visualizer: a 3D plot of war data, quantifying the damage and region most affected by violent skirmishes
- Sentiment Quantifier: An app that feteches twwet data using twiiter api with specific parameters, then run it through sentiment analyser and assign a score
How we built it
Built using Django platform in Python. The data for the Was visualization is scraped from : link
Challenges we ran into
It was very difficult tp push a ML project to heroku, ultimately due to unsufficient funds was not able to deploy it. Please visit Git Repository to see the demo GIF
Accomplishments that we're proud of
Doing a fun project
What we learned
Django Development
What's next for Peace Watch
Further modules to fintune predictions

Log in or sign up for Devpost to join the conversation.