-
-
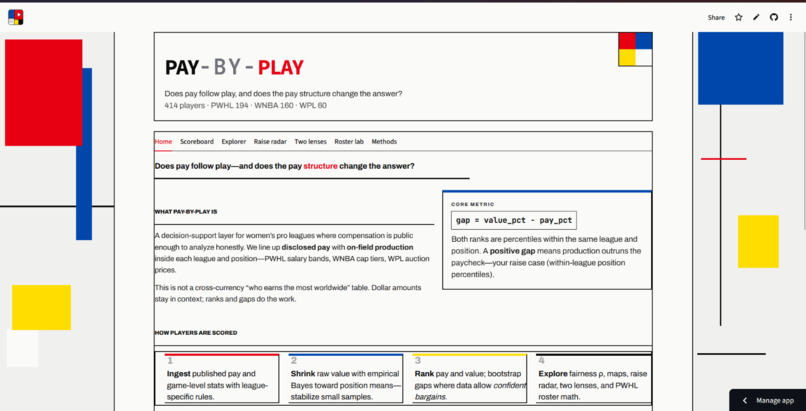
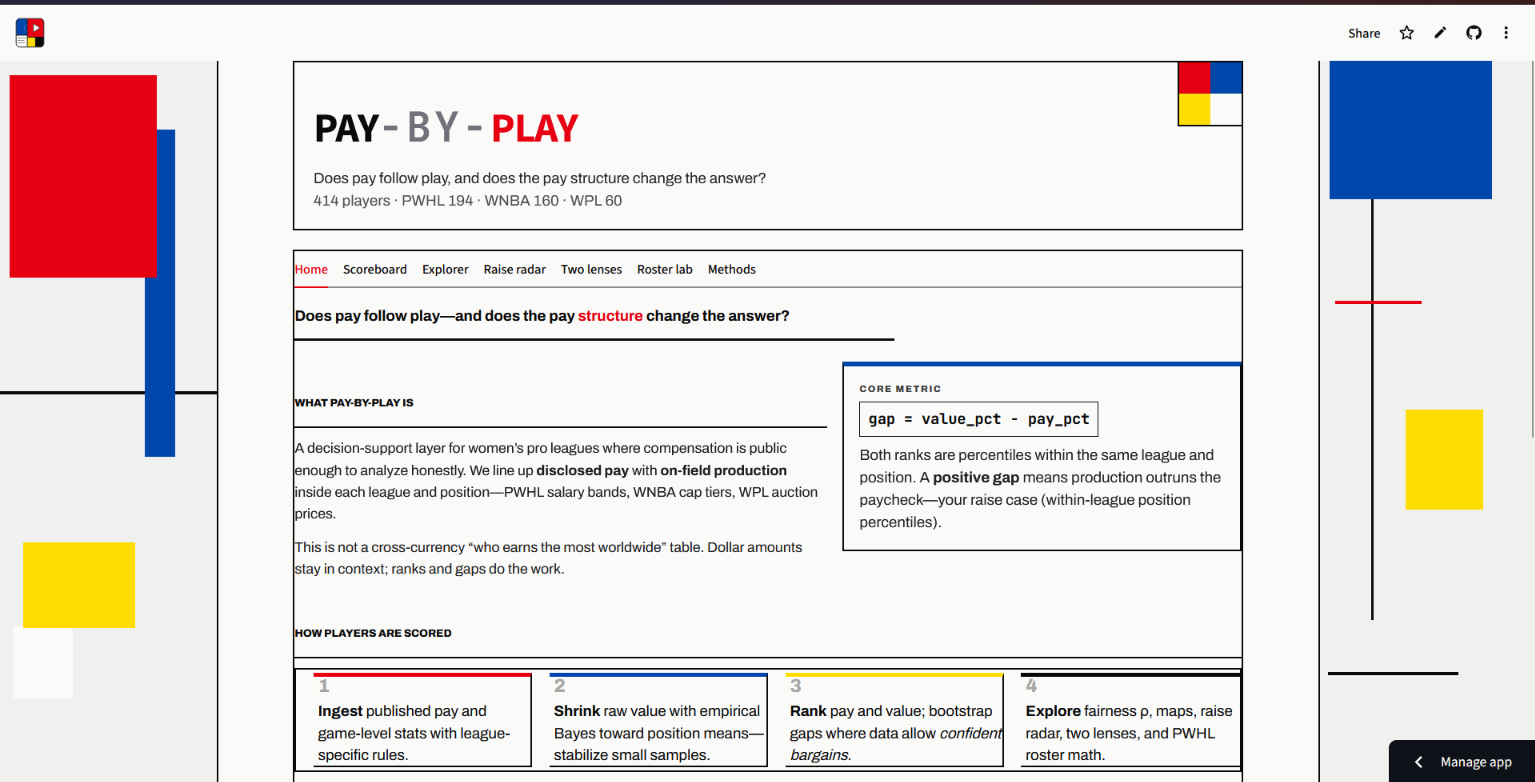
Home: does pay follow play? Gap = value rank − pay rank. 414 players — PWHL, WNBA, WPL.
-
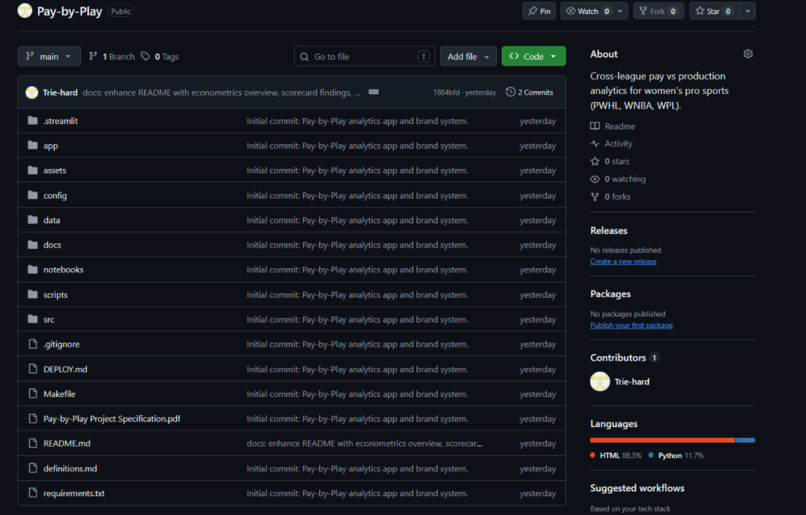
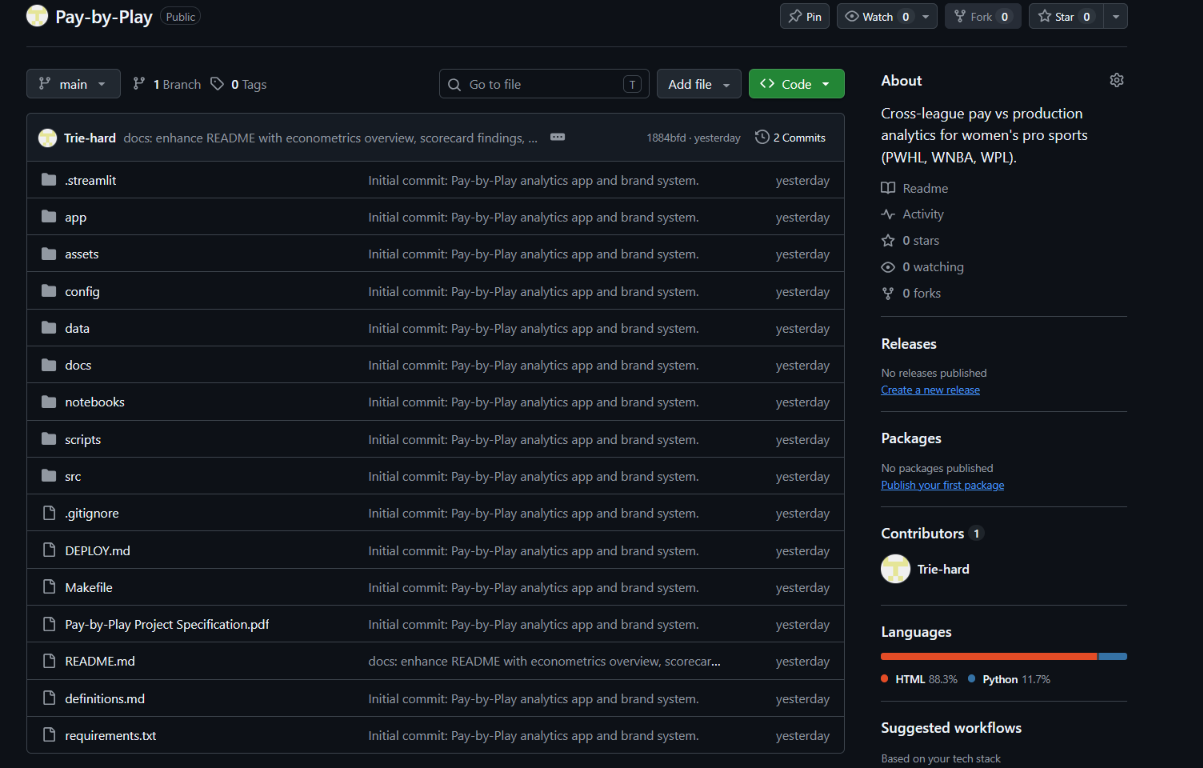
Public repo: ingest, pipeline, Streamlit app. Clone, run the pipeline, then streamlit run app/streamlit_app.py.
-
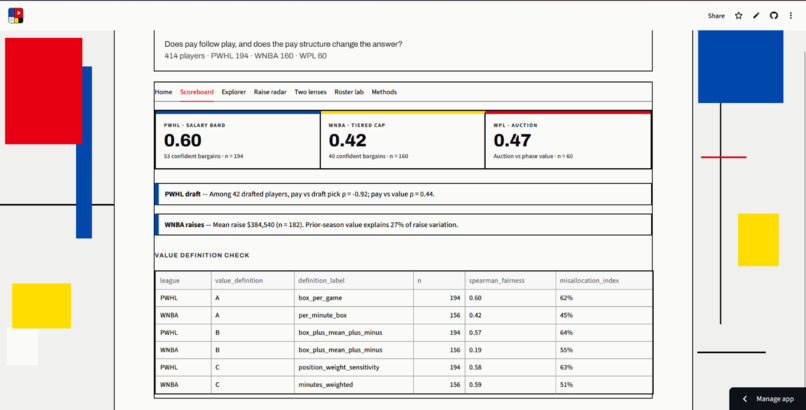
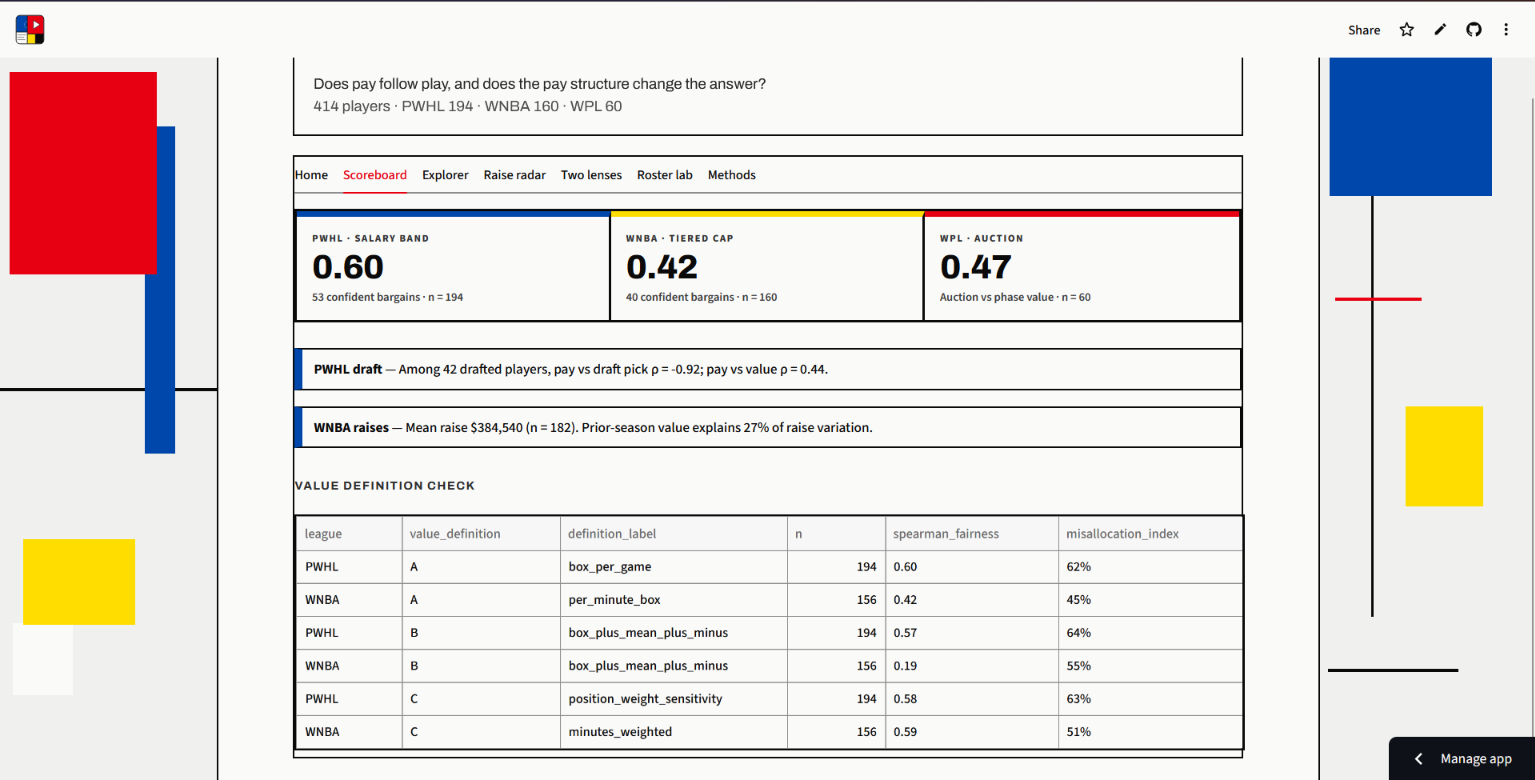
Fairness ρ: PWHL 0.60, WNBA 0.42, WPL 0.47. Draft vs pick −0.92; WNBA raises partly track prior value.
-
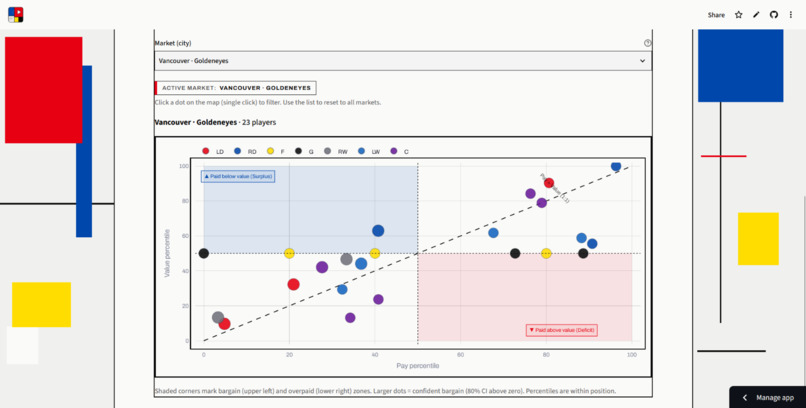
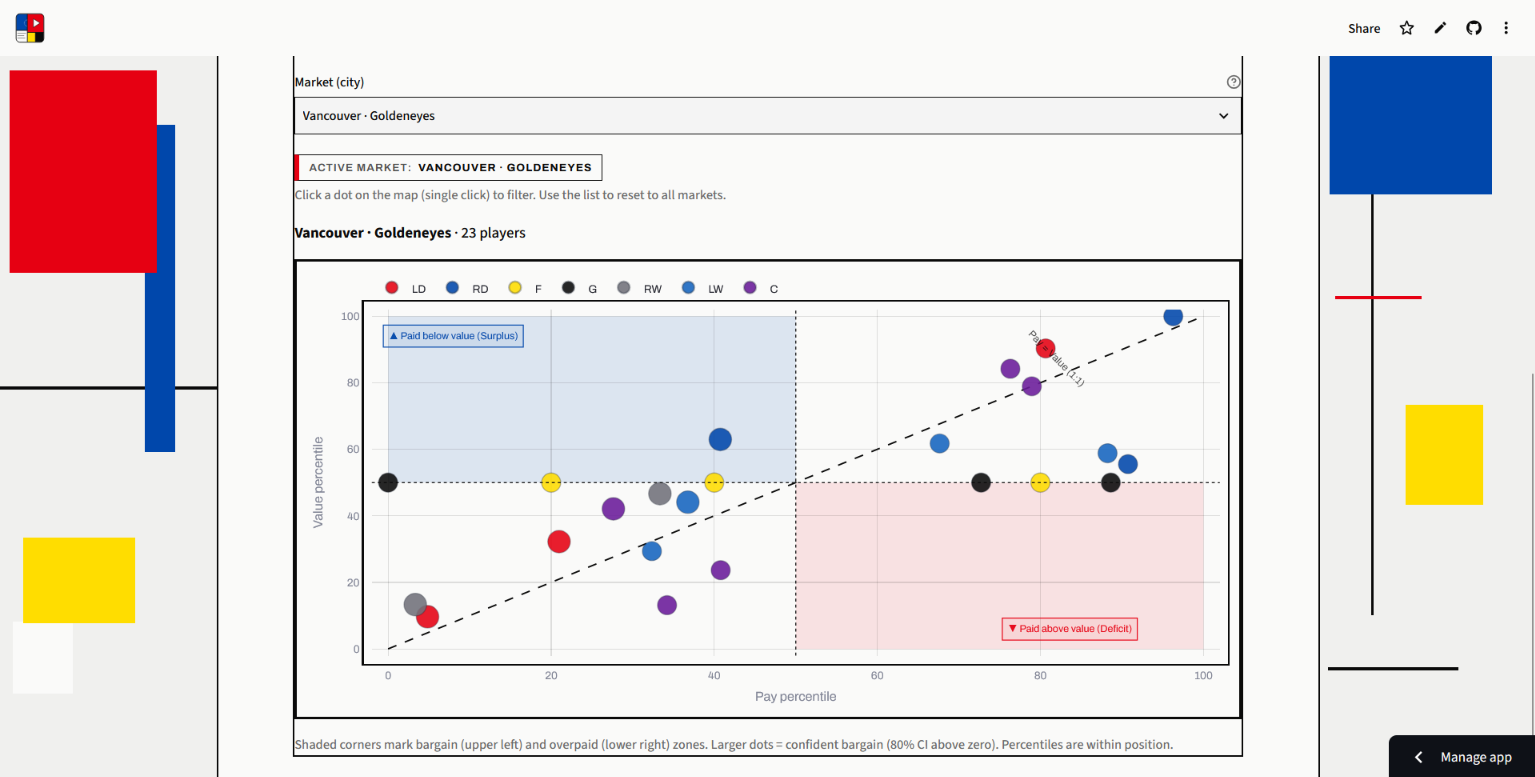
Vancouver scatter: pay vs value percentiles. Blue = surplus, red = deficit, dashed line = 1:1. Click a city to filter.
-
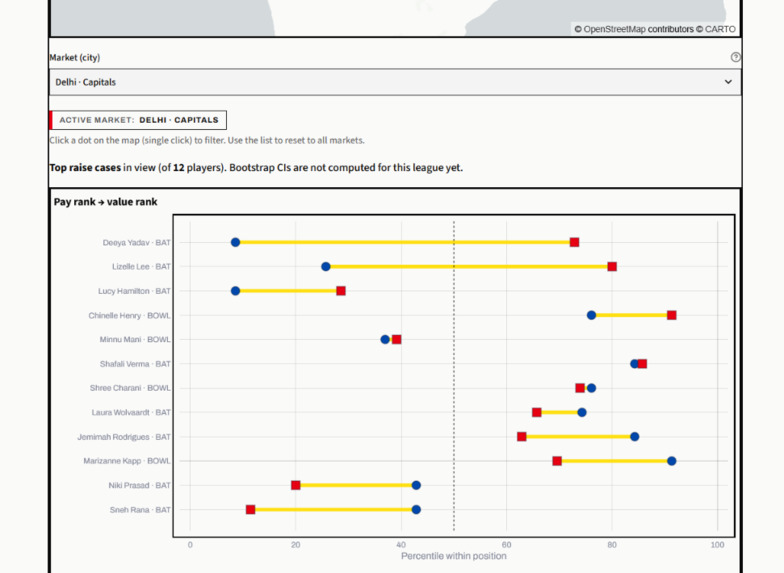
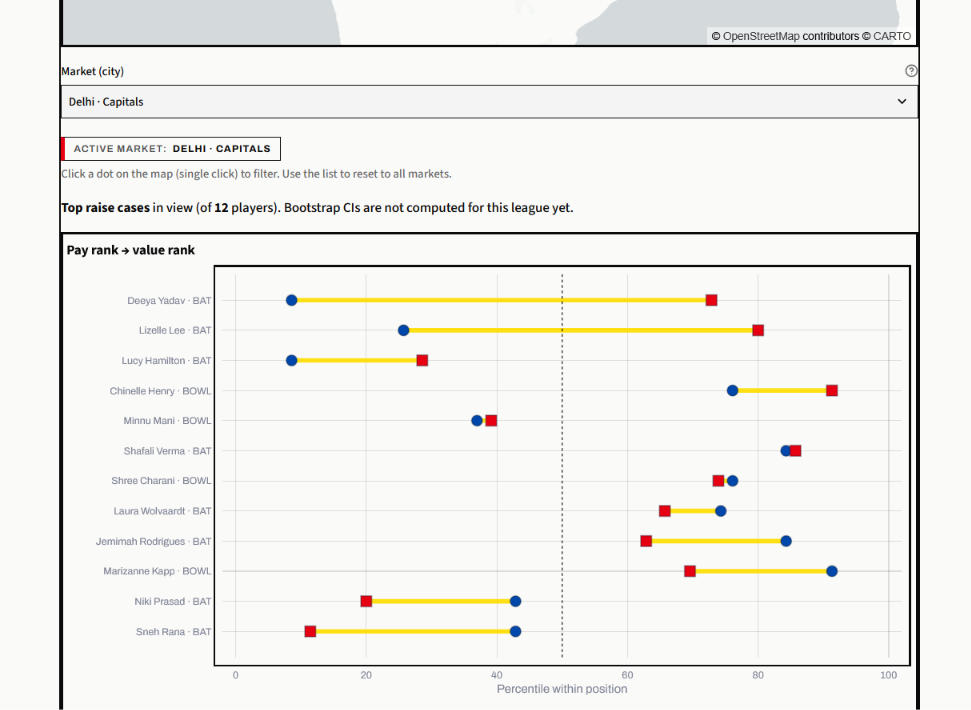
Delhi Capitals raise radar: blue = pay rank, red = value rank, yellow = gap. Auction prices vs production.
-
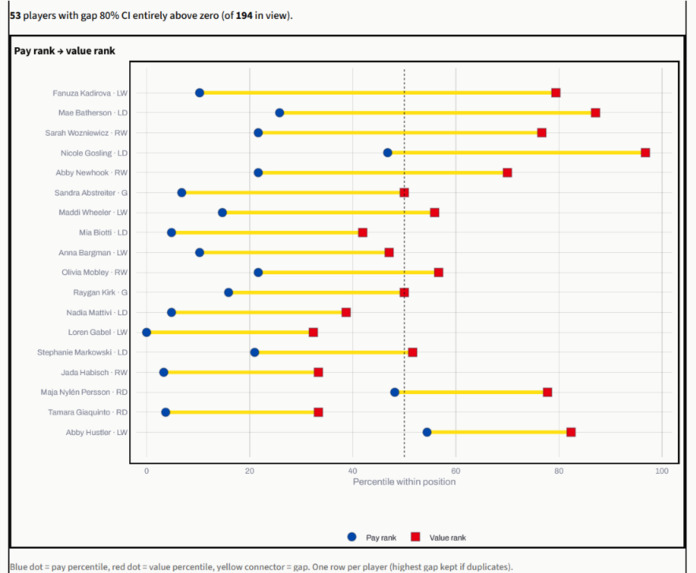
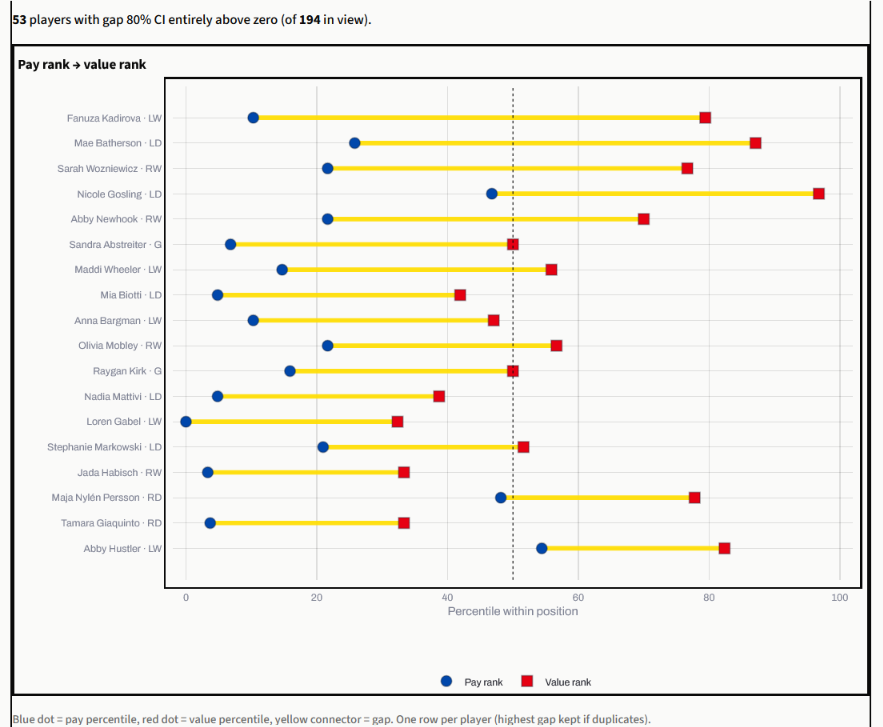
PWHL: 53 of 194 with gap 80% CI above zero. Long yellow bars are the strongest raise cases.
-
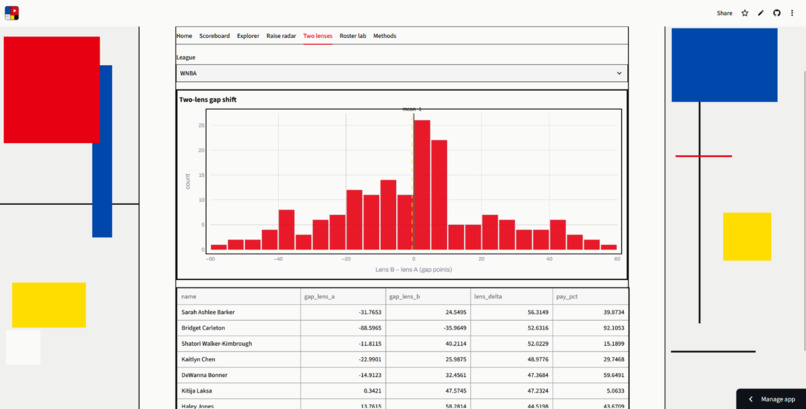
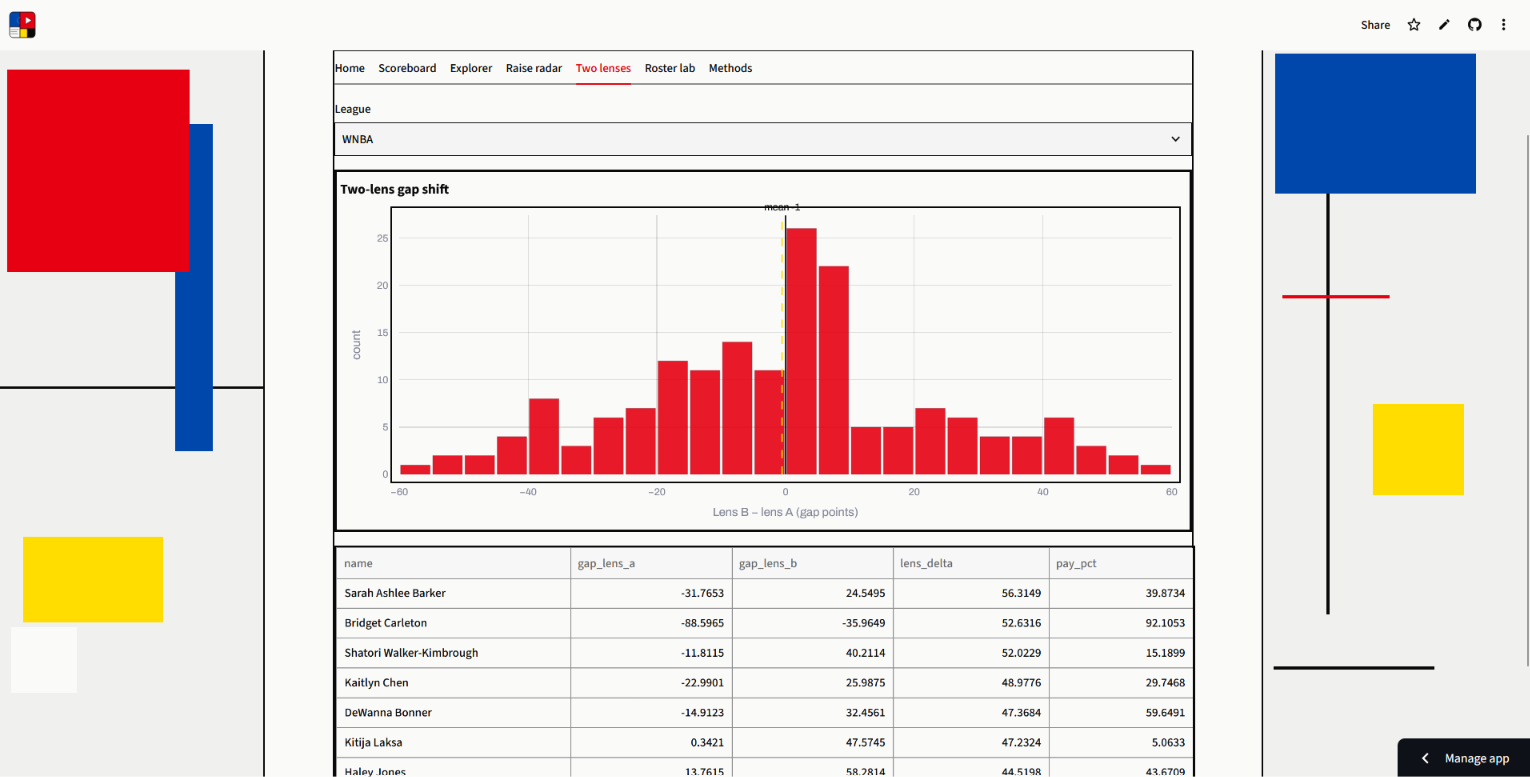
WNBA two-lens shift: current pay vs last year’s value vs this season. Mean near zero; some large breakouts.
-
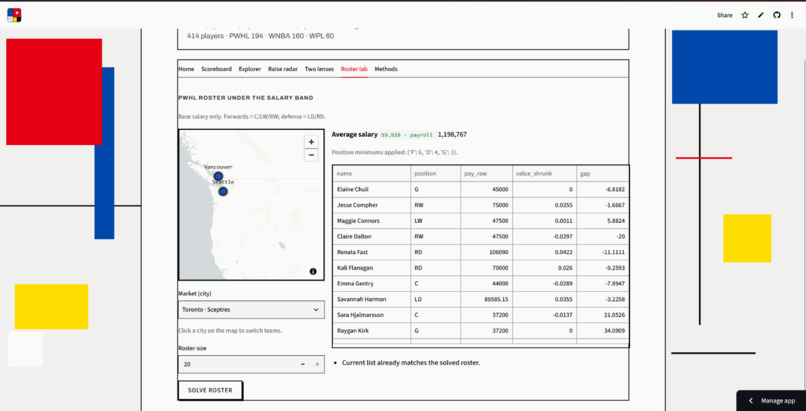
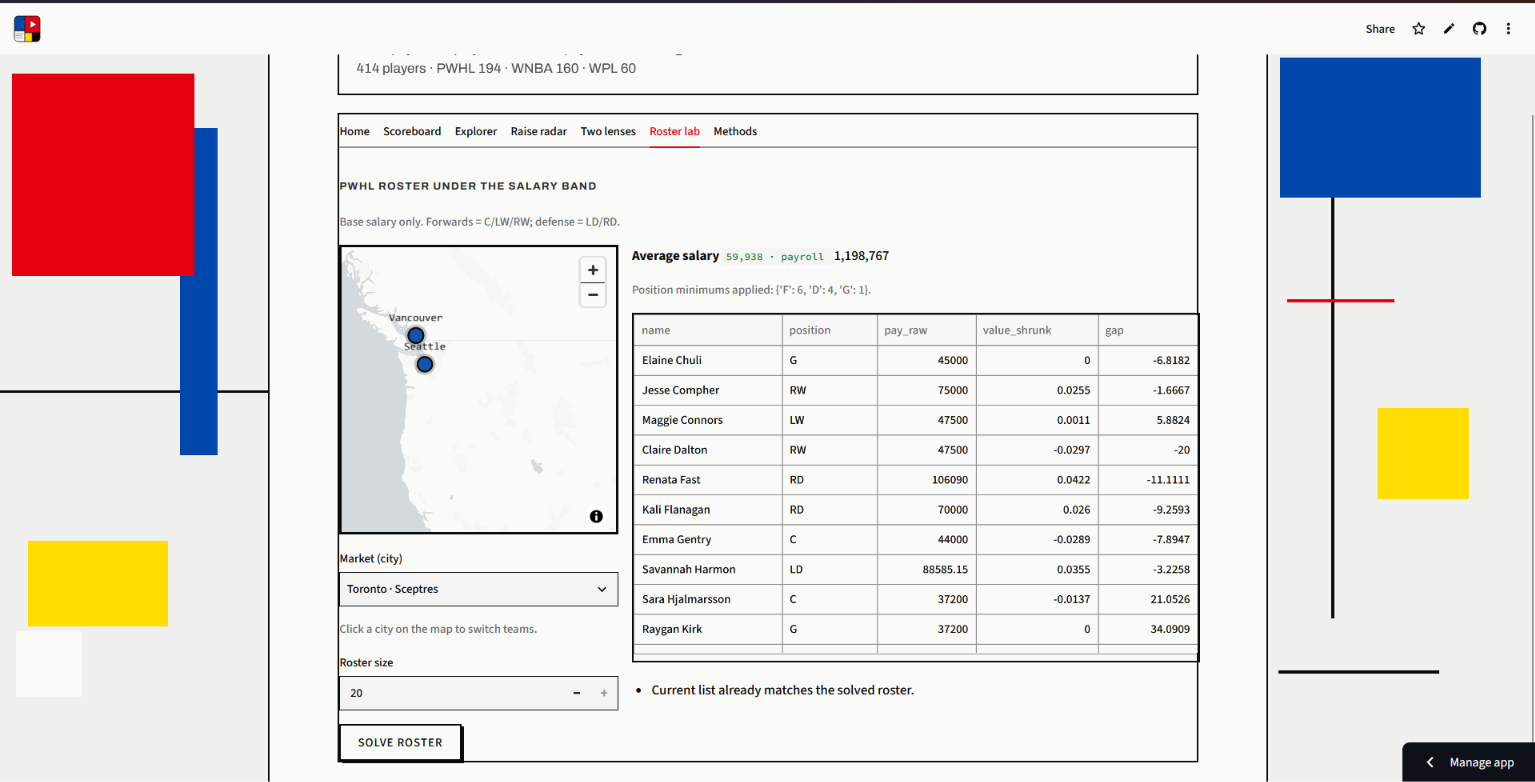
PWHL roster lab (Toronto): solve 20 under the salary band. Avg $59,938 · payroll $1.20M. Base salary only.
-
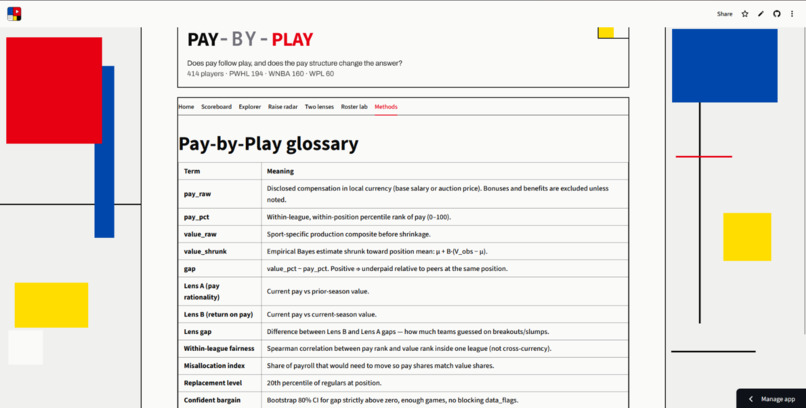
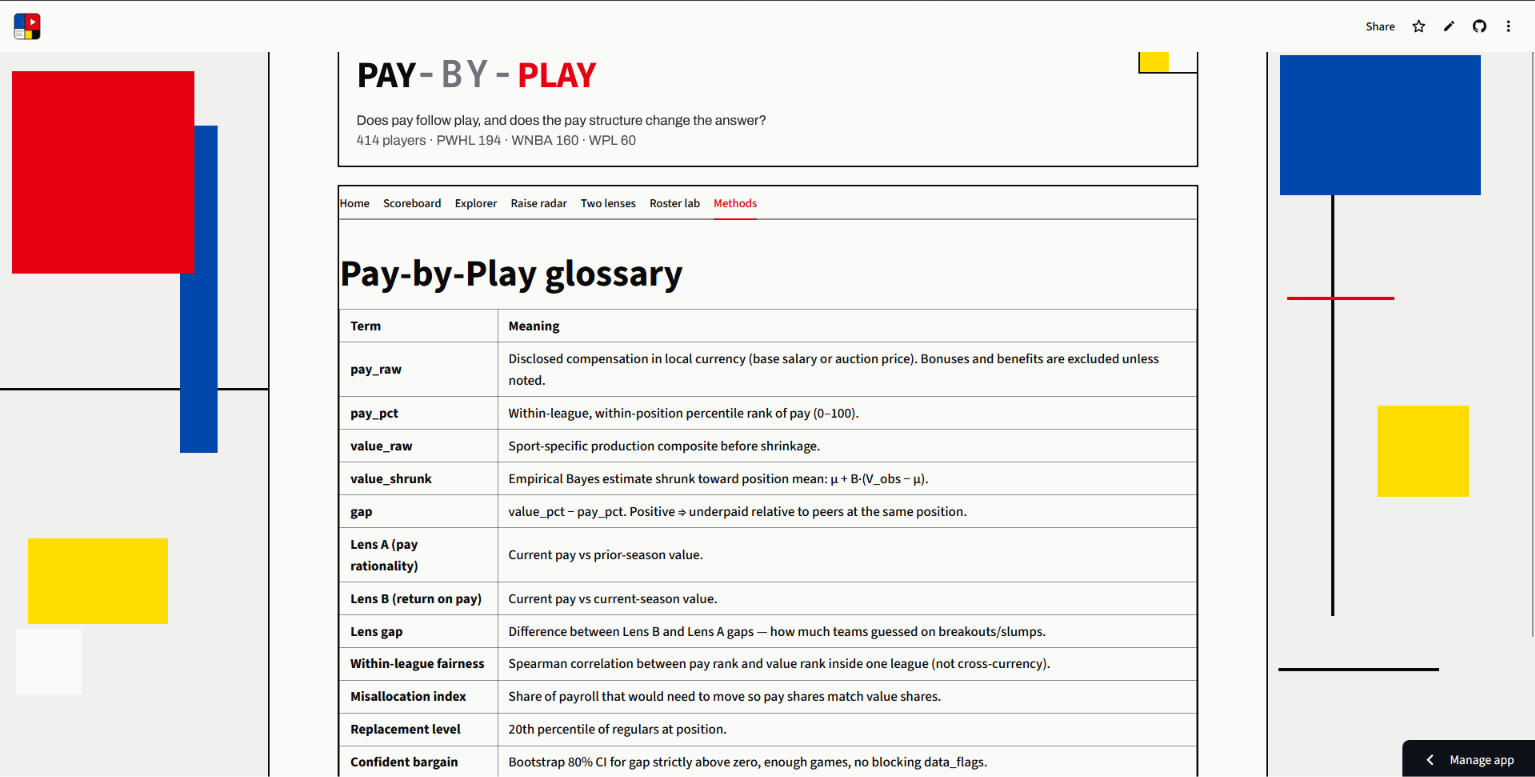
Pay-by-Play glossary: pay, shrunk value, gap, two lenses, and confident bargains—always within one league.
Inspiration
Women’s professional sports represent the most dynamic frontier in sports business, yet they operate under drastically divergent compensation architectures:
- PWHL: A centralized system with strict team average salary bands ($60,100 ± 10%) and full base salary transparency.
- WNBA: A traditional hard tiered salary cap with fixed veteran and rookie scales.
- WPL (Cricket): A high-stakes dynamic open micro-auction.
I asked a fundamental question: "Does pay follow play, and how does the compensation structure change the answer?"
Sports analytics too often produces toxic "overpaid" lists that weaponize compensation data against athletes. As a solo developer and researcher, I wanted to build an ethical econometric framework and decision-support suite that flips the script: identifying Confident Bargains—underpaid athletes whose on-field surplus value warrants immediate raise consideration.
What it does
Pay-by-Play evaluates how compensation mechanisms translate on-field production into financial compensation across the PWHL ((n=194)), WNBA ((n=160)), and WPL ((n=60)):
- Cross-League Fairness & Misallocation: Quantifies within-league fairness (Spearman rank correlation (\rho)) and the Misallocation Index (the percentage of payroll that would need to shift for pay shares to match production shares).
- The Two-Lens Framework: Separates contract rationality at signing (Lens A, prior-season performance) from realized active return-on-investment (Lens B, current-season production), tracking breakout surges with (\Delta = \text{Gap}_B - \text{Gap}_A).
- Empirical Bayes Shrinkage: Shrinks small-sample variance toward positional priors so reserve players with small minute totals don't distort league percentiles: $$\widehat{V}i = \mu{\text{pos}} + B_i \cdot (V_{\text{obs}, i} - \mu_{\text{pos}})$$ $$B_i = \frac{\tau^2}{\tau^2 + \frac{\sigma^2}{\text{exposure}_i}}$$
- 1,000-Rep Bootstrap Engine: Simulates 80% confidence intervals for every surplus gap ((\text{gap}_i = \text{value_pct}_i - \text{pay_pct}_i)) to verify statistically robust Confident Bargains ((\text{ci_low} > 0)).
- Interactive De Stijl Modernist Streamlit App: A 7-tab dashboard featuring interactive PyDeck geographic maps, 4-quadrant value-vs-pay Plotly scatter plots, raise-radar dumbbell charts, and Roster Lab—a Mixed-Integer Linear Programming (MILP) solver optimizing compliant PWHL rosters under CBA band constraints.
How I built it
Working solo across the full stack, I built the project from raw data ingestion to econometric modeling and interactive deployment:
- Data Engineering & Parsing: Ingested and parsed data from disparate sources—official PWHLPA Salary Guide PDFs using
pdfplumber, WNBA cap hits from Her Hoop Stats, WPL auction logs from Cricbuzz and ball-by-ball events from Cricsheet, and official game logs viasportsdataverse. Reconciled all payrolls against deterministic cent-level checksums (e.g., Boston's exact $1,436,173.50 across 25 contracts). - Econometric Pipeline: Implemented Empirical Bayes shrinkage, pre-registered value composites (testing primary, impact, and sensitivity specifications), Spearman rank metrics, and 1,000-iteration block bootstrapping using
scipy,statsmodels,numpy, andpandas. Exported analytical tables into compressed Parquet files for sub-second app queries. - Linear Optimization: Formulated PWHL collective bargaining constraints ($60,100 ± 10% average salary band and positional roster requirements) as a Mixed-Integer Linear Program using
PuLPand theHiGHSsolver. - UI & Brand Identity: Designed a custom visual system inspired by Dutch De Stijl / Bauhaus Modernism (Mondrian/Rietveld inspired primary palette: Blue for contract baseline, Red for athletic play, Canary Yellow for value gap, and Ink structural grid lines). Implemented the 7-tab dashboard using Streamlit, Plotly, and PyDeck.
Challenges I ran into
- Fragmented & Opaque Data: Women's sports financial data is notoriously fragmented across PDFs, unstructured tables, and emerging APIs. Normalizing cross-sport player names, mapping positions, and verifying salary figures required building strict validation gates (and intentionally excluding leagues like the NWSL where public disclosure is too incomplete to model responsibly).
- Small-Sample Volatility: Short seasons (24–30 games) create extreme variance for role players with brief spurts of high efficiency. Formulating and tuning the Empirical Bayes shrinkage estimator ((B_i)) was essential to prevent small-sample noise from generating false bargains without dampening genuine breakout talent.
- Solo Pipeline Scope: Designing the theoretical econometric framework, writing automated data scrapers, building an MILP solver, and crafting a polished front-end design system single-handedly required disciplined modular architecture and end-to-end automated testing.
Accomplishments that I'm proud of
- Complete Solo Execution: Researched, engineered, modeled, designed, and deployed the entire econometric platform independently.
- Empirical Hypothesis Validation:
- H1 (PWHL Draft Primacy): Proved draft pick position correlates with rookie salary at (\rho = -0.92) ((p = 4.95 \times 10^{-18})), whereas actual on-ice performance correlation is only (\rho = 0.44).
- H2 (WNBA Raise Determinants): Proved prior performance explains only 26.9% of raise variance ((R^2 = 0.269)), with over 73% dictated by cap constraints, service time, and bargaining leverage.
- Placebo Permutation Testing: Confirmed the statistical validity of the within-league fairness metric ((\rho = 0.598)) by proving it collapses to zero under 20 random pay-permutation shuffles ((|\bar{\rho}_{\text{placebo}}| = 0.053)).
- Ethical, Athlete-First Analytics: Replaced negative "overpaid" rhetoric with an objective framework that surfaces under-compensated talent.
What I learned
- Cap Mechanics Dictate Equity: How differing salary cap mechanisms directly shape compensation fairness—the PWHL's transparent average salary band achieves much higher rank alignment ((\rho = 0.60)) than the WNBA's tiered hard cap ((\rho = 0.42)), where max contracts artificially compress elite surplus value.
- Operations Research in Sports: How to formulate and solve real-world collective bargaining constraints using Mixed-Integer Linear Programming.
- Communicating Uncertainty: How to present complex econometric concepts (shrinkage, bootstrap confidence intervals, misallocation indices) into intuitive, interactive decision-support tools for coaches, agents, and fans.
What's next for Pay-By-Play
- Expanding Emerging Leagues: Incorporating upcoming compensation datasets from leagues like Unrivaled basketball and LOVB volleyball.
- Multi-Year Longitudinal Modeling: Tracking career surplus trajectories across multiple CBA renewal cycles and media rights expansions.
- Agent & Executive Negotiation Dossiers: Generating one-click PDF dossiers that players and agents can bring directly into contract negotiations to substantiate raise proposals.

Log in or sign up for Devpost to join the conversation.