Inspiration
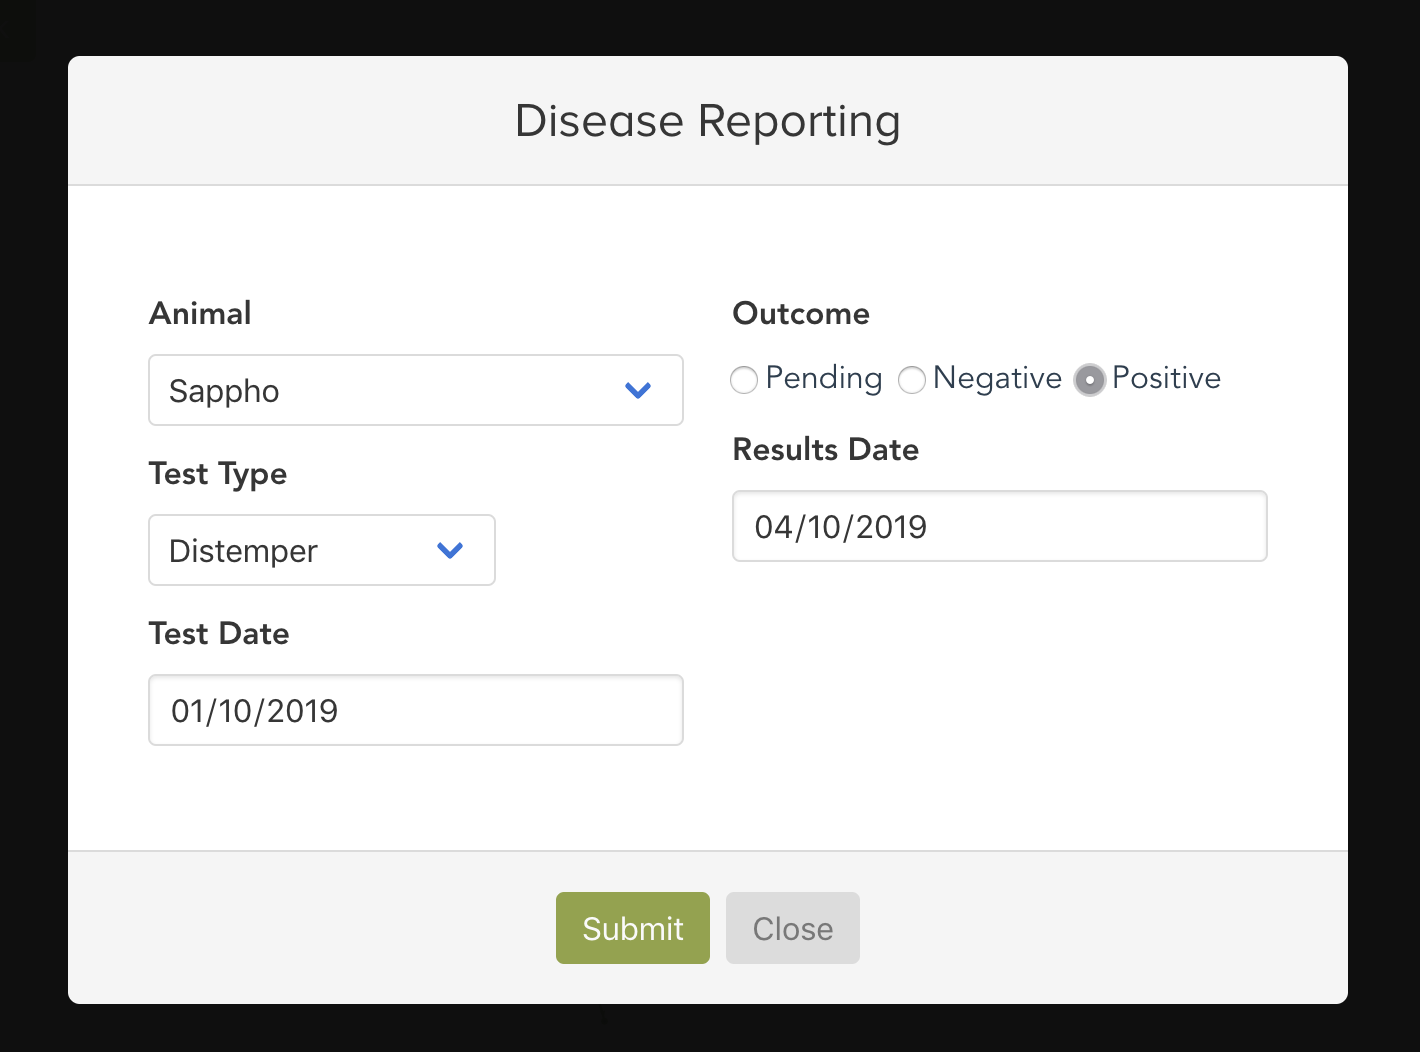
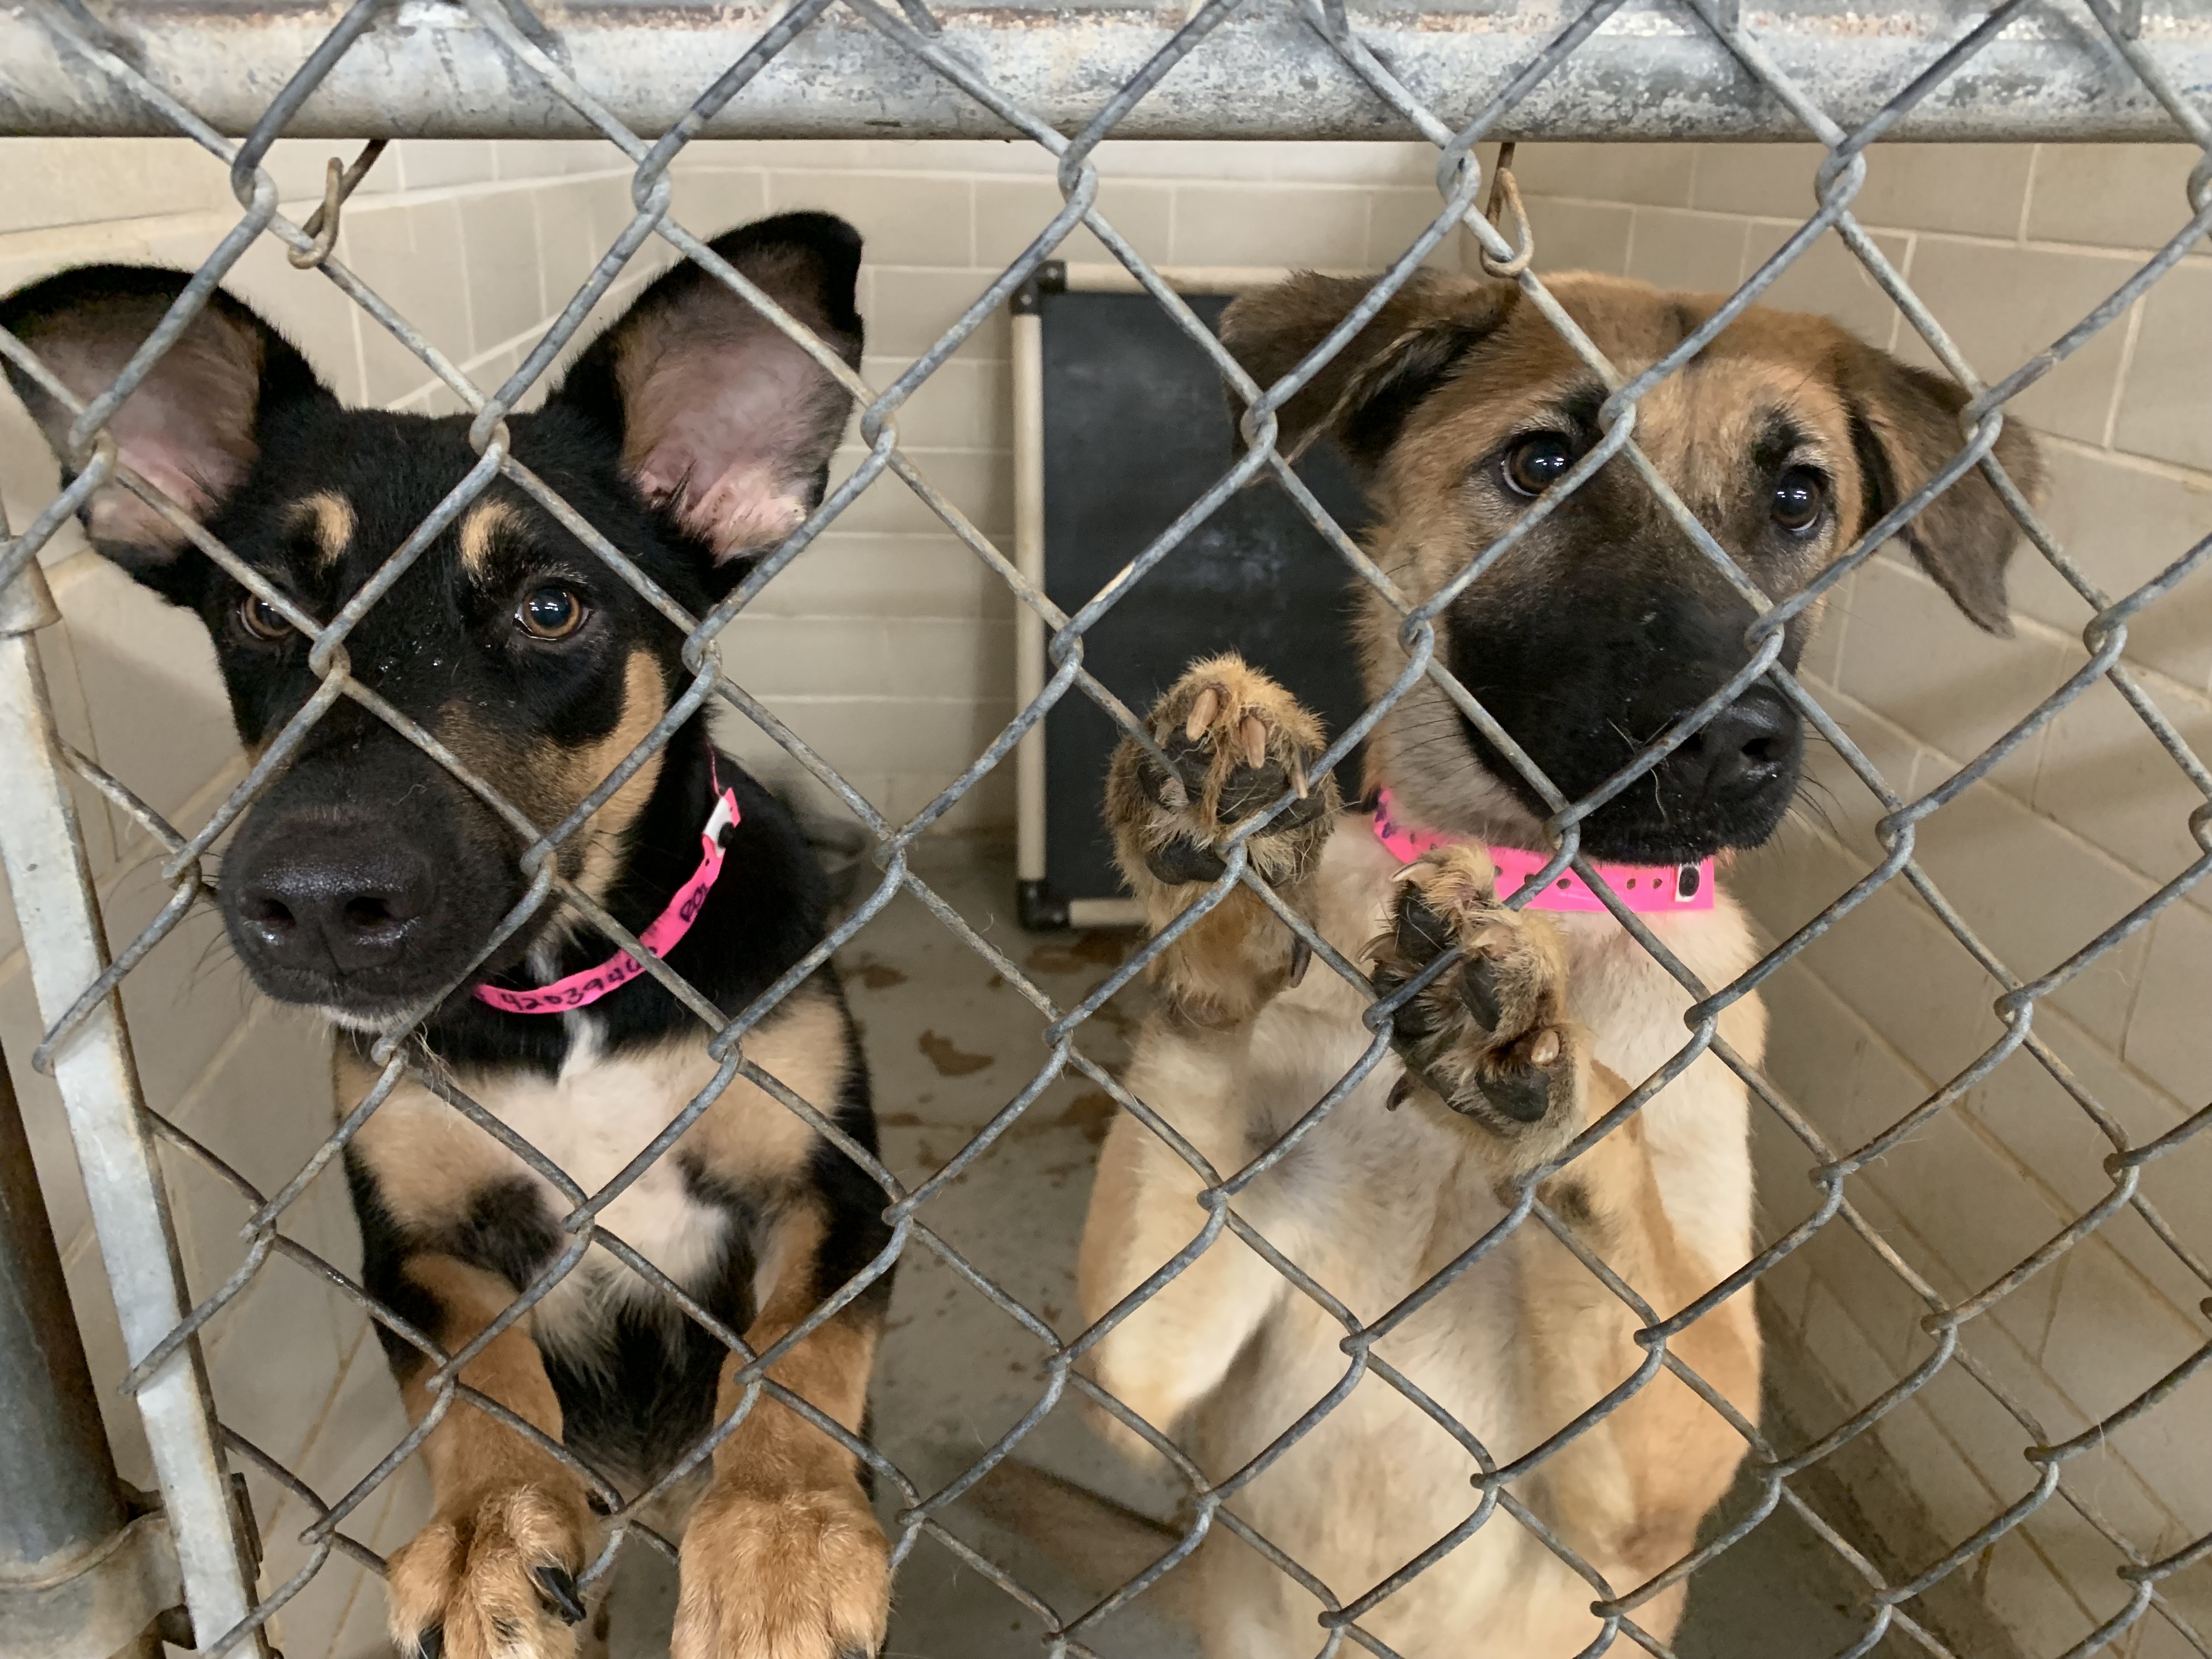
A week after Jessica visited Palm Valley Animal Center in Texas to photograph the hundreds of animals in the facility, there was an outbreak of distemper, a deadly and contagious virus. Half of the dogs had to be euthanized.
Major animal health companies use mapping to predict contagion, but their maps only go as deep as county level. When prevention is the single most powerful tool to combat outbreak, how can these maps help our vets? Our vets need tools that go deeper.
What it does
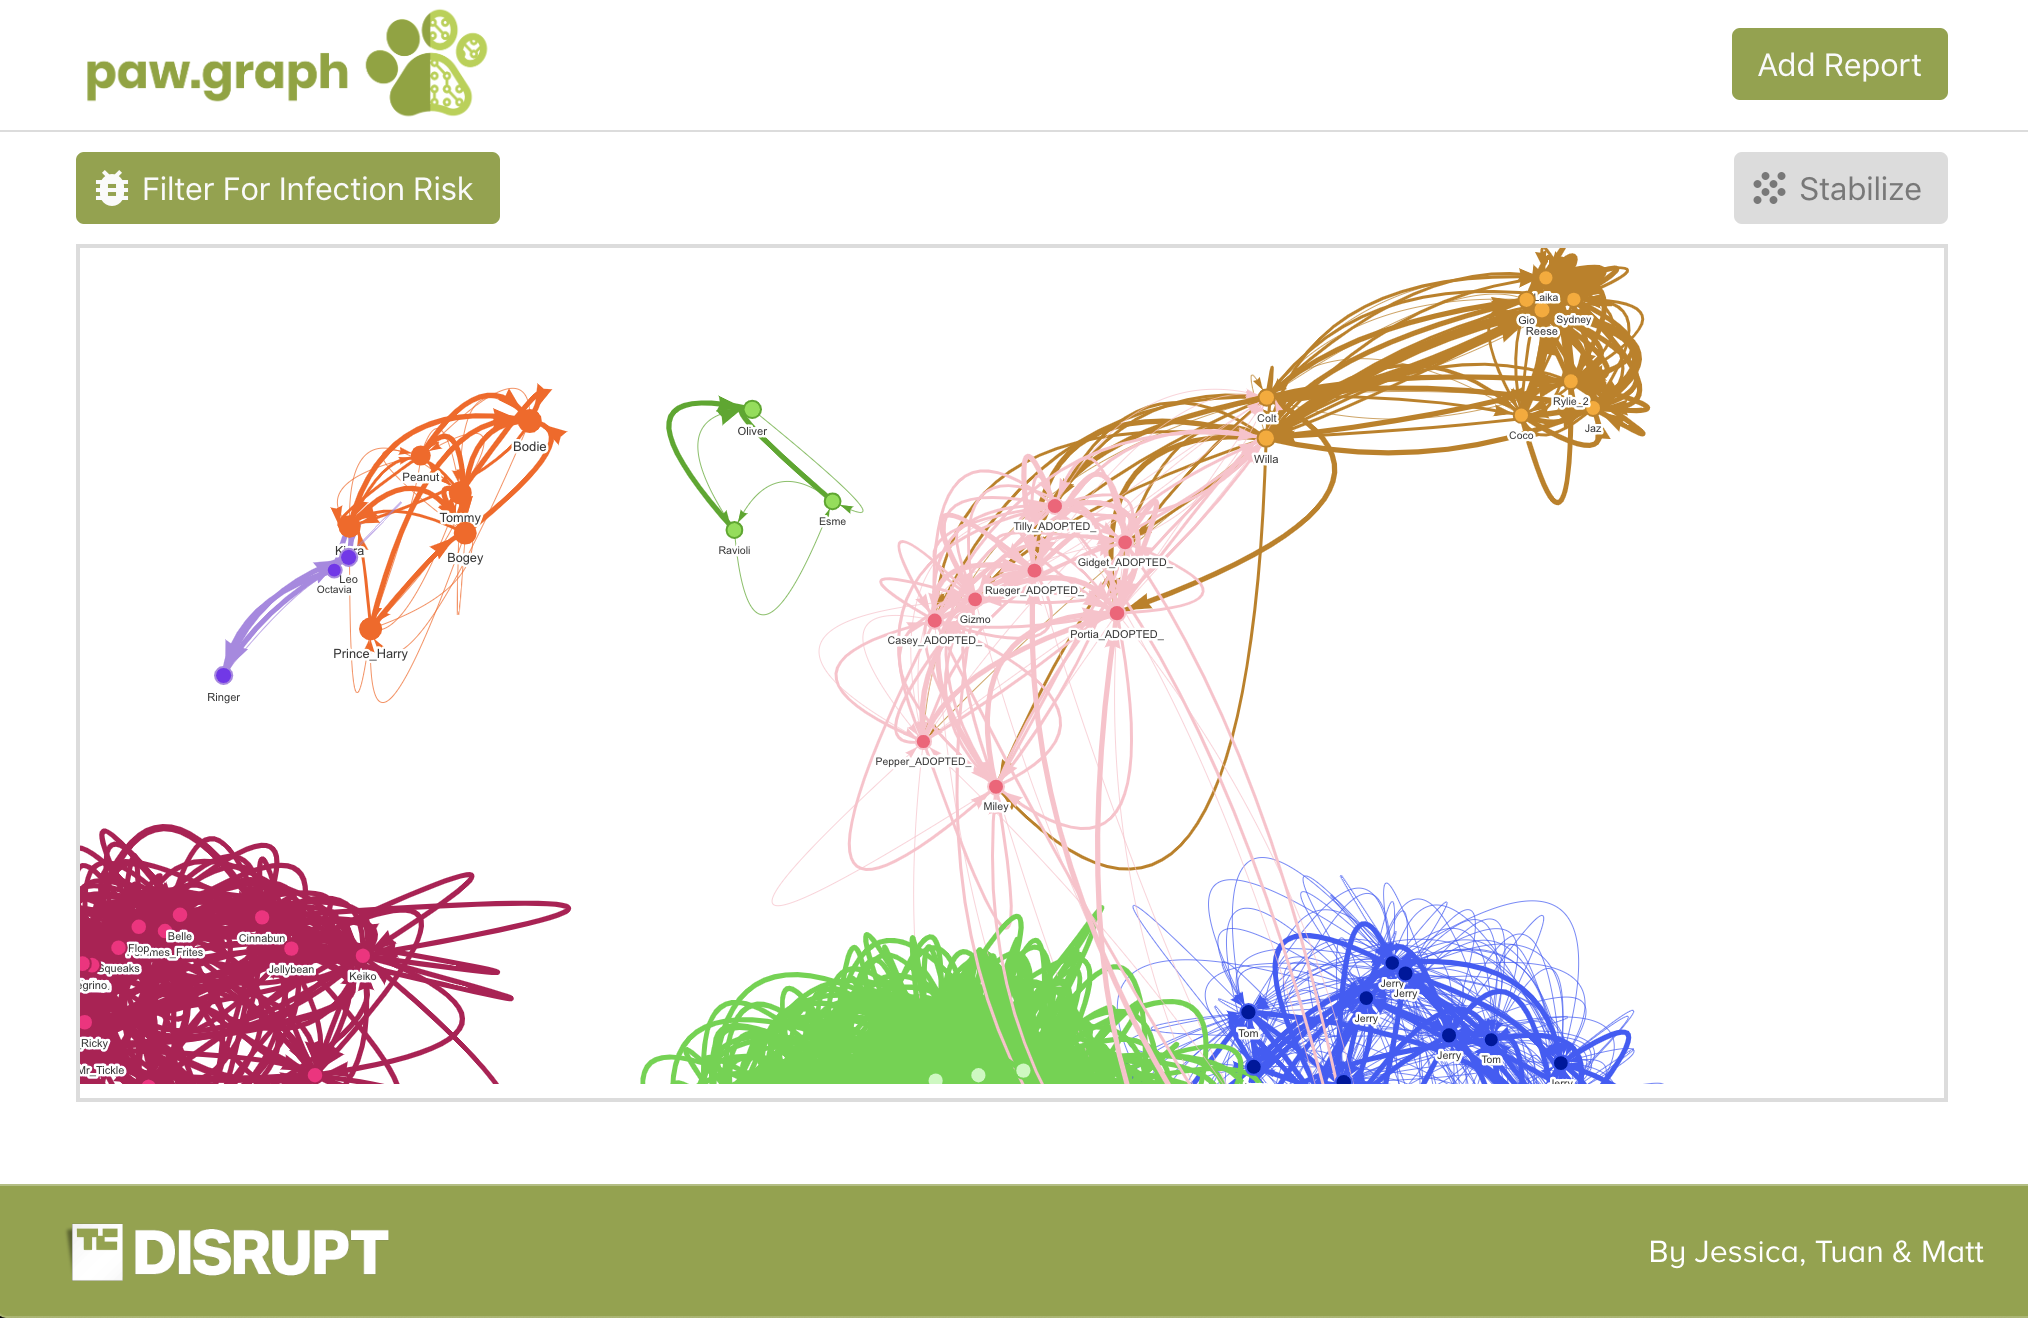
Paw.graph is the first application that predicts transmission of disease on an individual pet basis.
How we built it
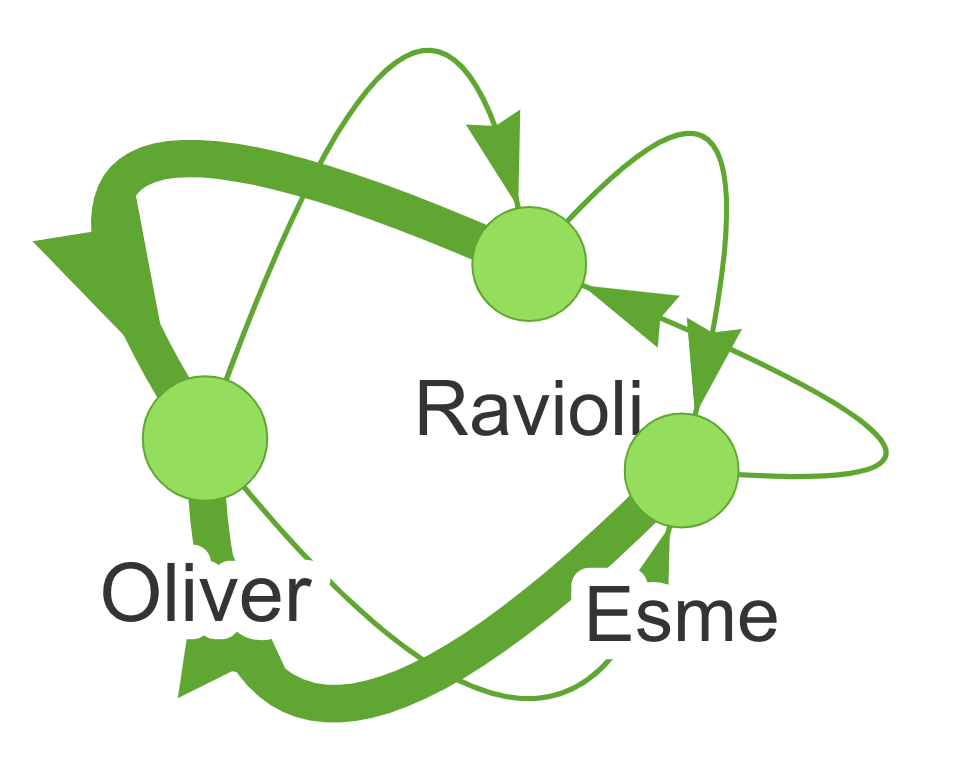
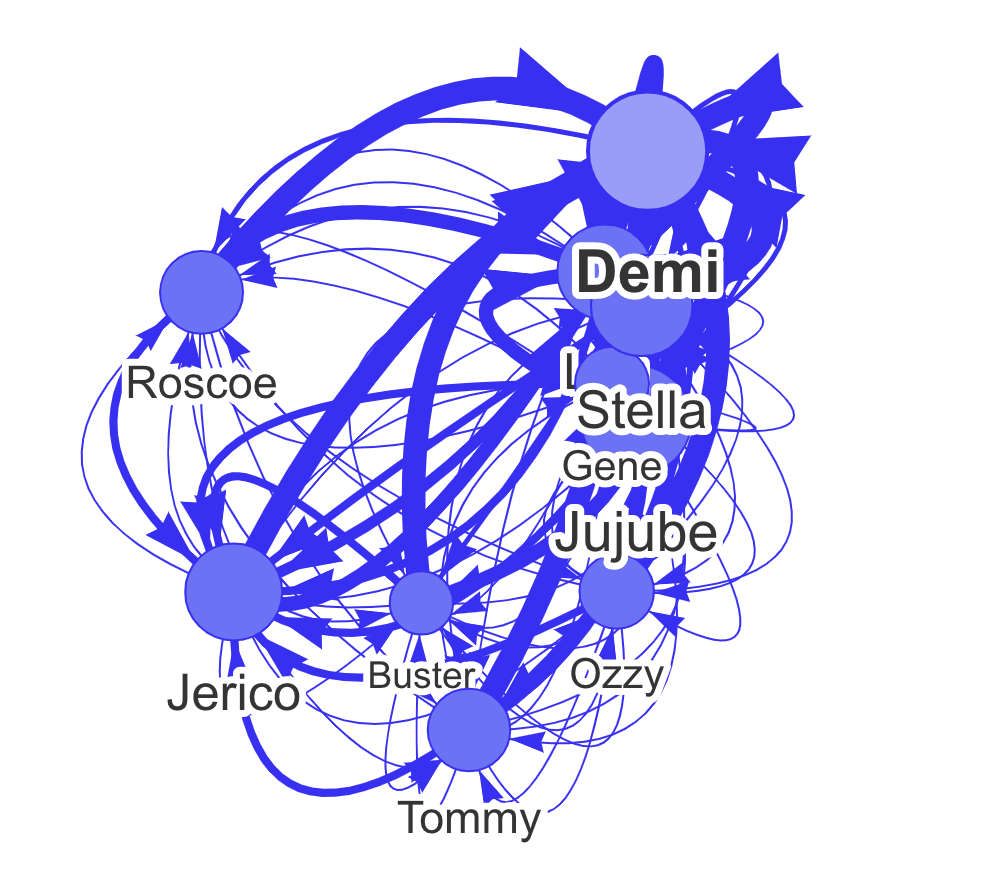
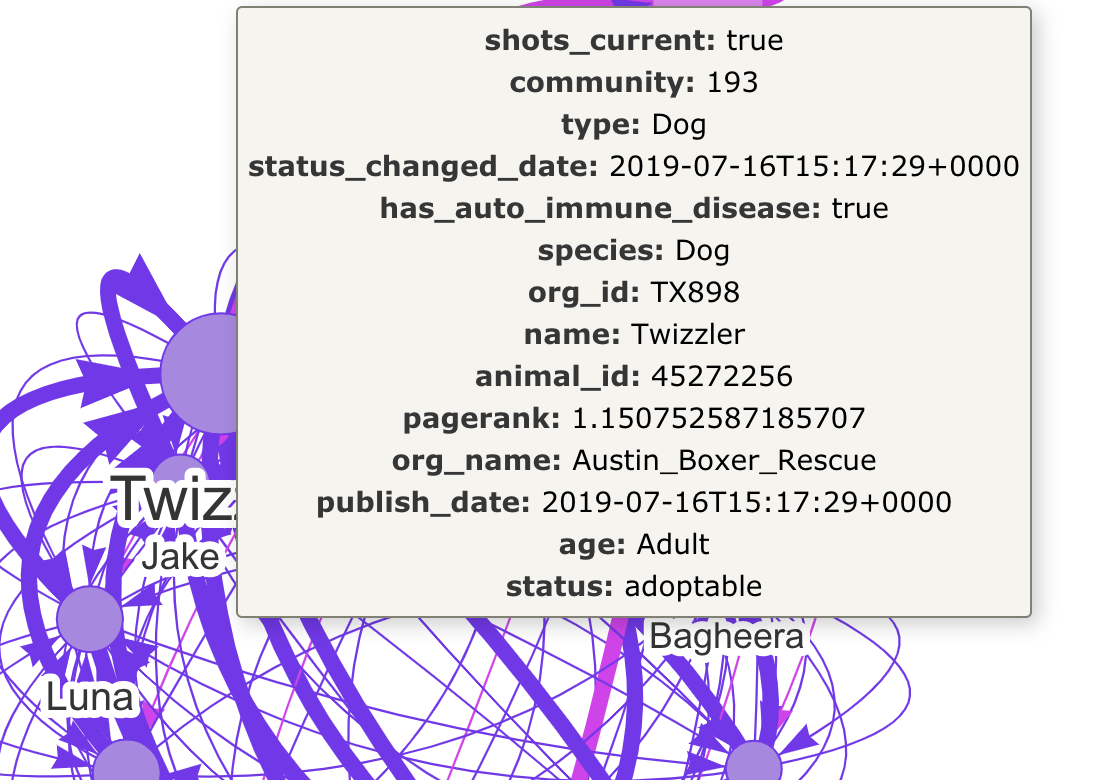
We are using the graph database platform Neo4j to build our Knowledge graph. We ingested the animal and shelter data from the Petfinder API and the animal's autoimmune disease data from the Wisdom study. We calculated edge weightings via a heuristic based off an animal's age, vaccine records, and genetics. We applied centrality analysis via PageRank. Our frontend was built using Vue.js and Typescript. Graph representation was built using Neovis.js
Challenges we ran into
We were limited in the browser capacity for running Neovis.js, so we had to limit the number of nodes to a subset of the data. General industry wide issues with graph vizualization, ie, "hairballs".
Accomplishments that we're proud of
Team Dynamics & Morale Solving a problem that saves lives
What we learned
Neo4J & Graph database Interesting pet data from Petfinder API
What's next for paw.graph
Time discounting factor Vet record integration including time of visit Increase degrees of separation Connect microchip numbers Expand disease types: rabies, parvo, etc Contact points
Built With
- neo4j
- neovis.js
- petfinder
- typescript
- vue.js
- wisdom

Log in or sign up for Devpost to join the conversation.