-
-
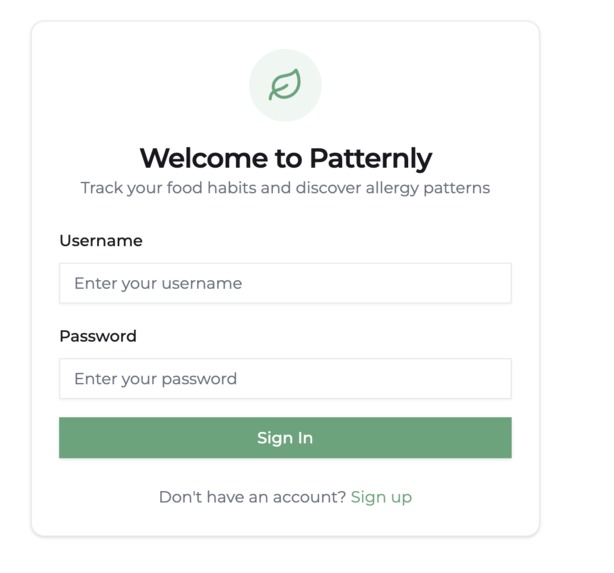
Log what you eat, track how you feel,let AI connect the dots. From your morning meal to your midnight flare-up, every data point tells story
-
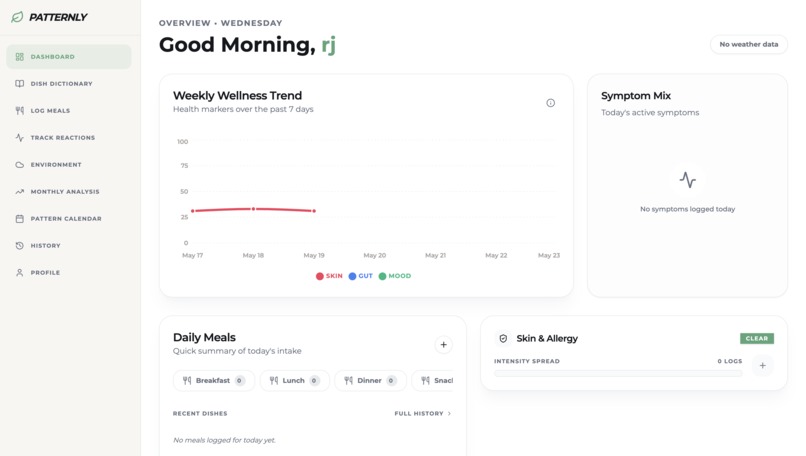
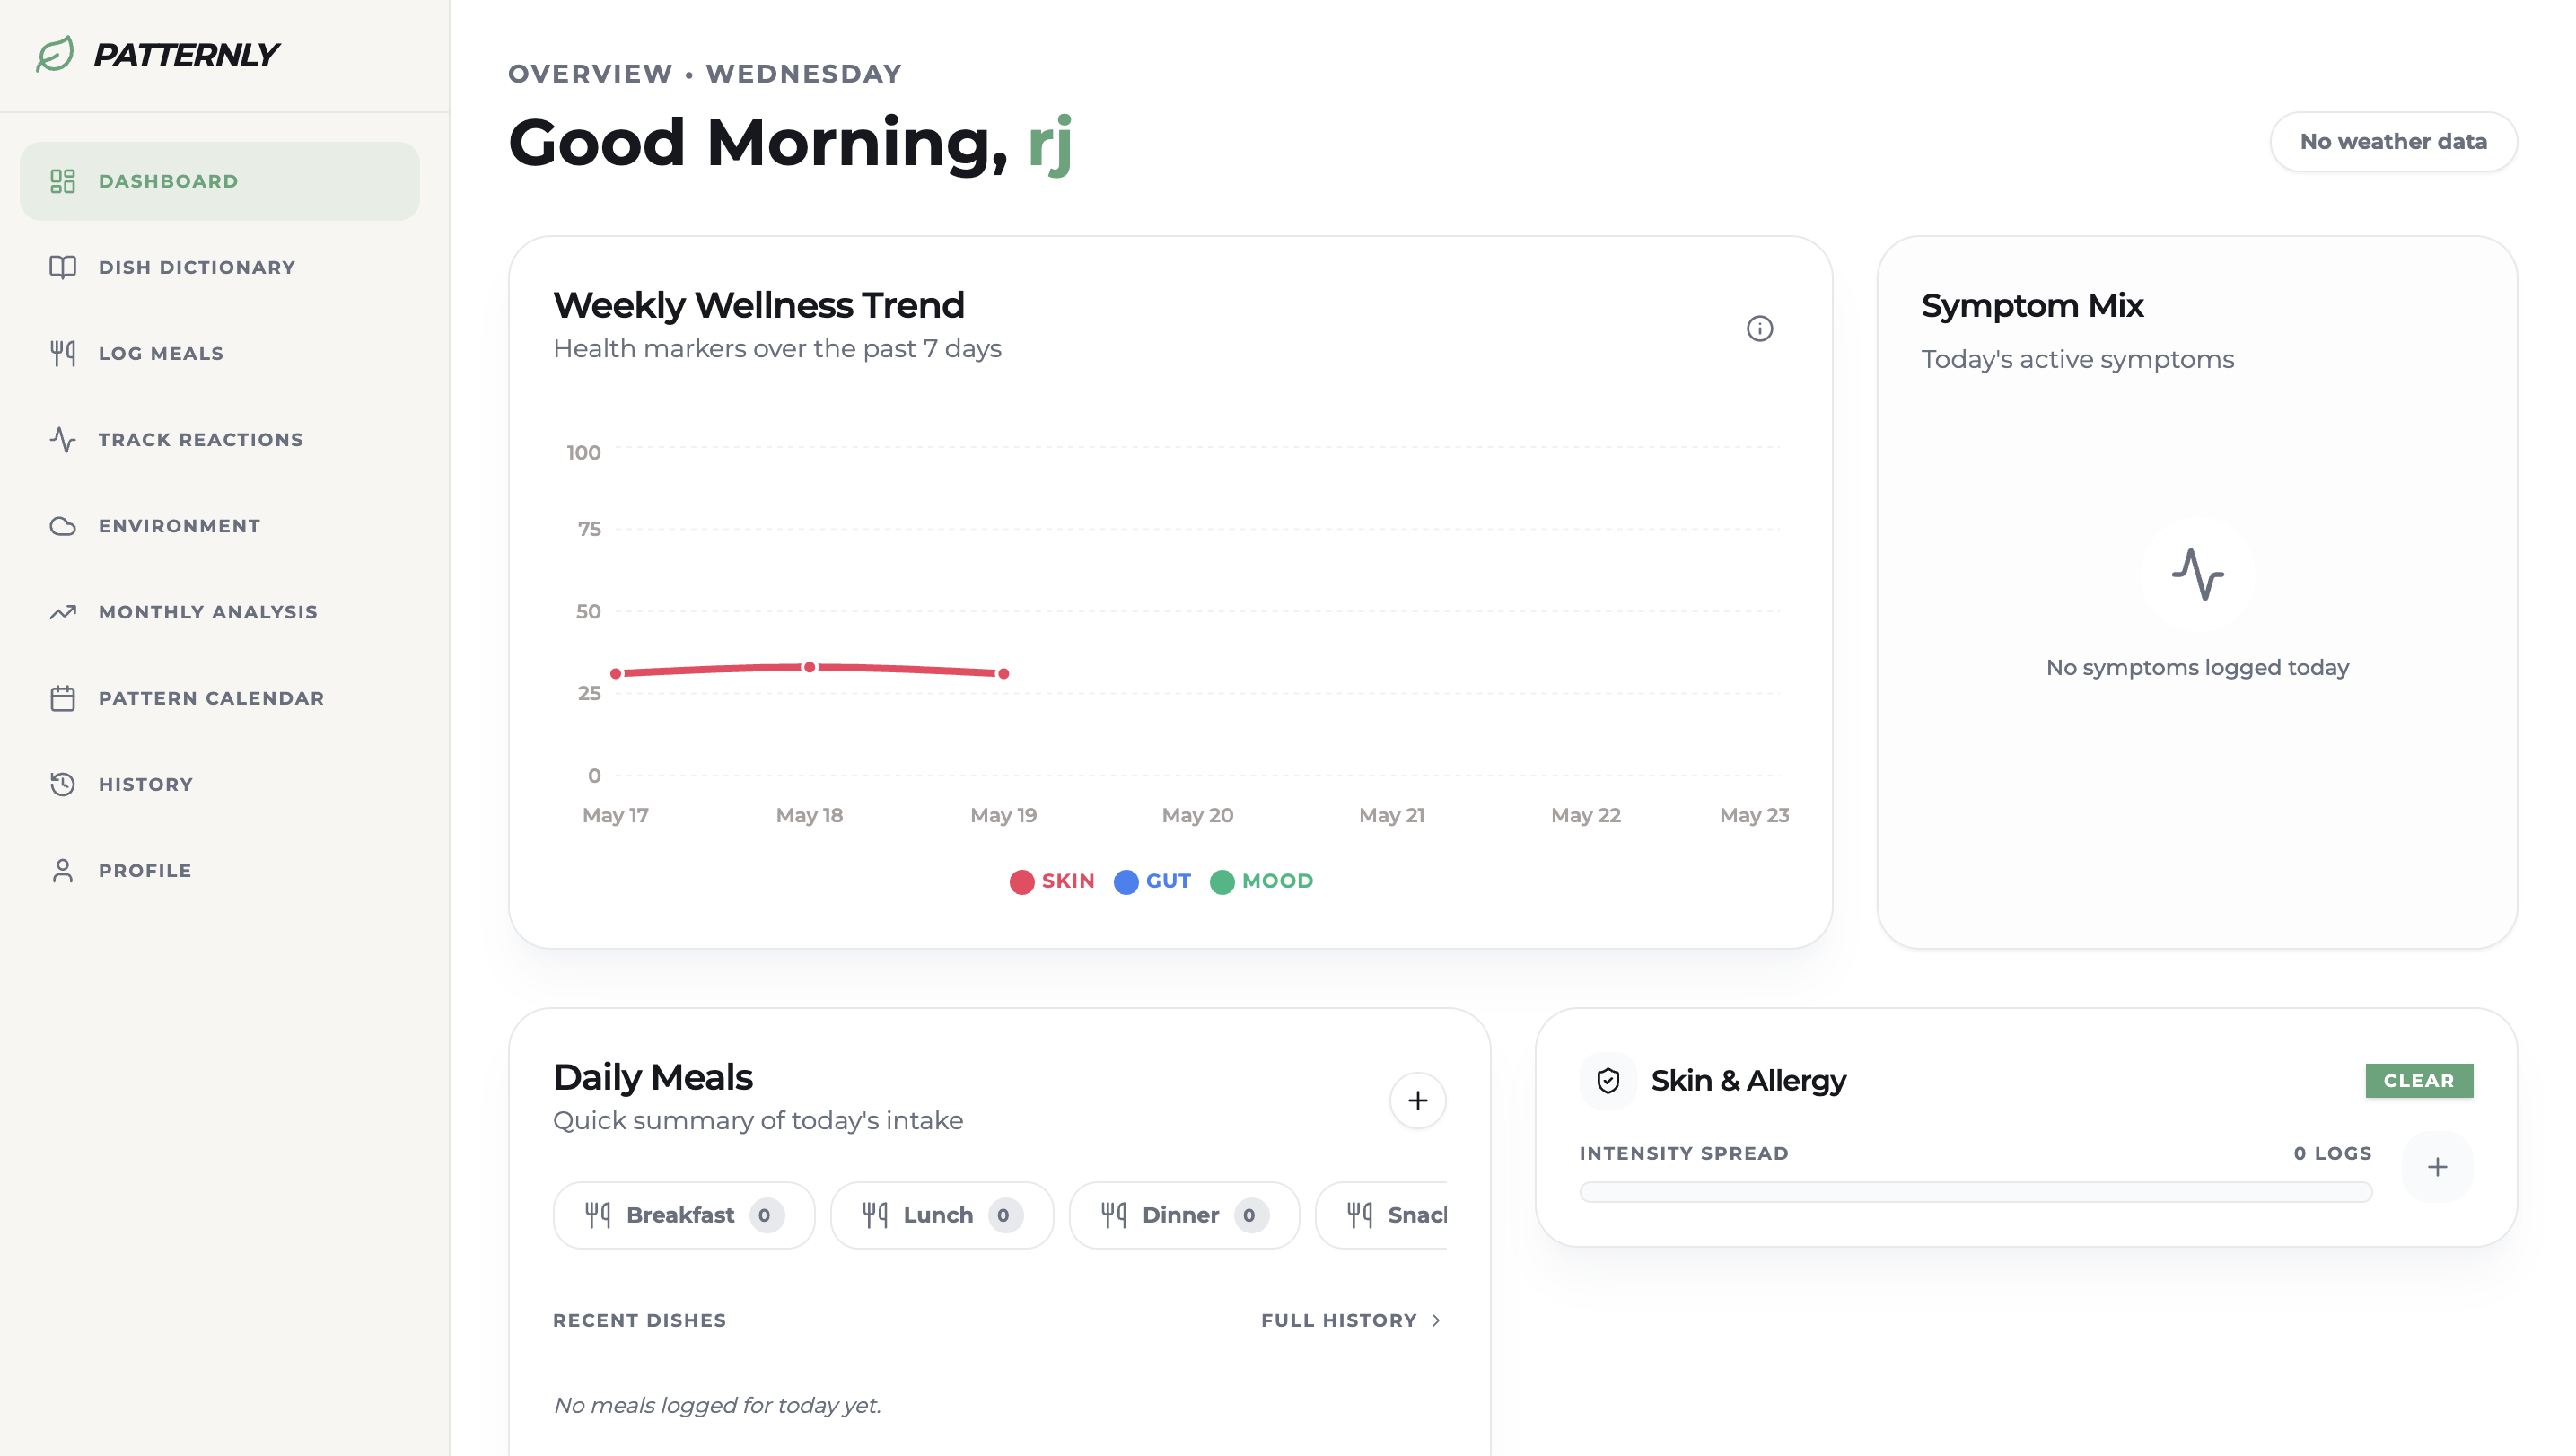
Everything that matters— your weekly wellness trend, today's symptom mix,daily meals condensed into one calm, clear view
About Patternly
Inspiration
It started with a frustrating, all-too-familiar question: "What did I eat that caused this?"
For hundreds of millions of people living with chronic skin conditions, food sensitivities, or digestive issues, a flare-up rarely happens the moment you eat something. The reaction can take anywhere from 24 to 72 hours to manifest — long after the meal is forgotten, the leftovers are gone, and the mental log has been overwritten by a hundred other things. Human memory simply wasn't built to track delayed biological responses across days of meals, moods, and environments.
We kept seeing the same silent struggle: people rotating through elimination diets on gut instinct, spending years on trial and error, visiting dermatologists with no concrete data to show — just vague recollections. "I think it might be dairy? Or maybe gluten? I'm not sure."
That's when the idea clicked. What if you had a Digital Detective — something that never forgot what you ate, never missed a symptom you logged, and could quietly connect dots across weeks of data that your brain never could? Not a generic food diary. Not another calorie counter. A personal pattern engine built specifically for people whose bodies speak in delayed signals.
That's why we built Patternly.
What It Does
Patternly is an intelligent health-tracking ecosystem that bridges the gap between diet, environment, and well-being — turning scattered daily observations into actionable biological insight.
Core Features
Intelligent Meal Logging — Users build a personal Dish Dictionary with full ingredient breakdowns. Meals are logged by meal type (breakfast, lunch, dinner, snack) with time context, using text search or Whisper v3 voice-to-text for hands-free entry in under 30 seconds.
Symptom Reaction Tracking — After eating, users score their body's response across four health dimensions:
$$\text{Wellness Score} = \sum_{i=1}^{n} w_i \cdot s_i$$
Where $w_i$ is the normalized weight for each metric $i$ (accounting for whether high = good or high = bad), and $s_i$ is the raw symptom score on a $[0, 10]$ scale. Categories include:
- Skin & Allergy — acne severity, itching level, skin redness, overall skin health
- Gut Health — bloating, digestion comfort, acidity, hydration
- Mood & Stress — mood score, stress level
Fitness & Energy — energy level, fatigue level
- Environmental Context — The Environment module logs hydration intake, local weather, air quality, and non-food exposures (metals, plants, dust, chemicals, pets) — because not every "food reaction" is actually about food.
- Pattern Calendar (Wellness Heatmap) — A full month visualized as a color-coded calendar. Each day's wellness score determines its shade, letting users spot weekly and monthly trends at a glance.
- AI Monthly Deep Dive — At the end of each month, a Gemini 2.5 Flash–powered analysis cross-references the entire log history. It surfaces high-confidence trigger ingredients with reaction rates and confidence scores, for example:
"Tomatoes appeared in 9 meals and caused elevated symptoms in 7 (78% reaction rate), average severity 5.0/10. Confidence: 39."
- Meal History & Search — Filter the full archive by ingredient, date range, or meal type to trace any specific food across your history.
How We Built It
We built Patternly on a modern, reactive stack designed for speed, reliability, and calm UX:
| Layer | Technology |
|---|---|
| Frontend | React 18 + Vite |
| AI Brain | Gemini 2.5 Flash |
| Voice Input | Whisper v3 (OpenAI) |
| Database & Auth | Supabase |
| Styling | Tailwind CSS + shadcn/ui |
The architecture was deliberately minimal — a data-heavy product that feels calm. We prioritized whitespace, typography, and progressive disclosure so users aren't overwhelmed by the depth of what they're tracking.
The AI analysis pipeline was built using structured prompt engineering: rather than asking Gemini to "find patterns," we fed it normalized meal-reaction pairs and asked it to compute ingredient-level correlation statistics, classify them by confidence tier, and generate human-readable explanations — functioning less like a chatbot and more like a statistical analyst.
Challenges We Ran Into
Metric Normalization — The Inverted Scale Problem
The hardest engineering challenge was combining metrics that run in opposite directions into a single coherent Wellness Score. Energy and Hydration follow a high = better scale. Acne Severity and Itching follow a high = worse scale. Naively averaging them would produce meaningless output.
We solved this by building a metric configuration layer that applies directional weights before aggregation:
$$s_i' = \begin{cases} s_i & \text{if high is good} \ 10 - s_i & \text{if high is bad} \end{cases}$$
This normalization ensures the final Wellness Score is always intuitive — higher always means the user felt better that day — regardless of how the individual metric was scored.
SSO to Username Authentication Pivot
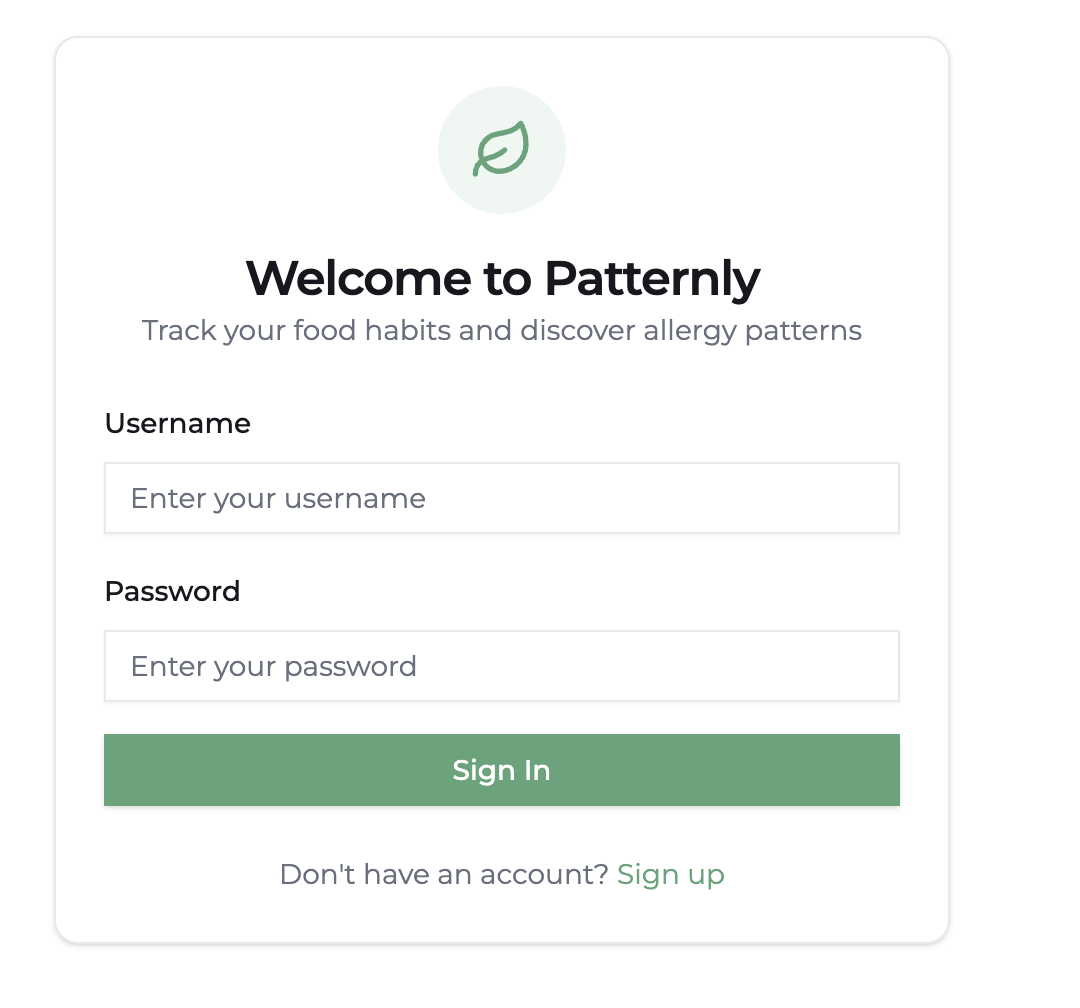
Mid-build, we shifted from a standard OAuth/SSO flow to a pure username-and-password system to reduce onboarding friction for our target users. This required re-engineering the Supabase authentication layer to simulate unique user identifiers without relying on email verification, while keeping the session management secure and seamless.
Accomplishments That We're Proud Of
Zero-friction logging — Between voice input, instant dish search, and package scanning, a full day's meals and reactions can be logged in under 30 seconds. The best tracking tool is one people actually use.
The Analysis Engine — Building a prompt pipeline that meaningfully distinguishes between coincidence and correlation — not just flagging every ingredient that appeared near a bad day, but computing reaction rates, confidence scores, and cross-meal frequency to surface only genuinely significant patterns.
The unified dashboard — Condensing diet, symptoms, environment, and trend data into a single, cohesive view without overwhelming the user. Every screen was designed to answer one question clearly.
What We Learned
Data is only as good as the context it lives in.
Tracking a meal is useless if you don't know the ingredients. Tracking a symptom is useless if you don't know the timing, the weather that day, or what else you consumed. This project fundamentally changed how we think about health data — not as isolated entries, but as an interconnected web where meaning only emerges across time.
We also learned to use AI not as a conversational novelty, but as a statistical reasoning layer — something that can find signal in the noise of daily biological life, where the patterns are real but invisible to the unaided eye.
What's Next for Patternly
Predictive Alerts — Using historical patterns to proactively warn users: "You've had high dairy intake for 3 consecutive days. Your skin typically reacts 24–48 hours later. Consider an anti-inflammatory meal today."
Community Safe-Lists — An opt-in global database where users contribute anonymized "safe food" and "trigger food" data, aggregated by sensitivity type to help newly diagnosed users get a head start.
Beyond Food & Skin Health — Expanding Patternly into a broader personal health intelligence platform capable of supporting additional use cases such as hormonal health tracking, migraine and fatigue analysis, autoimmune condition monitoring, fitness recovery insights, and personalized wellness recommendations. The long-term vision is to evolve Patternly from a food-reaction tracker into a comprehensive AI-powered biological pattern detection system that helps users better understand the complex interactions between lifestyle, environment, and long-term health.
Built With
- css
- framer
- gemini
- lucide
- motion
- openweathermap
- shadcn/ui
- supabase
- tailwind
- typescript
- vite
- whisper

Log in or sign up for Devpost to join the conversation.