-
-
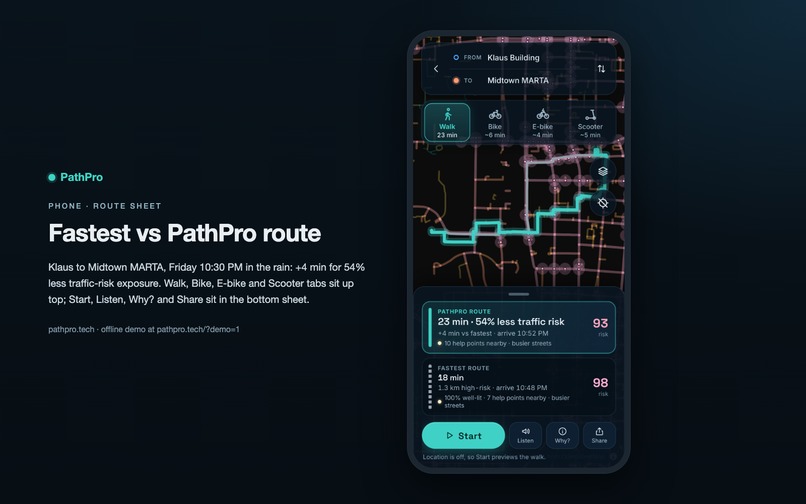
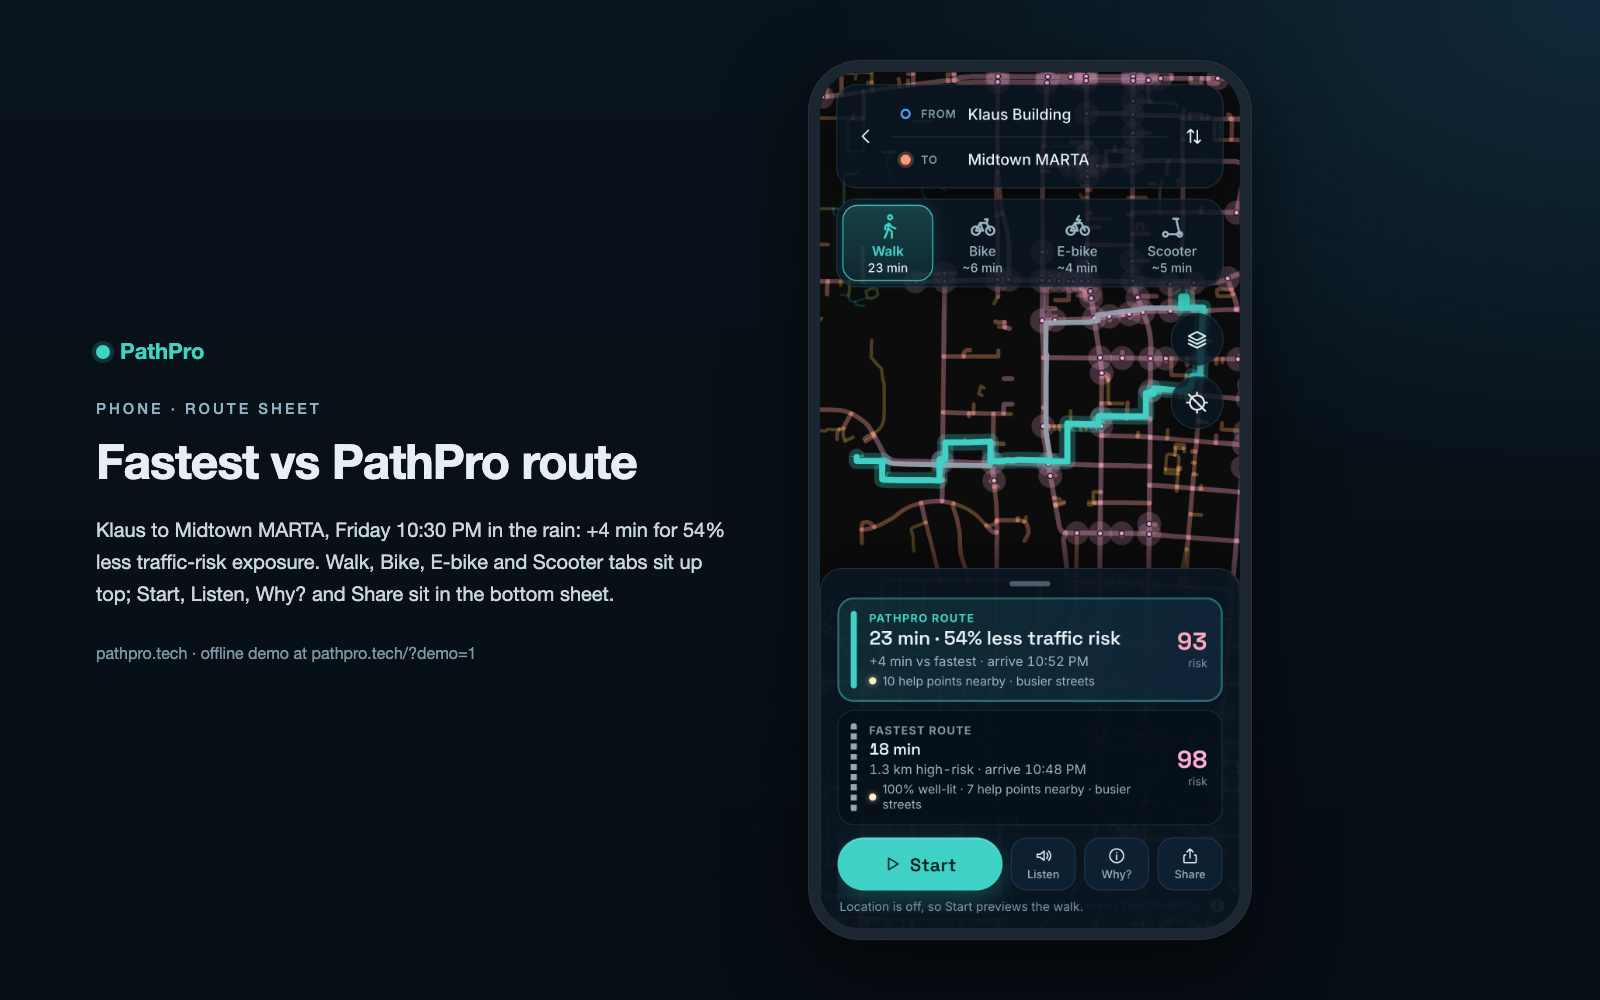
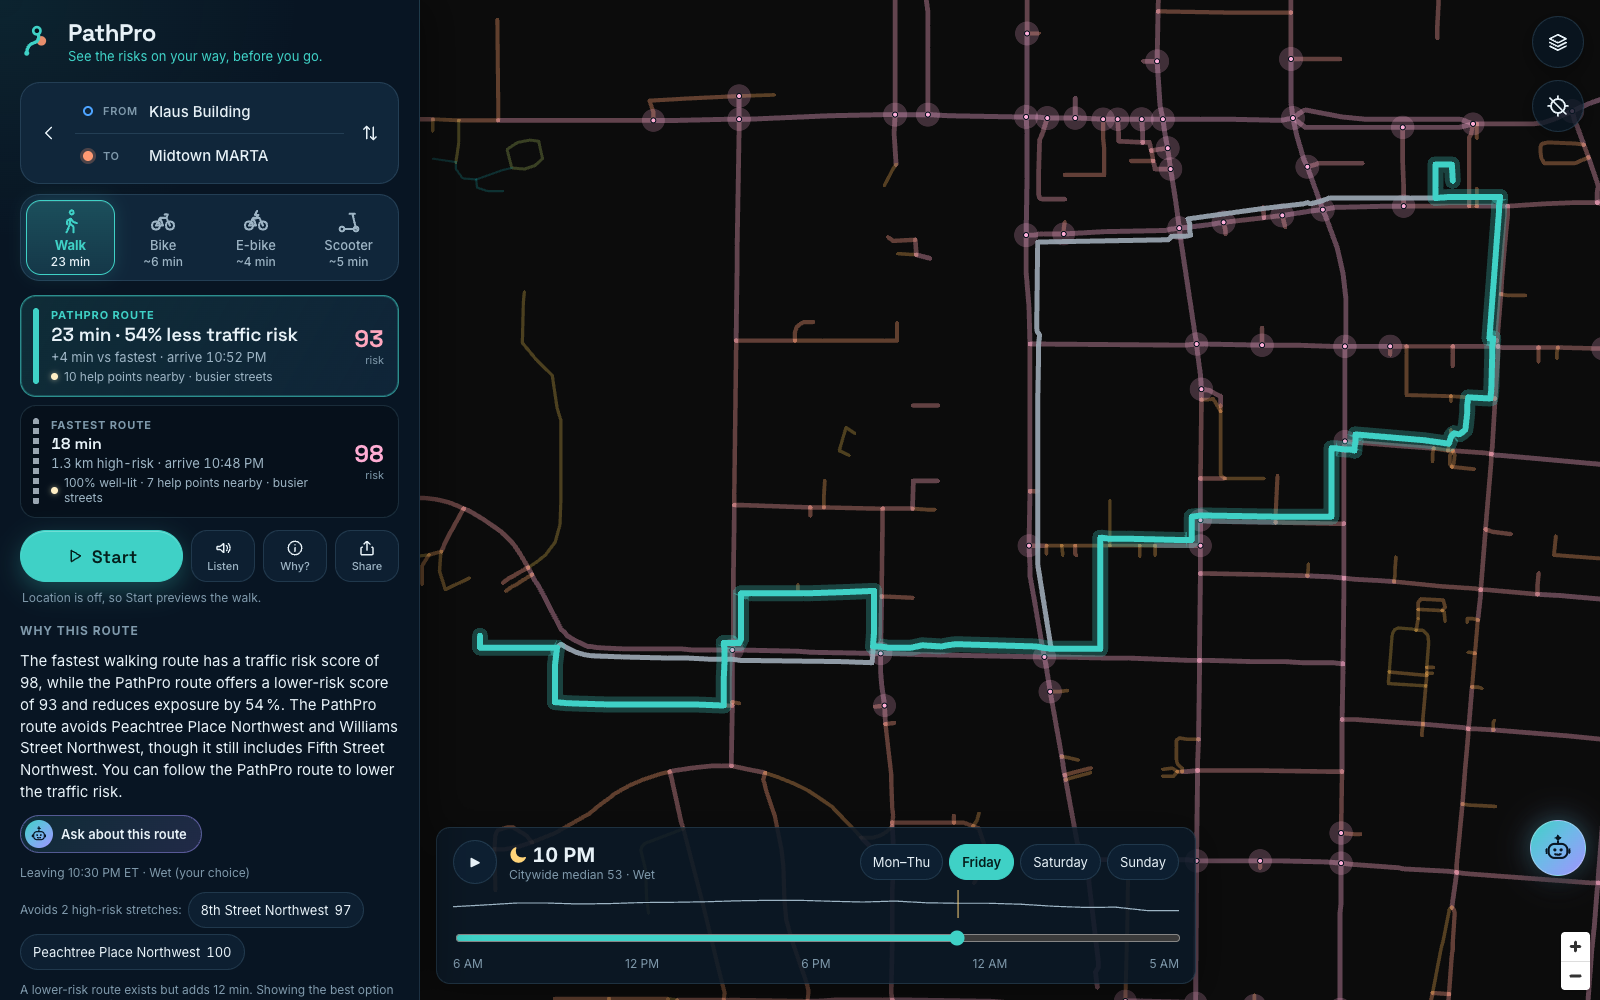
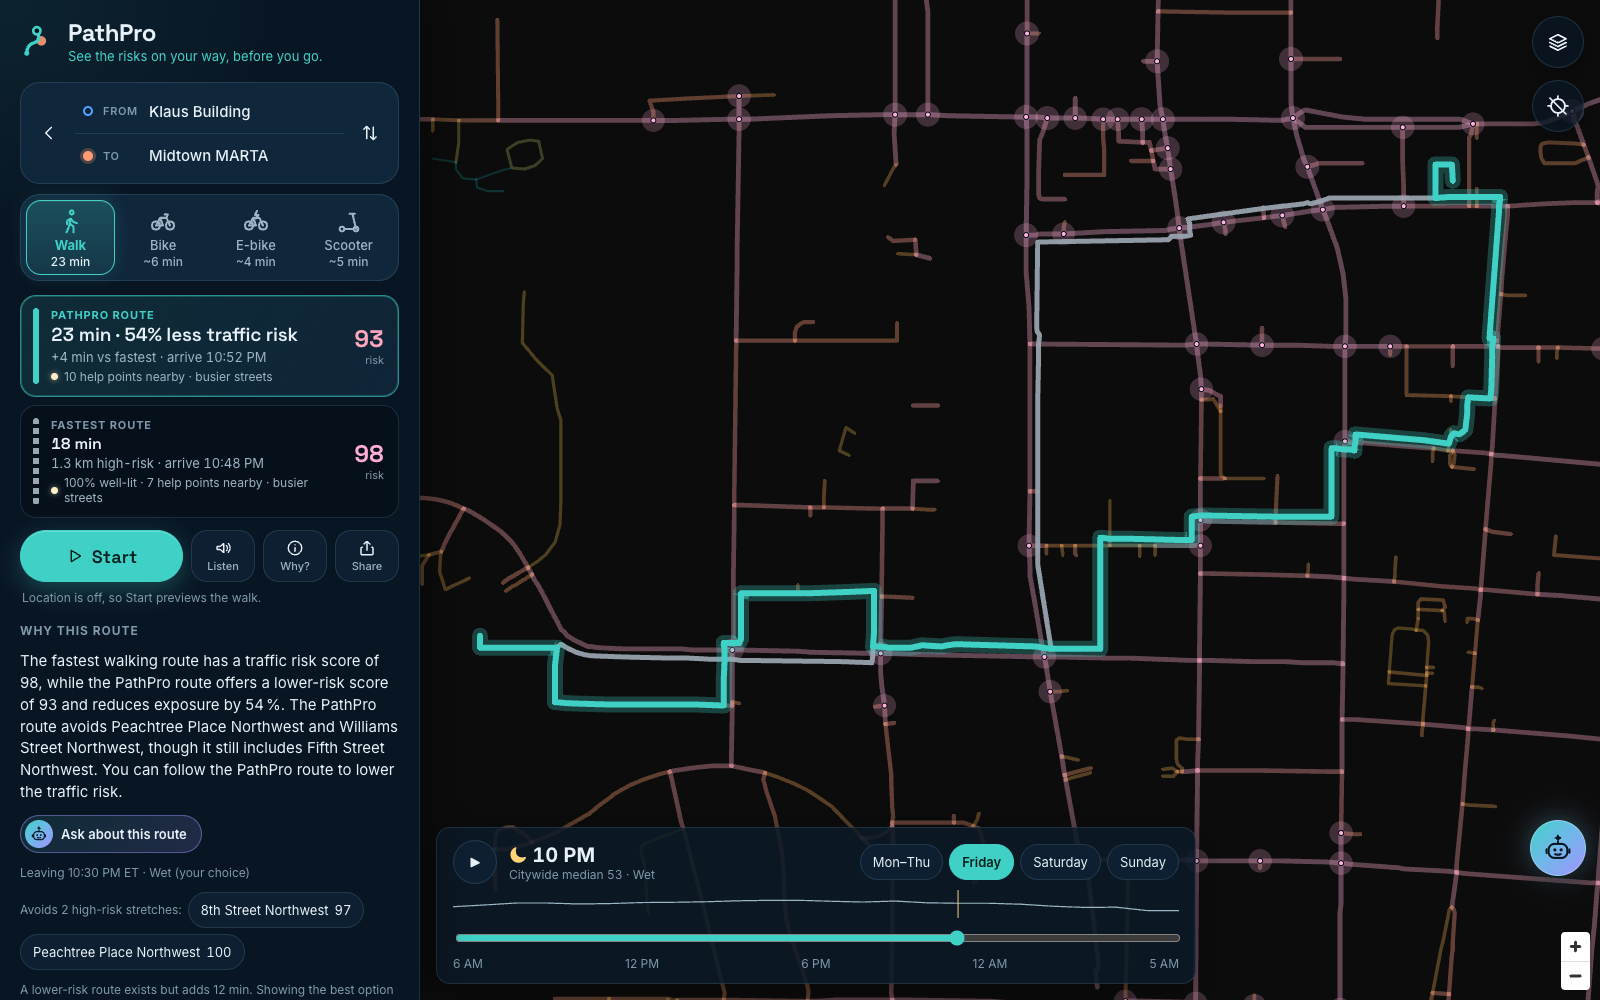
Two taps to a route: 4 more minutes than the fastest walk, 54% less traffic risk
-
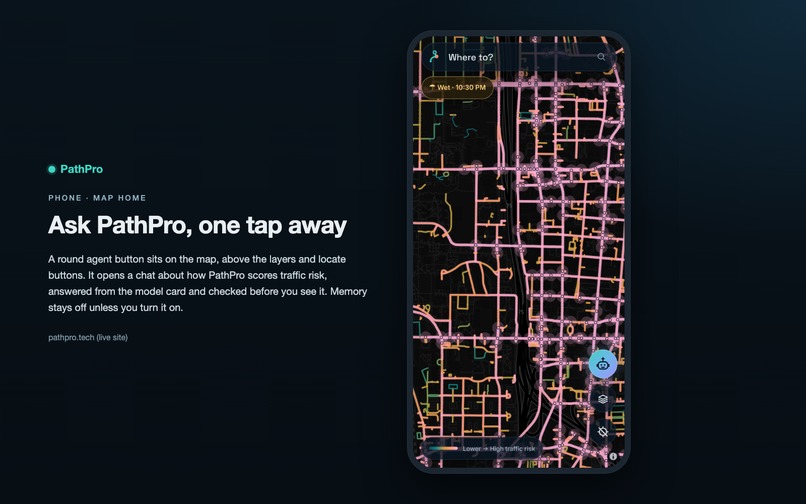
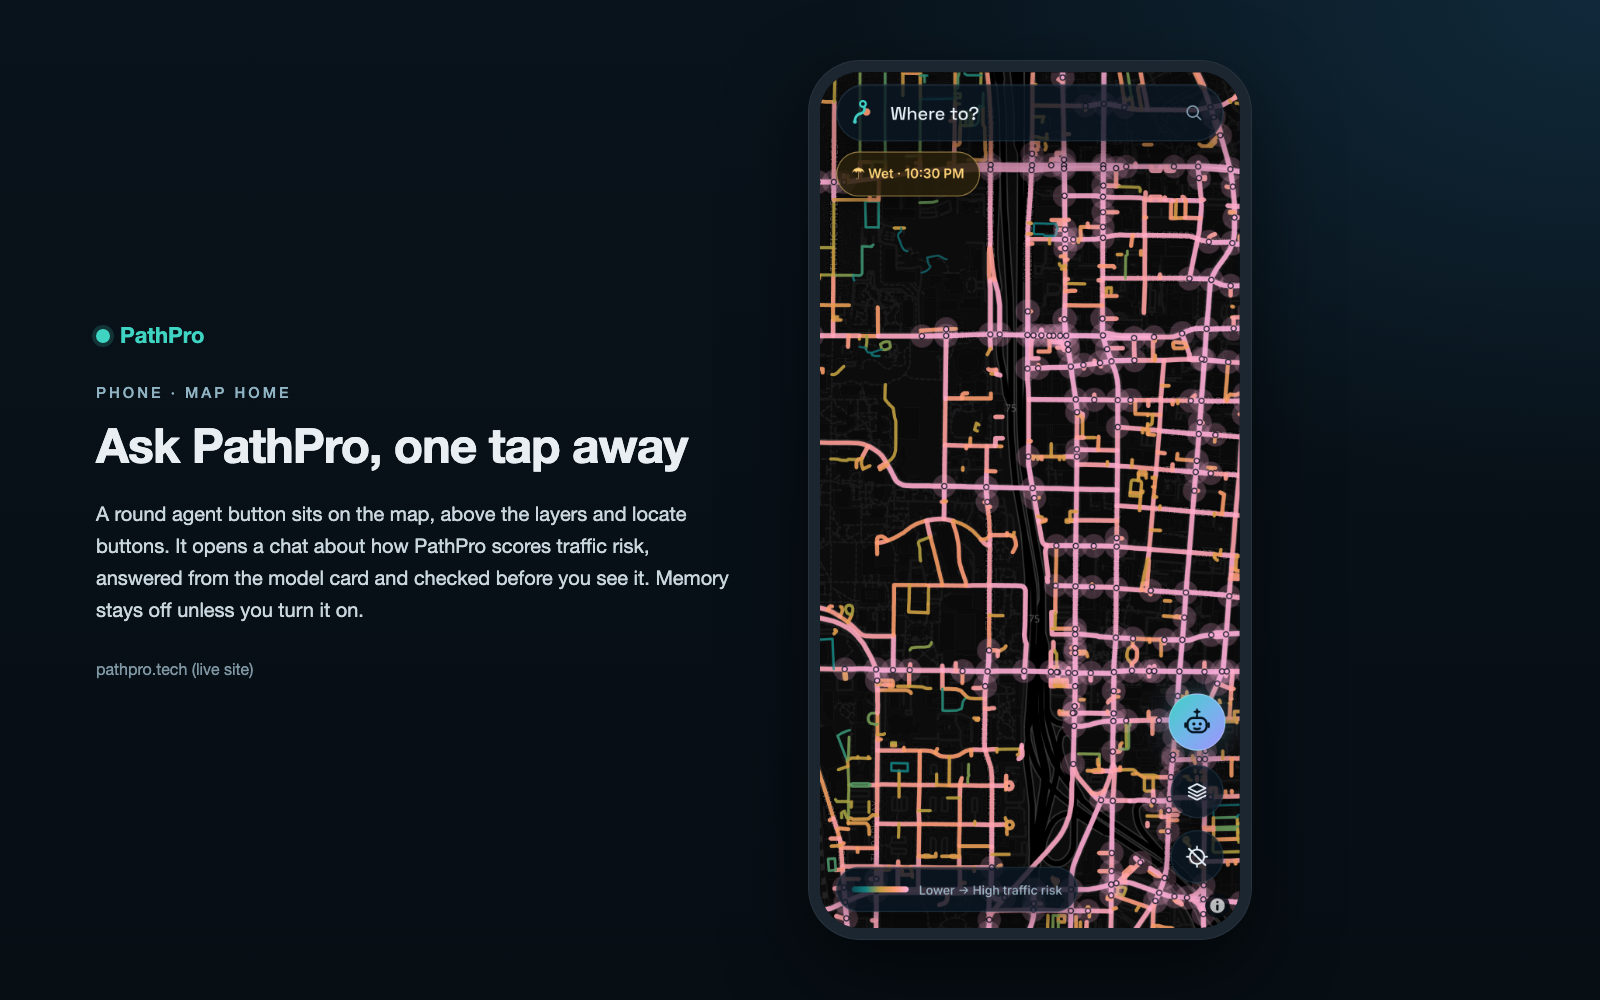
Ask PathPro: an agent on the map, one tap away
-
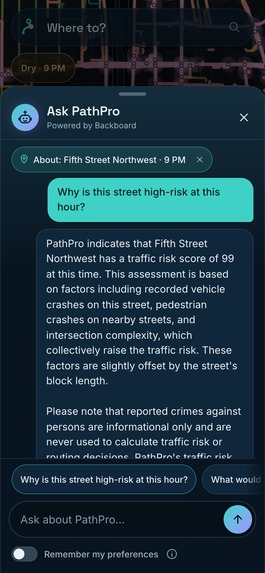
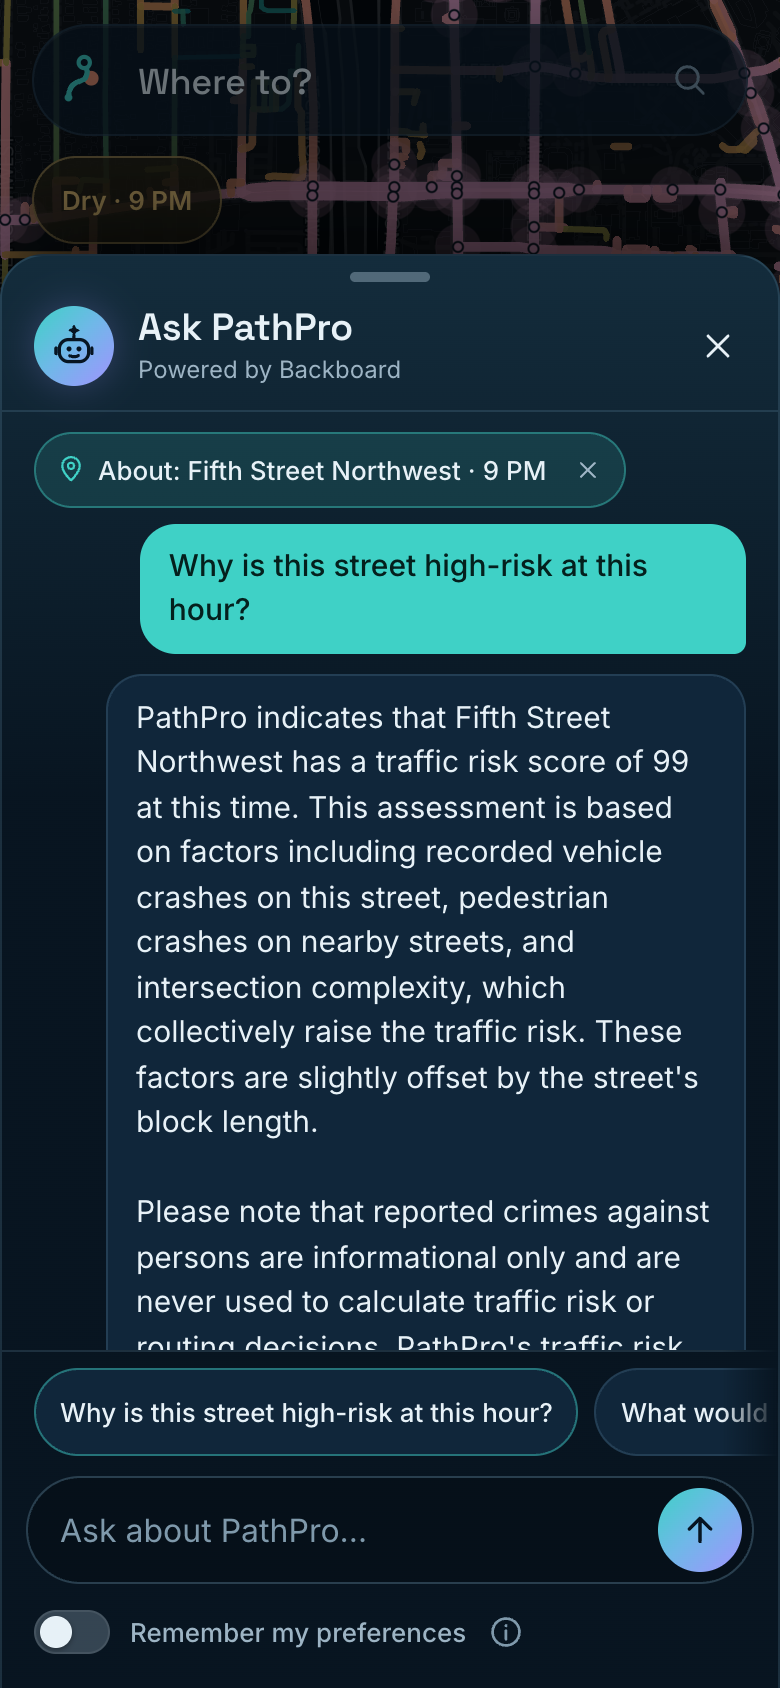
Ask about this street: answers grounded in the same factors as the score
-
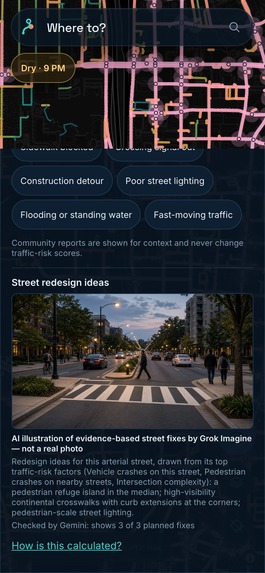
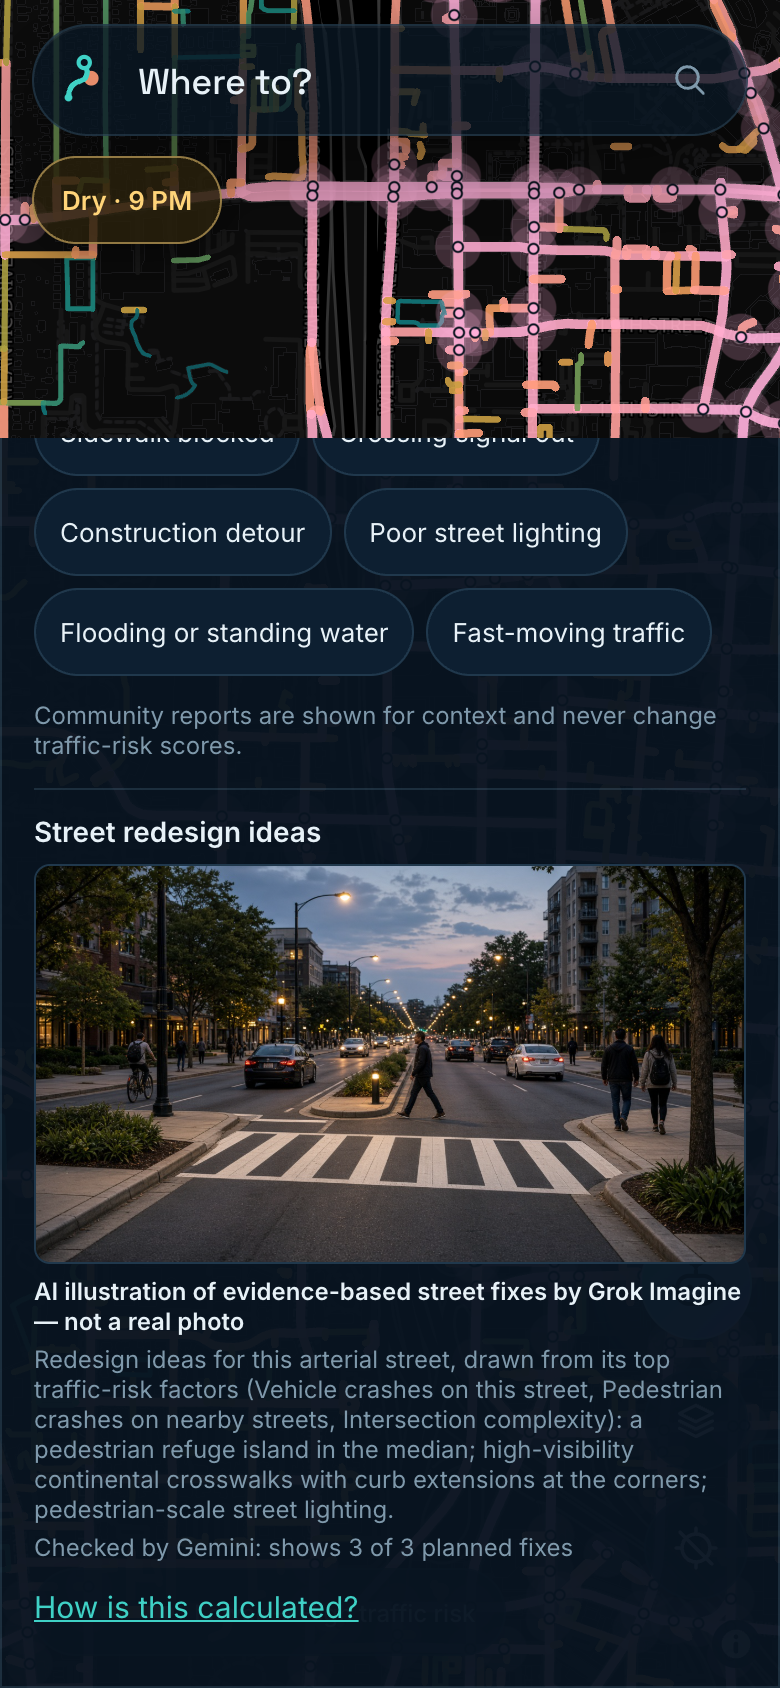
Imagine this street redesigned: Grok Imagine draws evidence-based fixes, checked by Gemini (not a real photo)
-
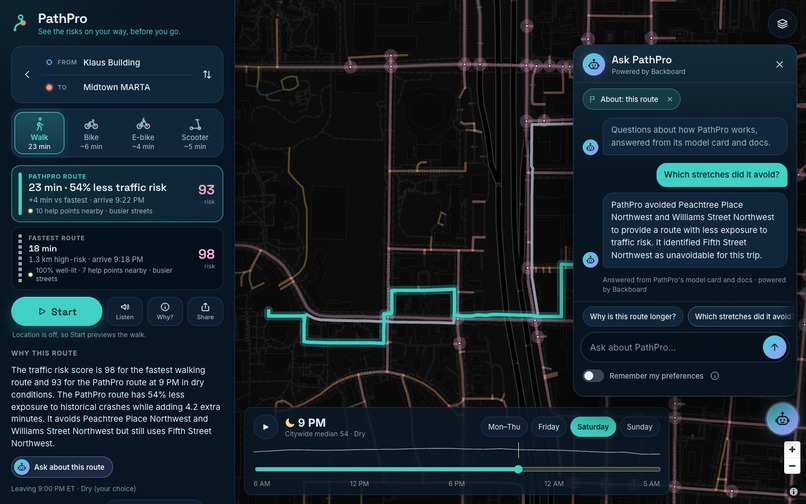
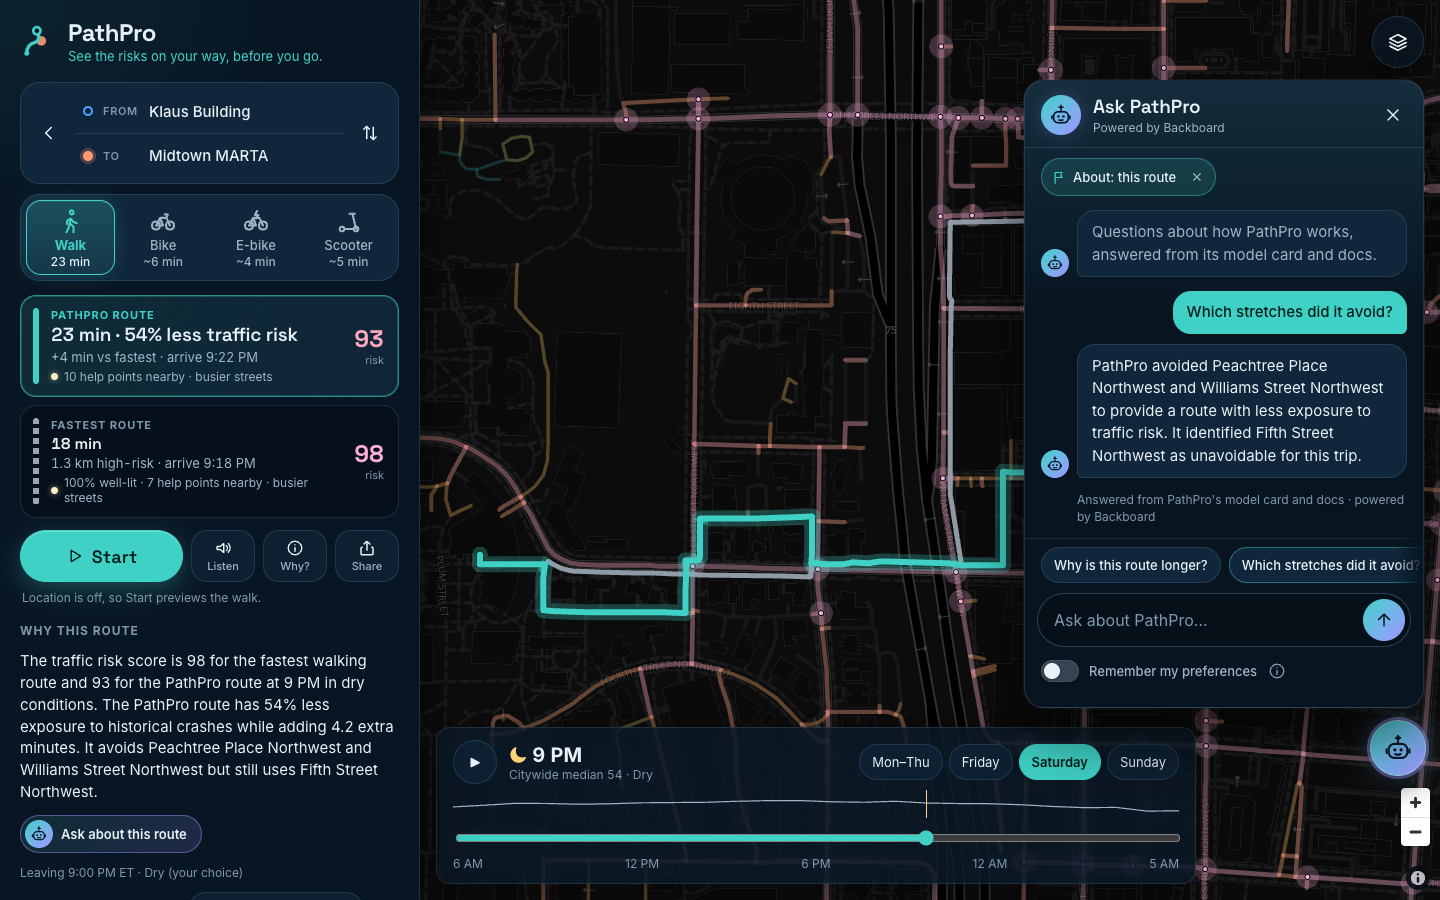
Ask about this route: which high-risk stretches it avoided, in a docked chat
-
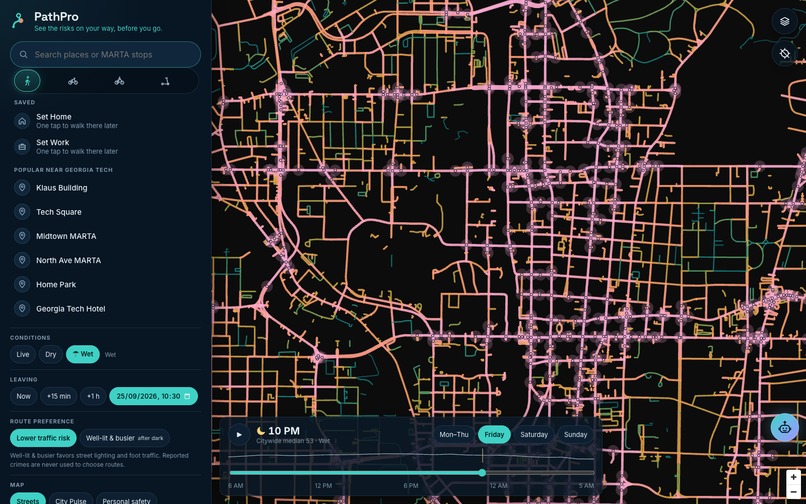
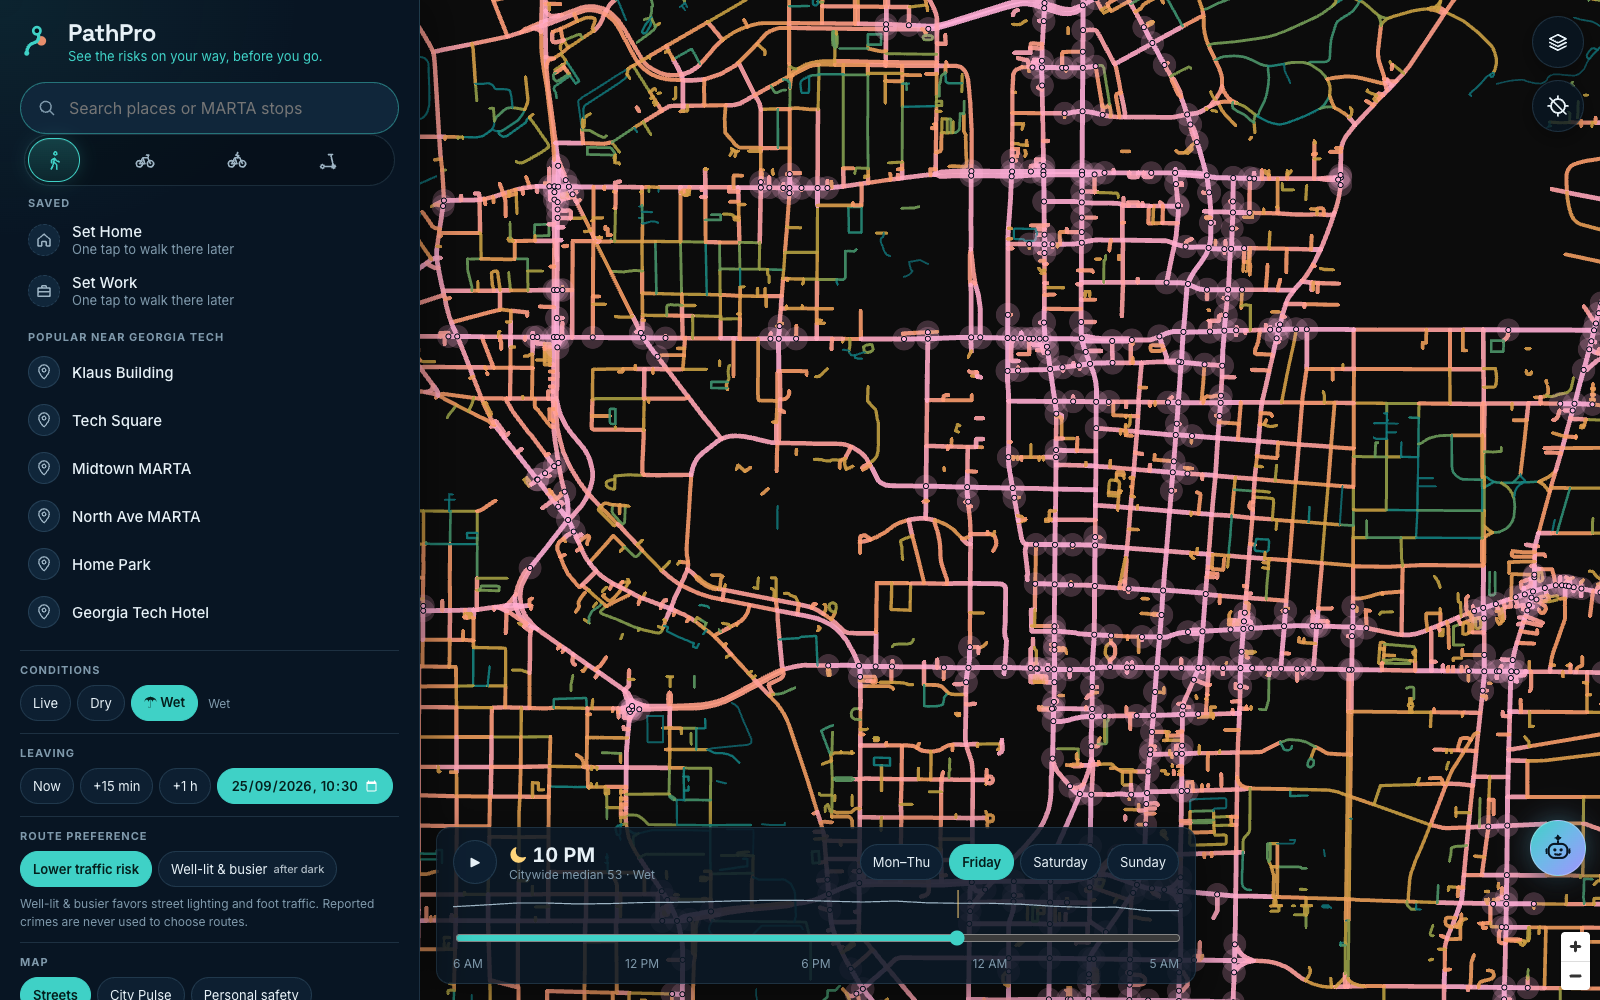
Risk Tides: traffic risk across Atlanta, hour by hour, dry or wet
-
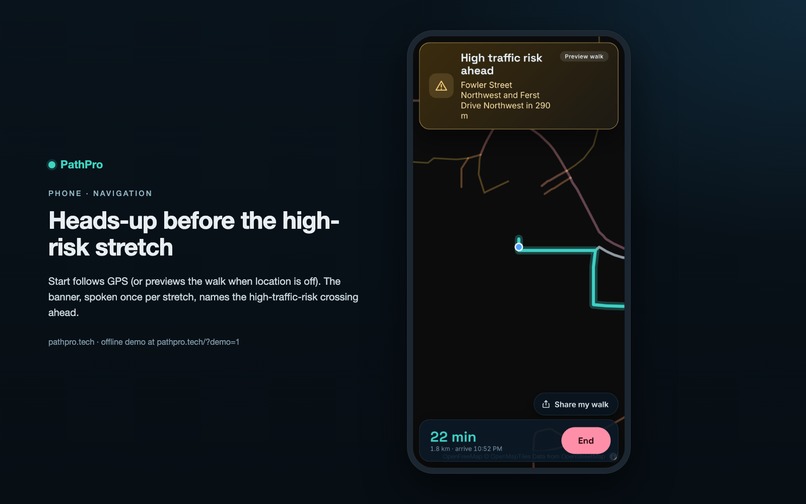
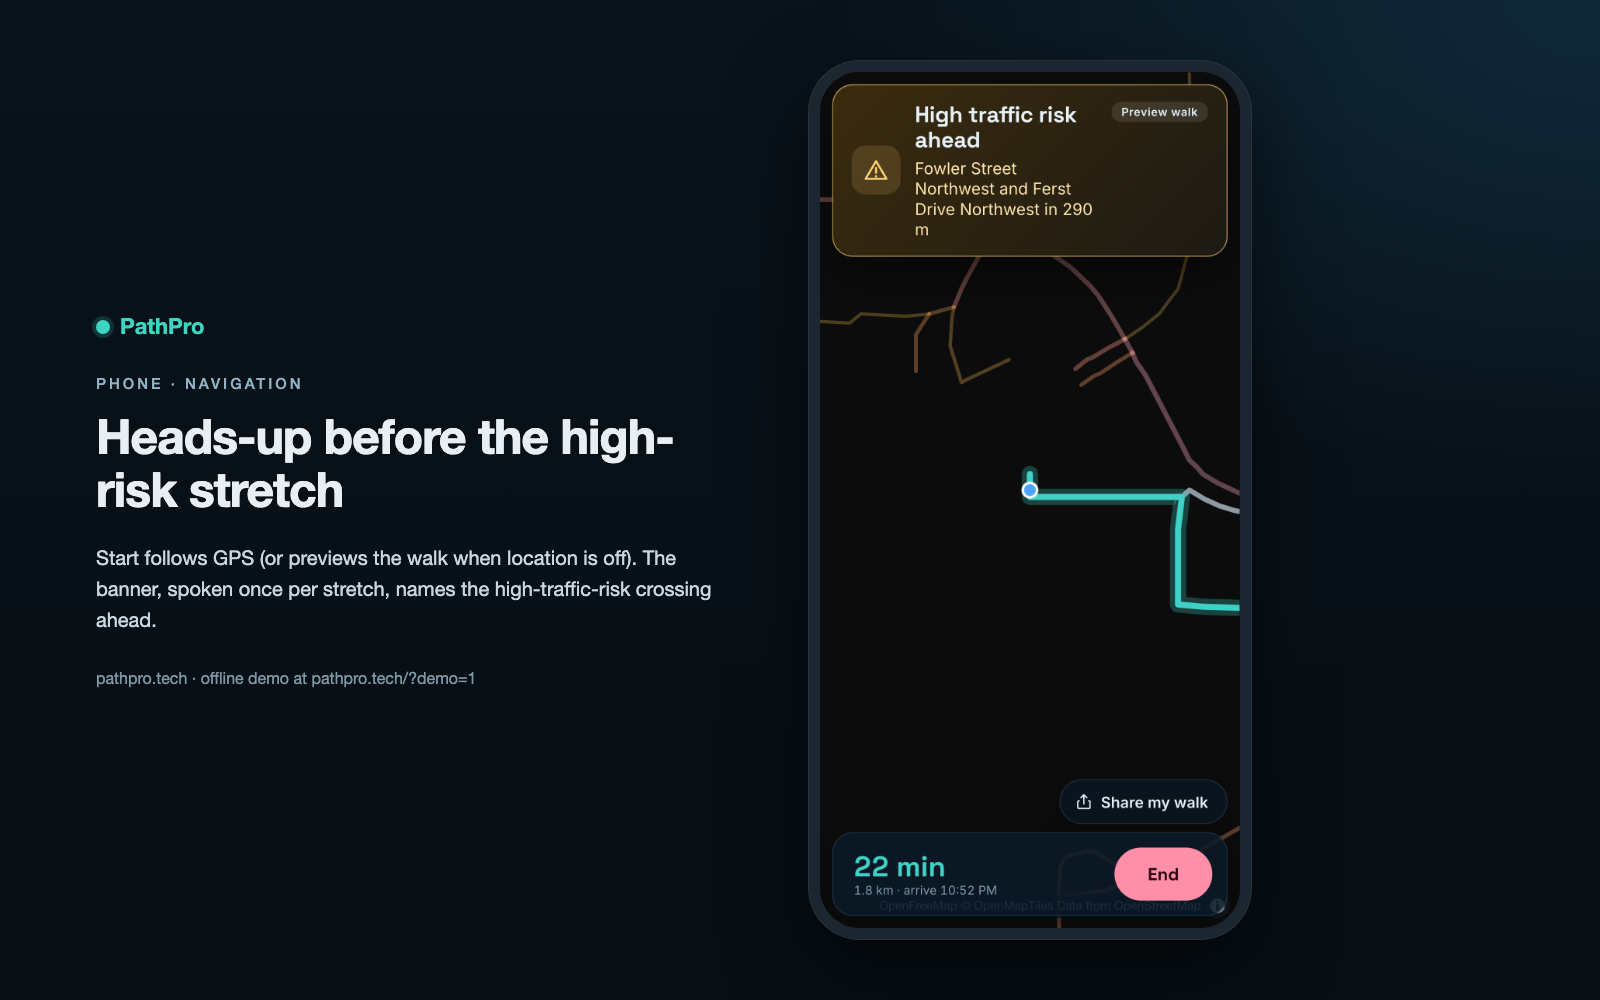
Walking navigation calls out high-risk stretches before you reach them, in Grok Voice
-
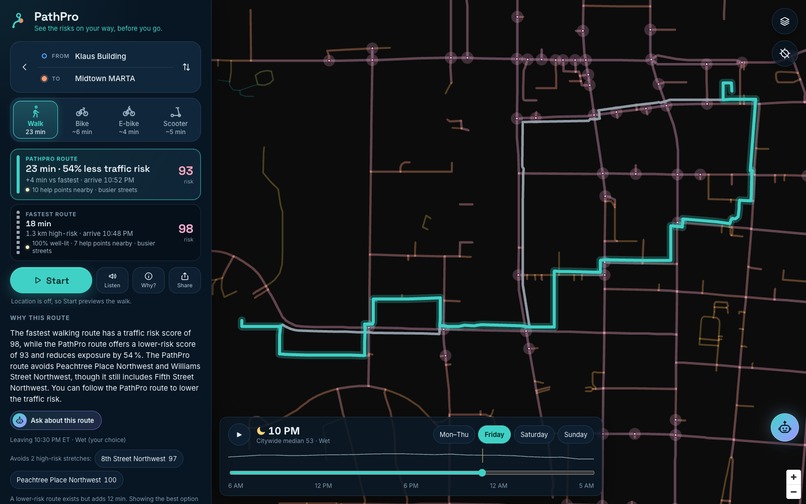
Why this route: a grounded explanation, the stretches it avoids, and Ask about this route
-
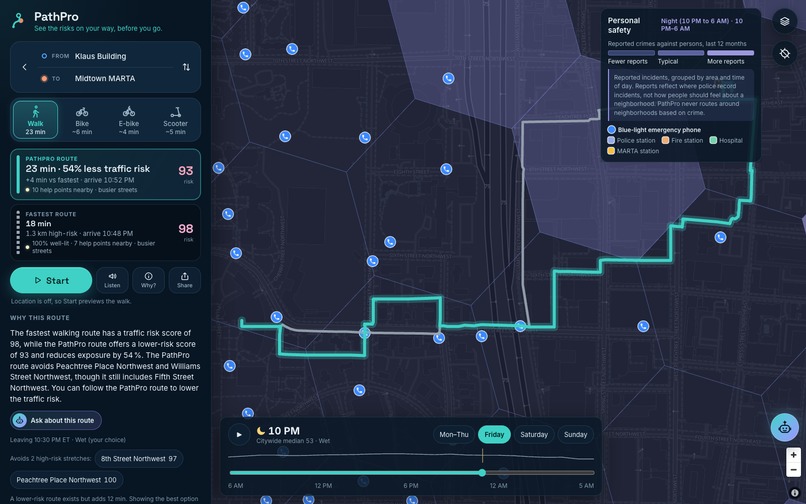
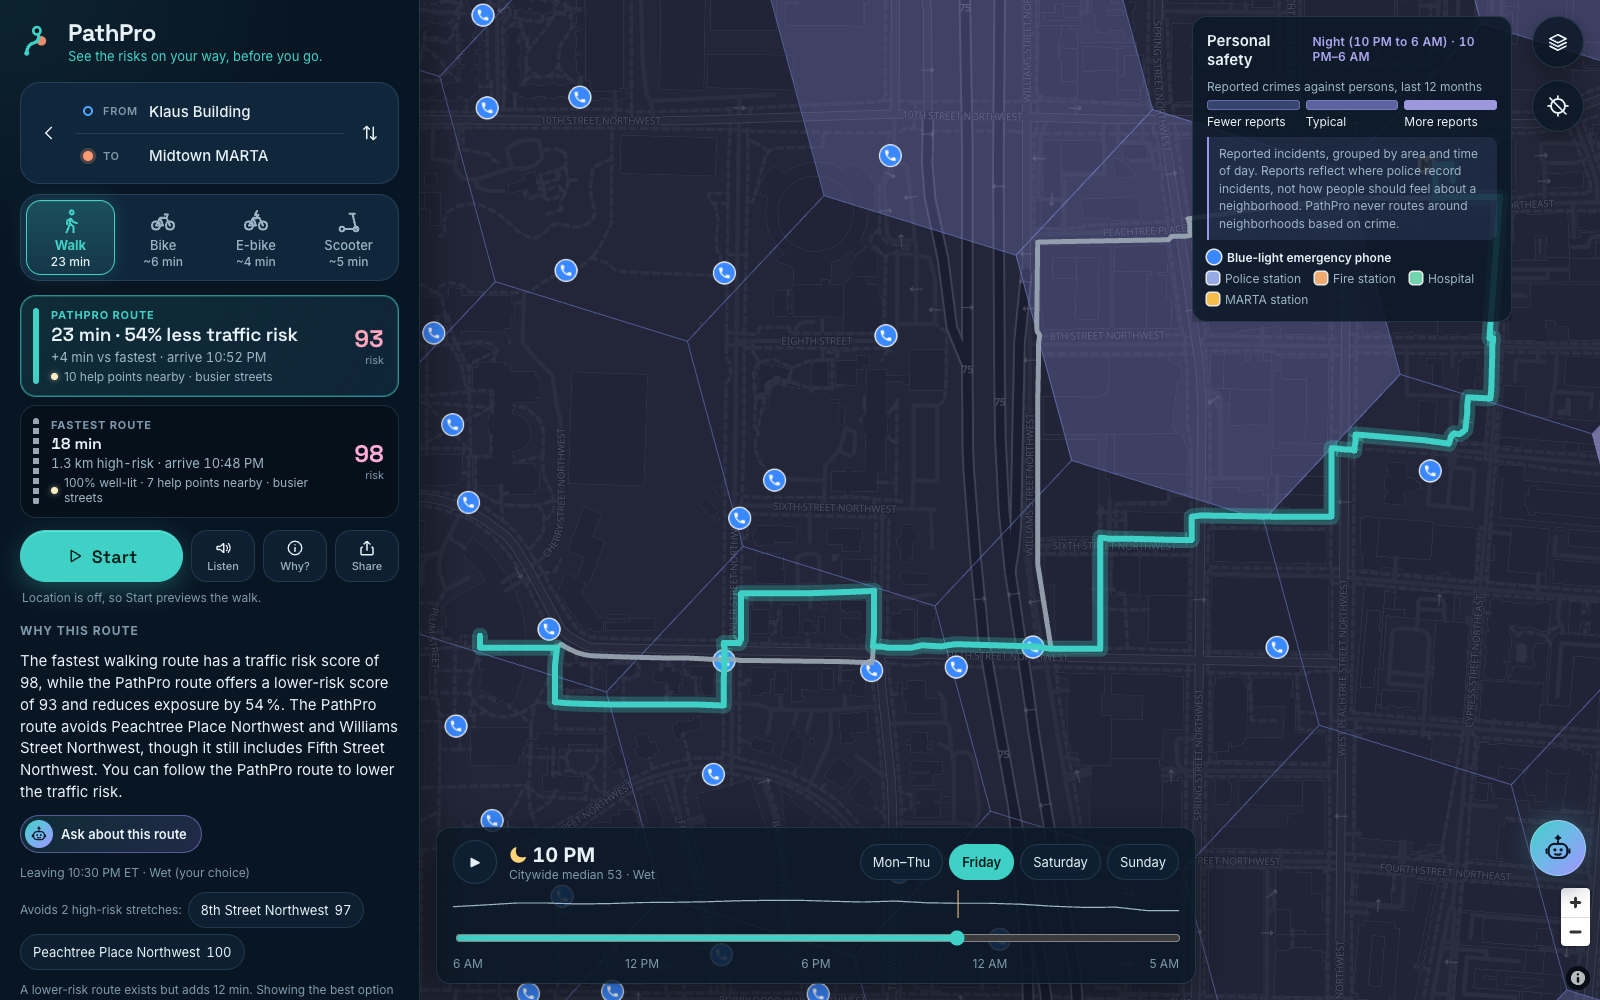
Crime reports by area and time of day, with help points and a fairness note. Never used for routing
-
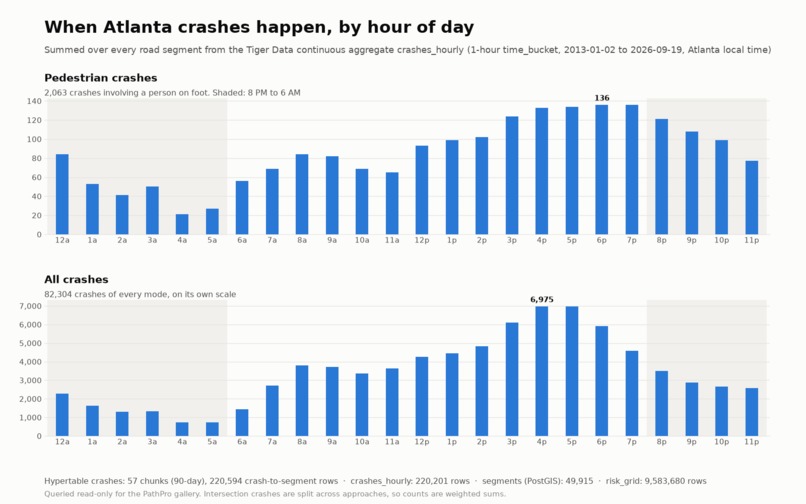
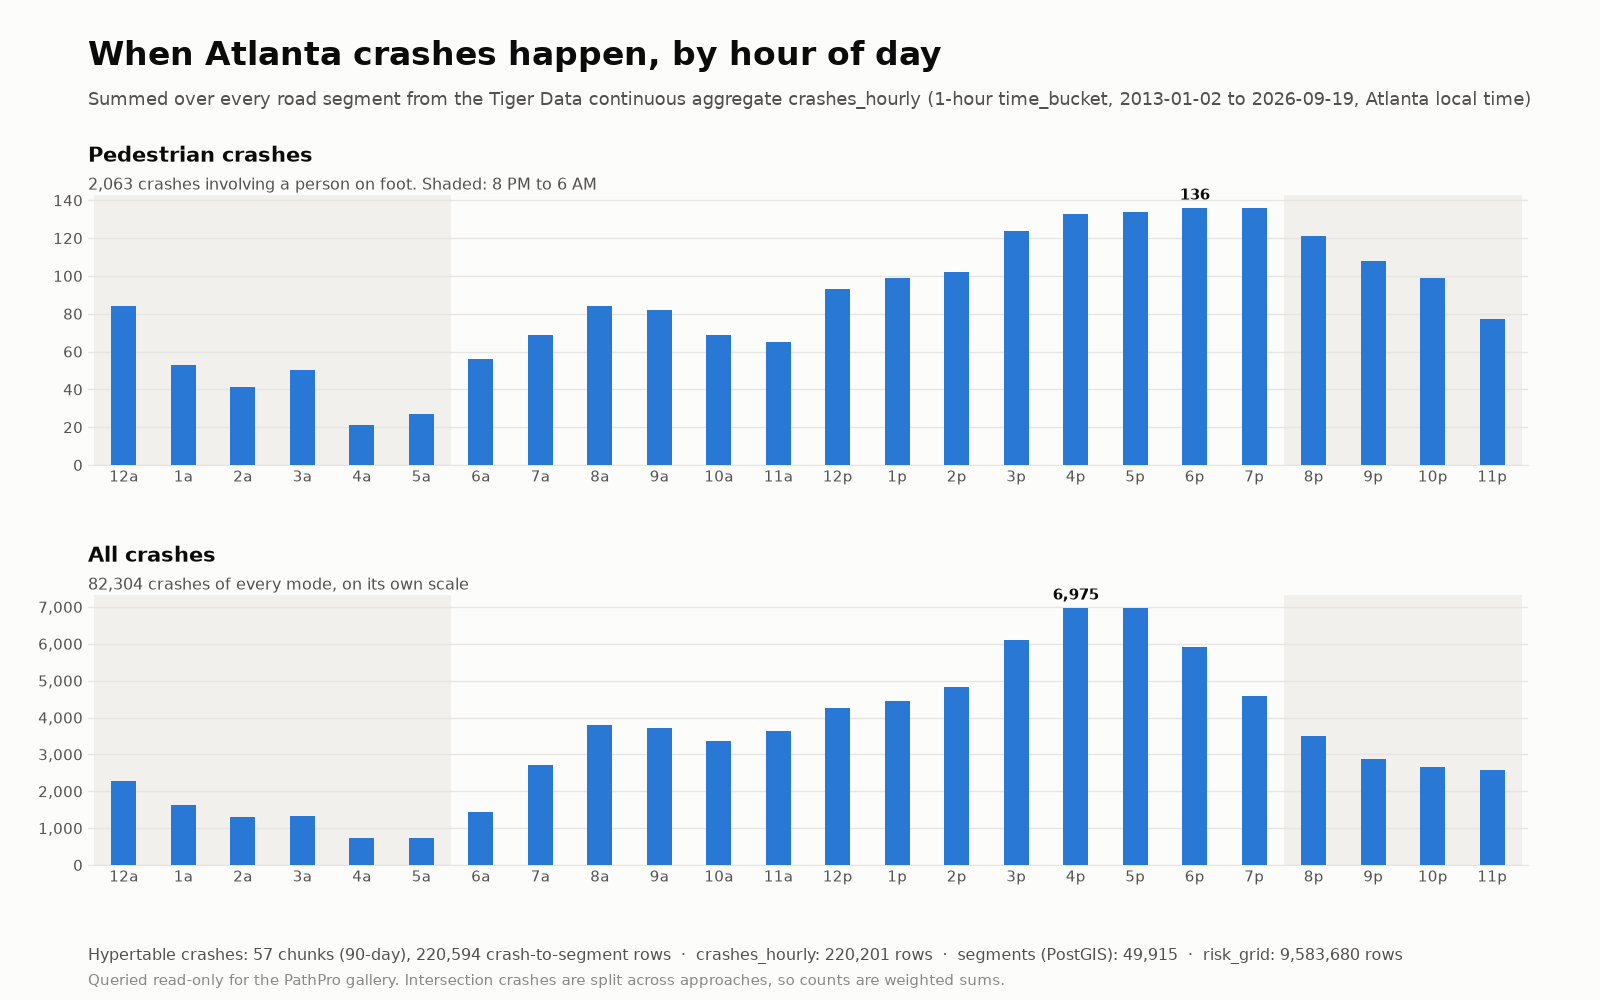
When crashes happened on this street, from a Tiger Data continuous aggregate
-
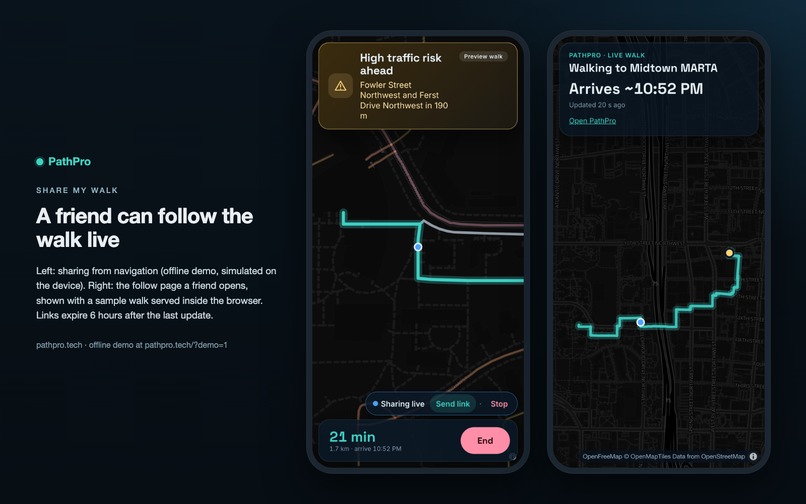
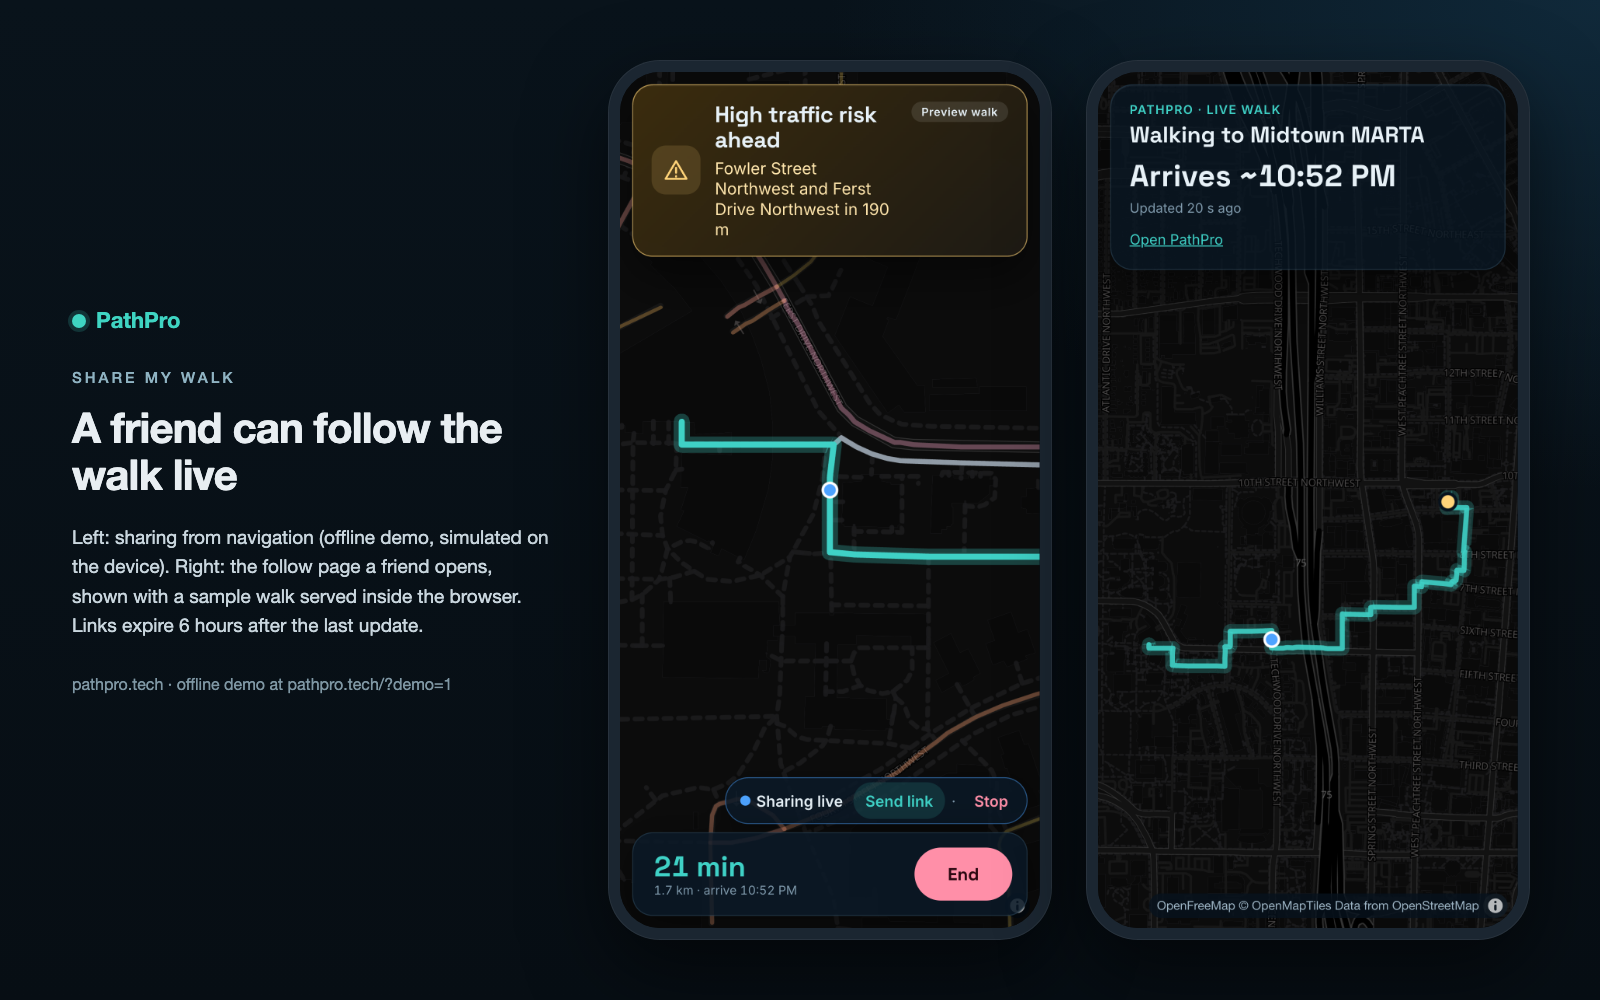
Share my walk: a friend follows along live from a link
-
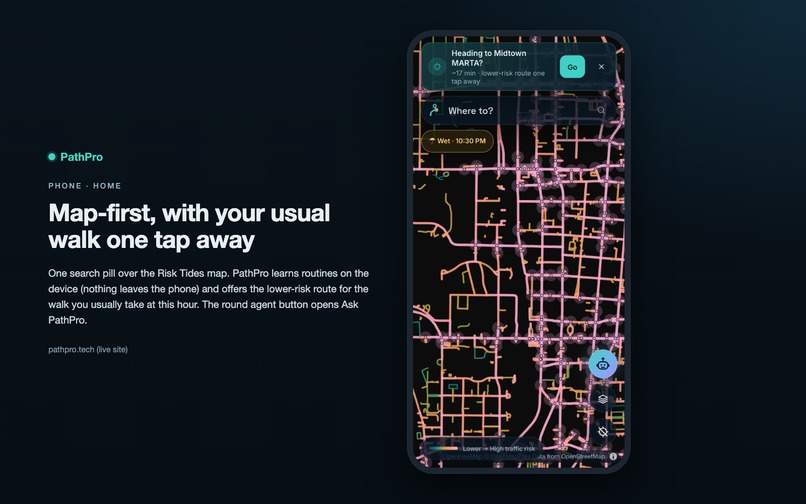
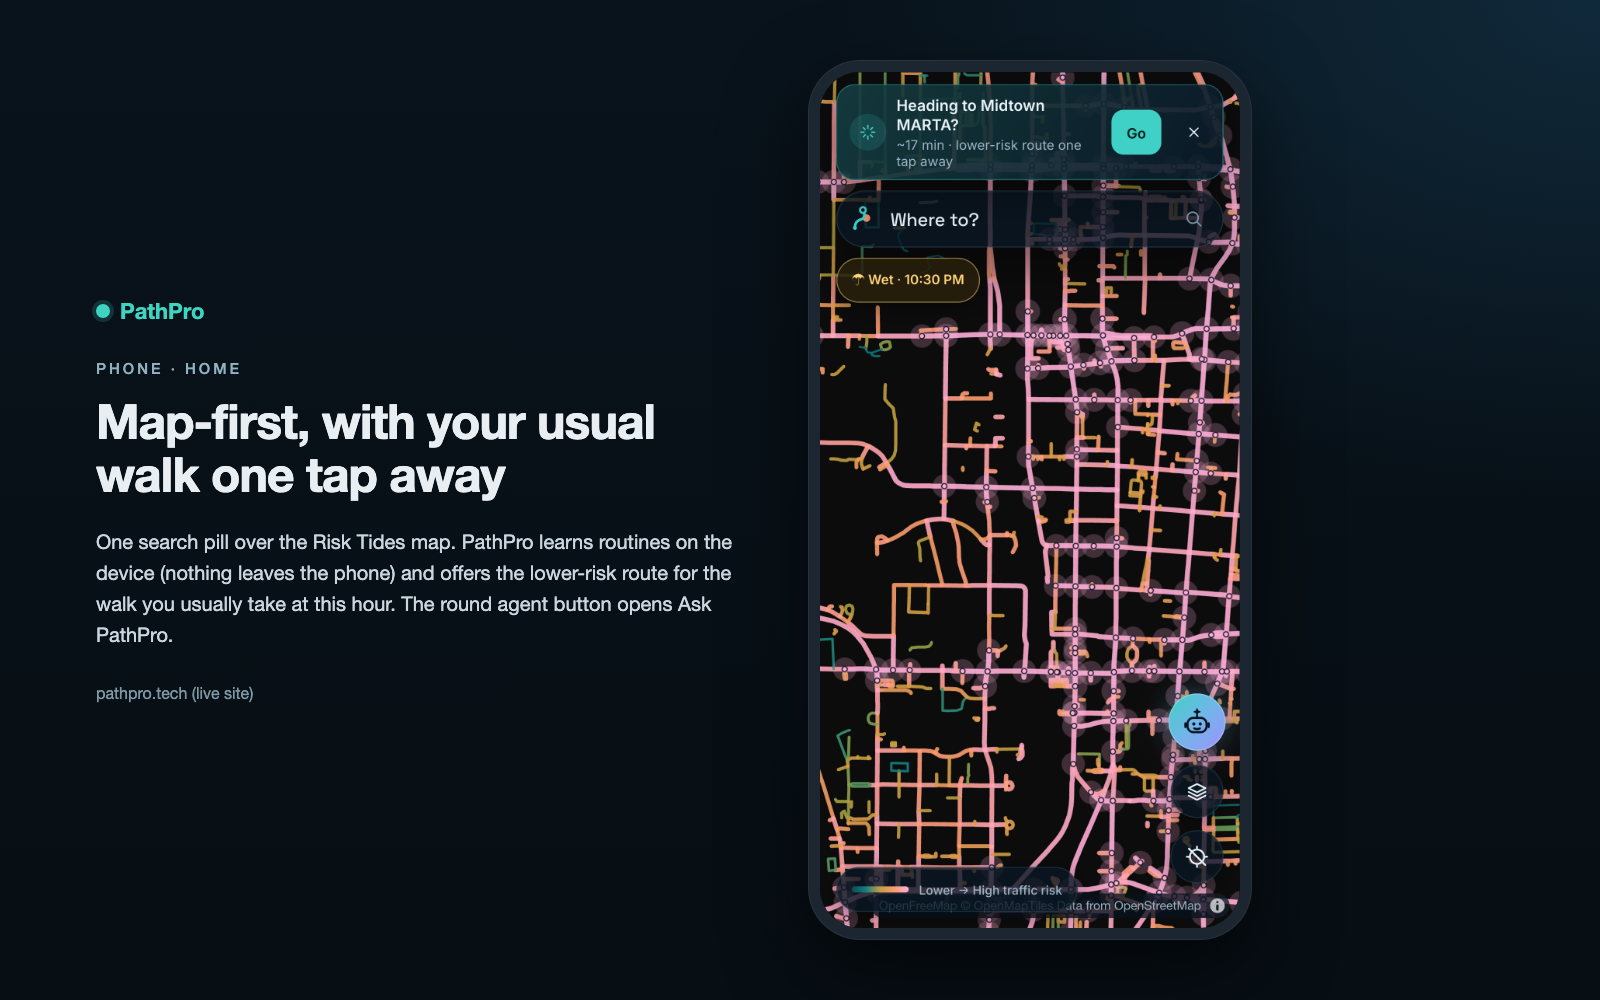
After a couple of walks, PathPro suggests your usual trip. Your history stays on your phone
-
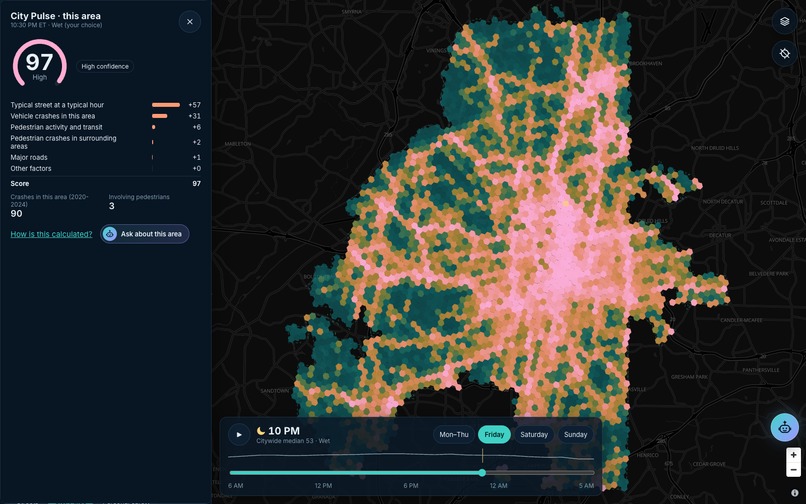
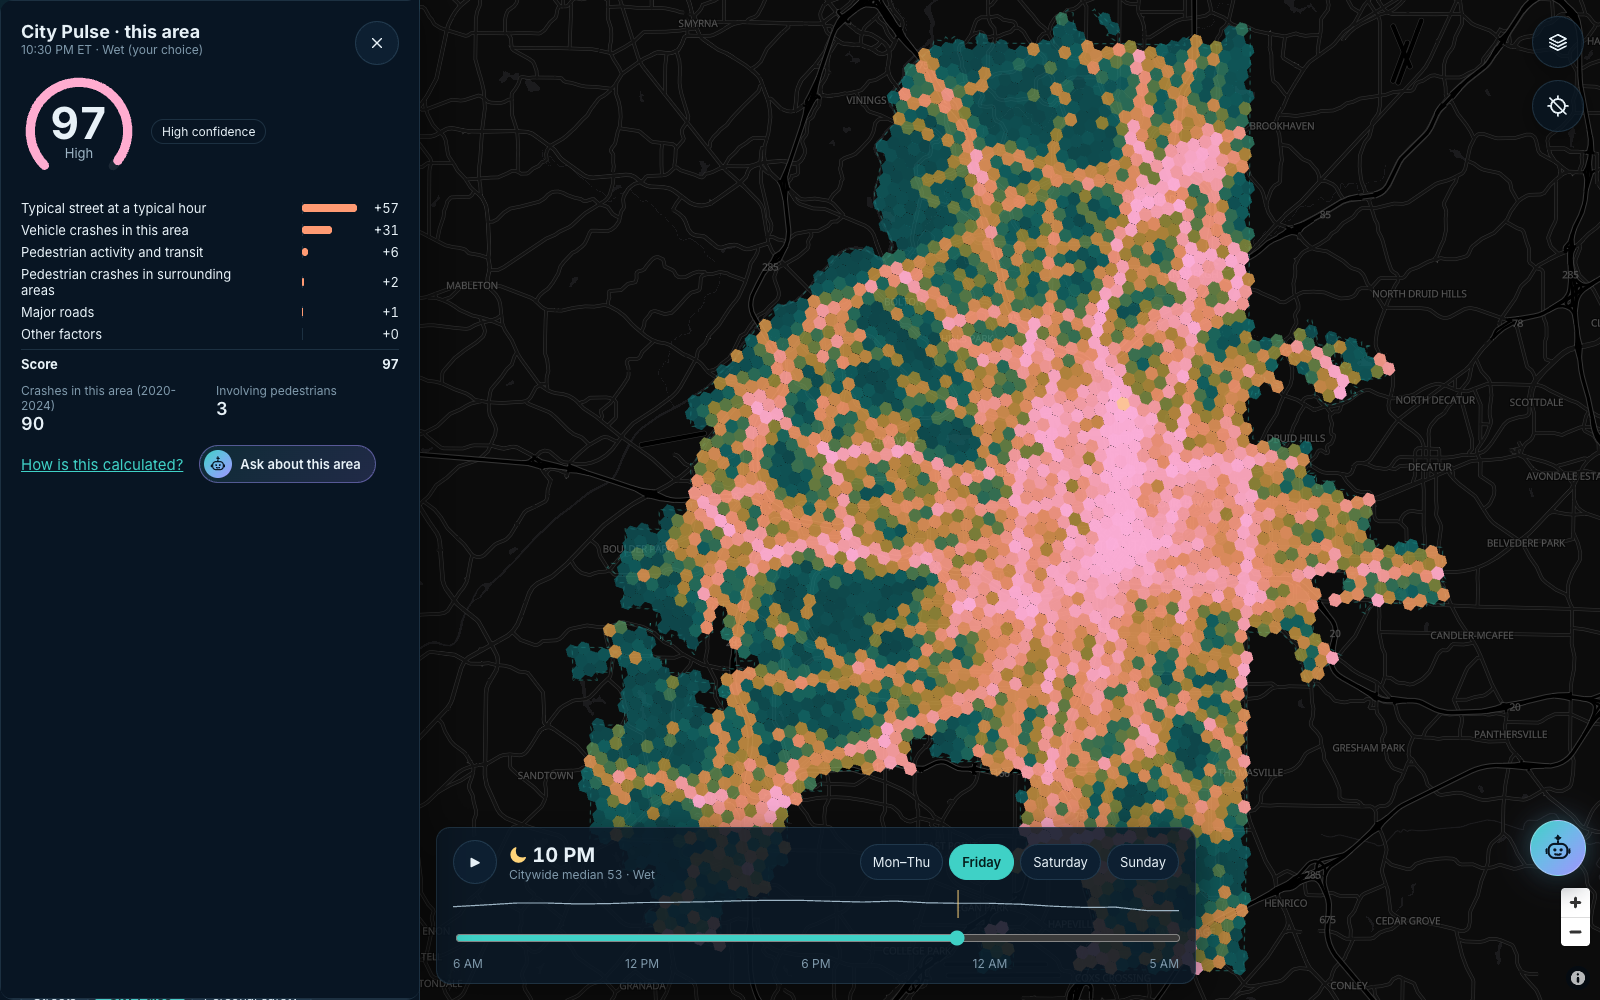
City Pulse: traffic-risk scores for all 3,537 areas, with Ask about this area
Try it: https://pathpro.tech (add ?demo=1 for the offline demo) · Code: https://github.com/ShaikNagurShareef/PathPro
Inspiration
I get around Atlanta on foot and on MARTA a lot, often late at night. My friends, especially women, already plan their walks around streets that are well lit and busy, and they text each other when they get home. Every map app I opened only cared about the fastest route.
Then I looked at the data. Pedestrian crashes in Atlanta aren't spread evenly. They pile up on a small share of streets, and the risk changes with the hour and the weather. So I set out to build what I wanted to use: a map that shows where and when traffic risk is highest, and a route that trades a few extra minutes for a lot less exposure.
What it does
You open pathpro.tech on your phone. There's no app to install and no account. Tap "Where to?", pick a place, and PathPro starts from your location. The route card says something like "23 min, 54% less traffic risk, 4 min longer than the fastest route." Tap Start and it walks with you, speaking up before high-risk crossings so you can keep your eyes on the street.
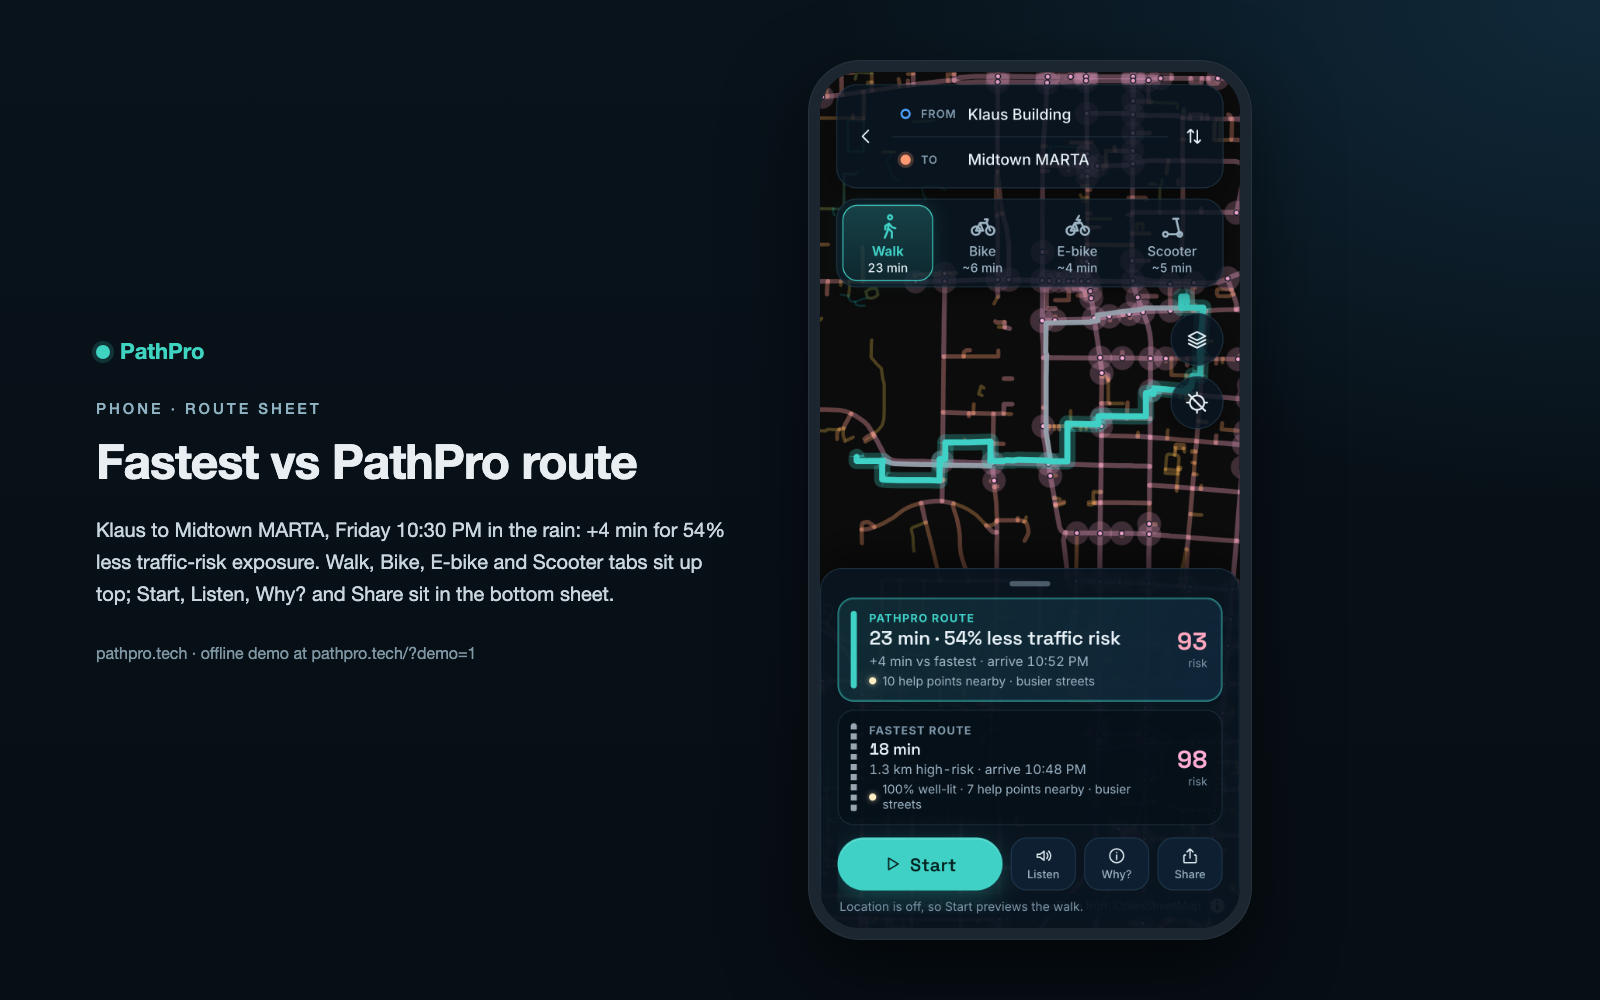 The PathPro route (teal) next to the fastest one: 4 more minutes, 54% less traffic risk.
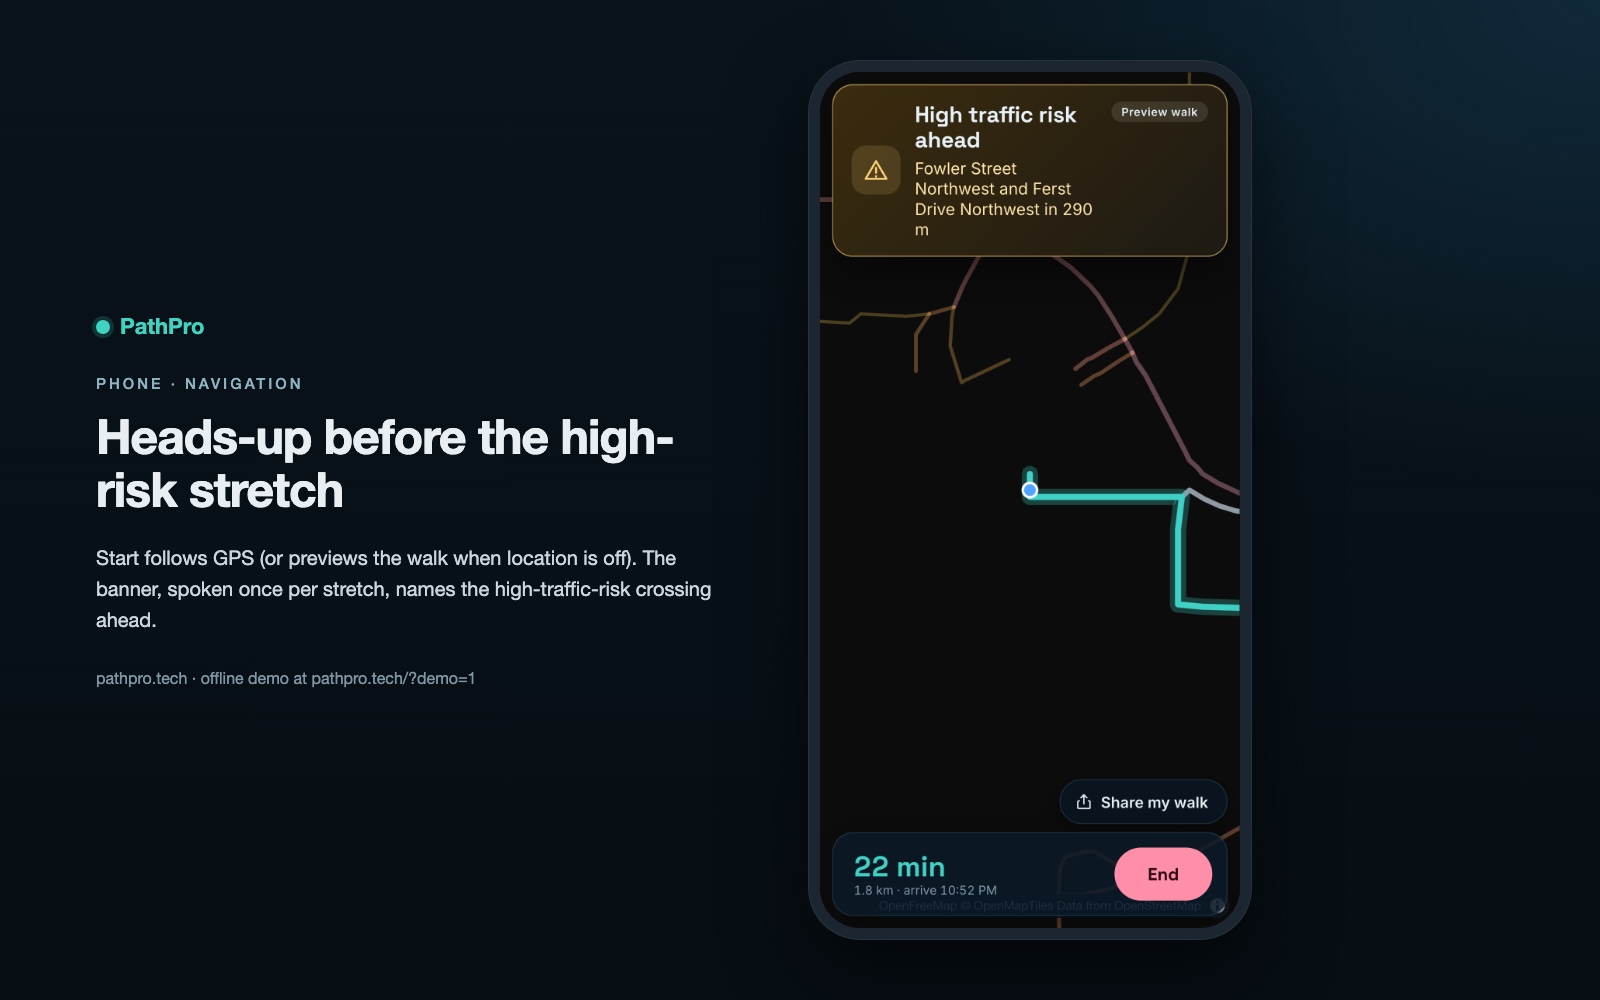 During the walk, PathPro calls out high-risk stretches before you reach them.
It also handles bikes, e-bikes, and scooters, because walking across Atlanta isn't realistic. Georgia Tech to Inman Park by bike at 9 PM comes out 72% lower-risk for about 4 extra minutes. On long walks it points you to the nearest MARTA station instead. I decided not to route cars: sending drivers down quieter streets just moves traffic onto the streets people walk on.
Tap any street to see why it scores the way it does. The factor bars add up exactly to the score, a chart shows when crashes happened there by hour, and there's a short explanation you can listen to.
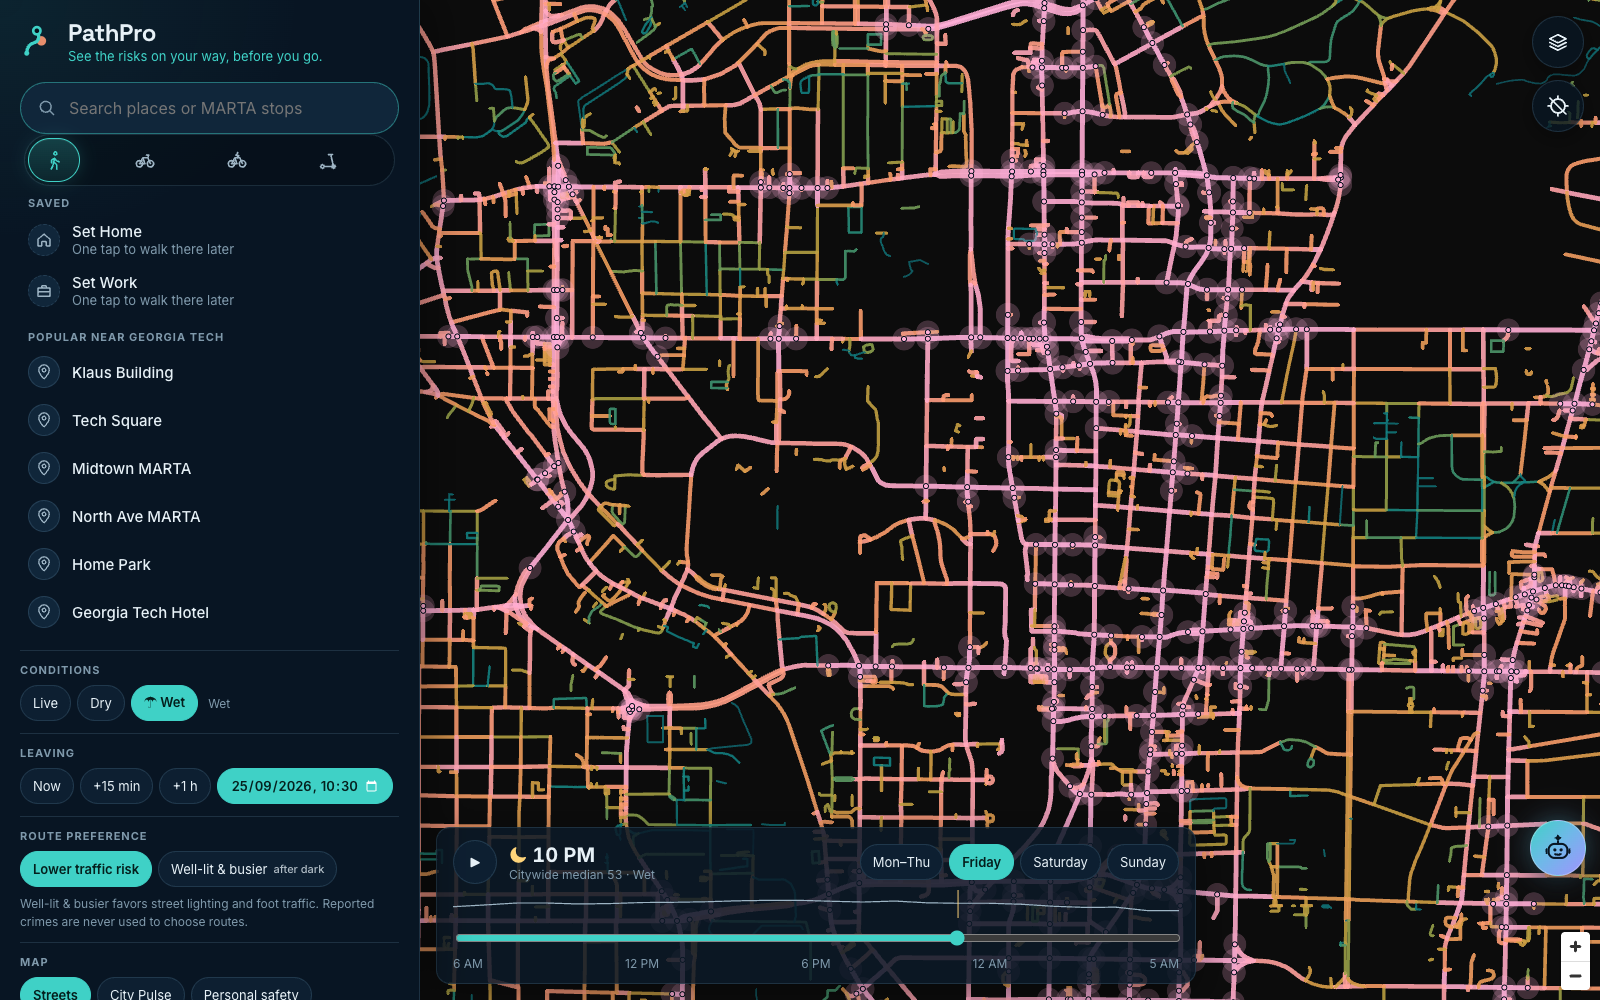 Risk Tides: traffic risk across Atlanta, hour by hour, dry or wet.
 The "Why?" view: factor bars that add up to the score, and a plain-language explanation.
A few more things I built because people asked for them:
- A "well-lit and busier" option for walking after dark, and help points on the map: Georgia Tech's 100 blue-light phones, police, fire, hospitals, and MARTA.
- Share my walk, so a friend can follow along, and a check-in if you're running late, with 911 one tap away.
- Routines that stay on your phone. After a couple of walks it will ask "Heading back to Klaus?"
- Street reports (blocked sidewalk, signal out, flooding) that stay up for 14 days.
Ask PathPro: an agent on the map
A round agent button sits on the map. Tap it and a chat opens: on a phone it slides up from the bottom, and on a desktop it docks beside the map. Ask anything, like "How was the model tested?" or "What does the risk score mean?". Or open a street, route or City Pulse area and tap "Ask about this street", and the agent answers about exactly that, using the same evidence behind the score.
It runs on Backboard. The answers come from my model's own documents (the model card, metrics, data sources and decision log) plus the street, route or area on screen, and every answer goes through the same checks as the explanations: no number that isn't in the evidence, no crime framing, no links, and it has to be about PathPro. If an answer fails, you get a plain pointer to the model card instead.
Memory is opt-in. Flip "Remember my preferences" and it keeps what you tell it about how you travel ("I usually walk home around 11 PM, I prefer well-lit streets"), and uses it next time, even in a new conversation. It never keeps places or routes: questions about a street or route can read memory but never write it. Tap Forget me and your private copy is deleted.
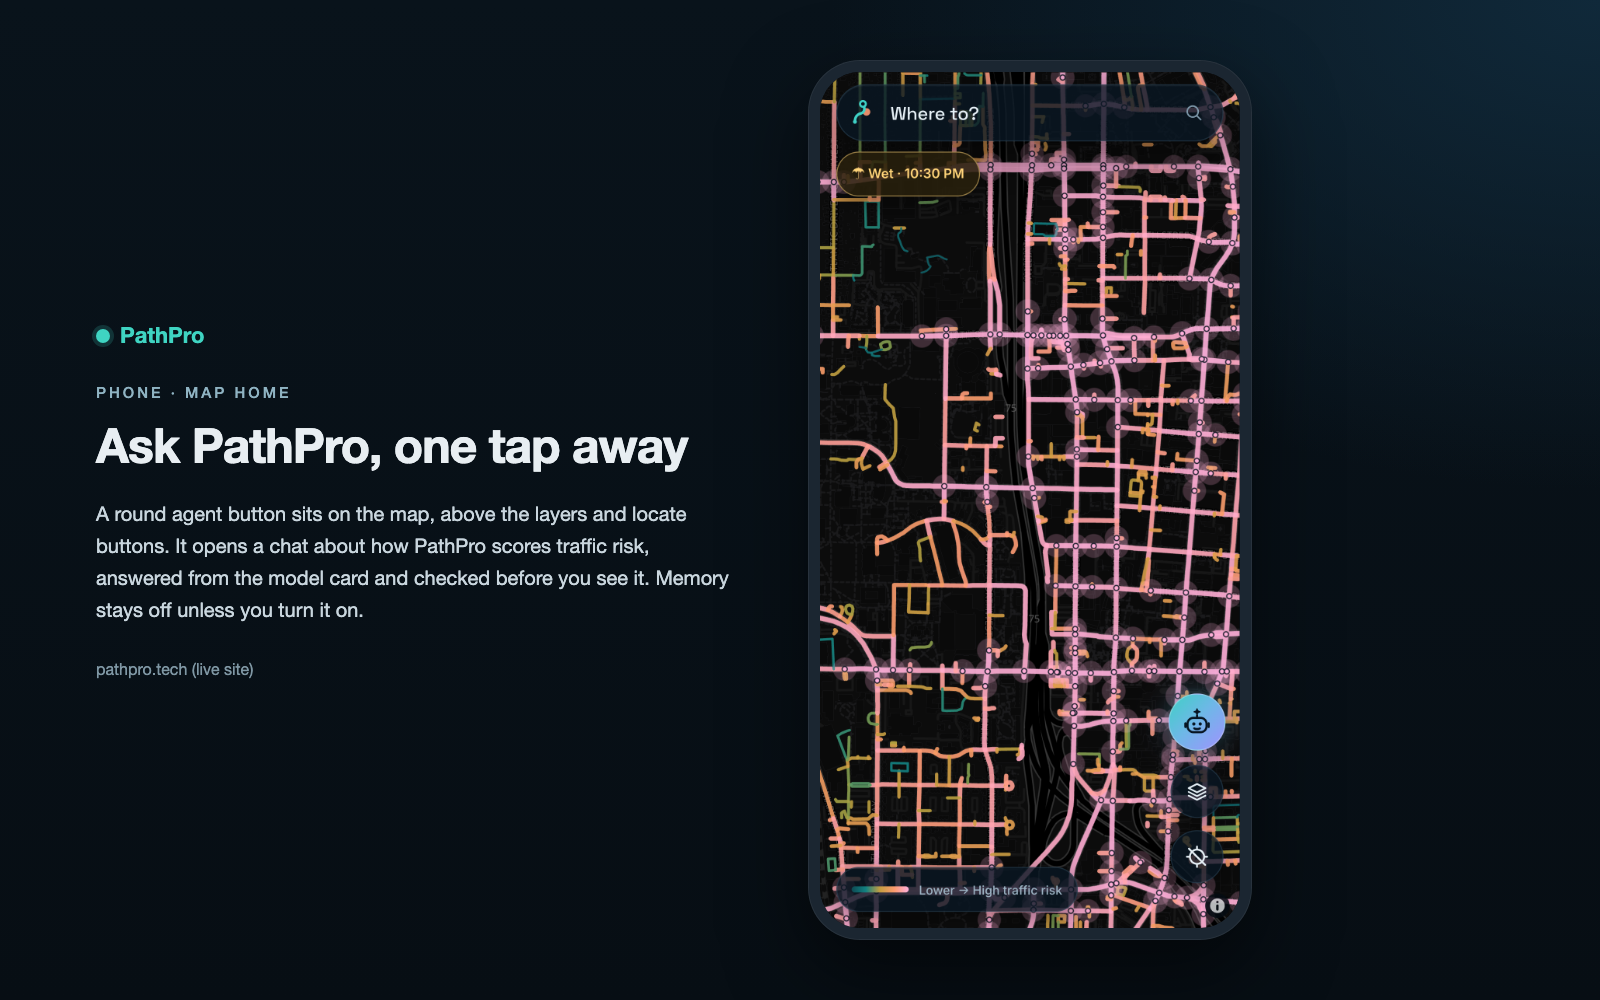 The agent button on the map.
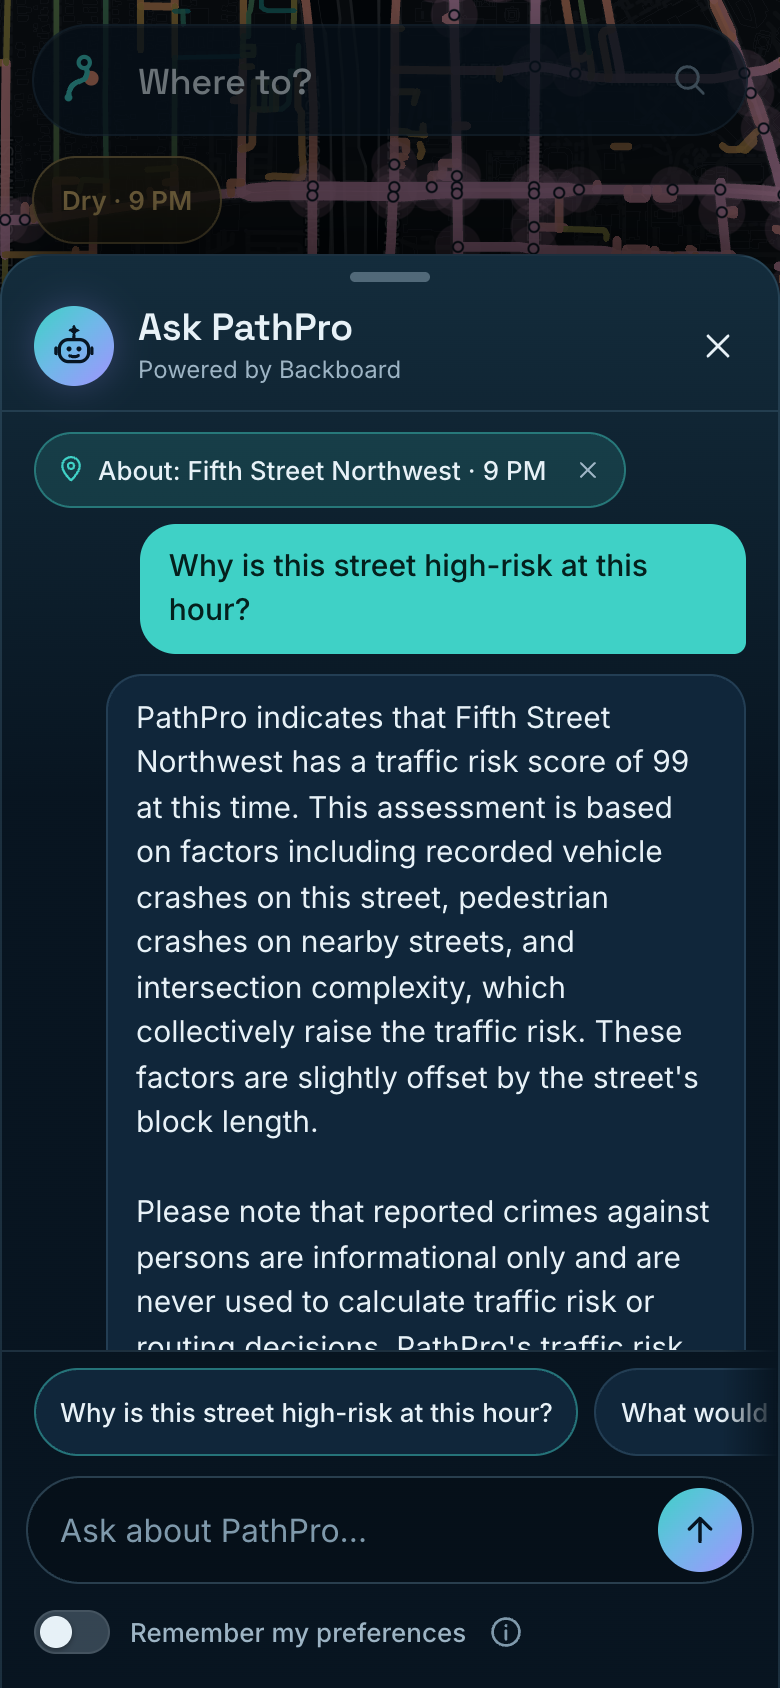 Ask about this street: the answer lists the same factors as the score bars.
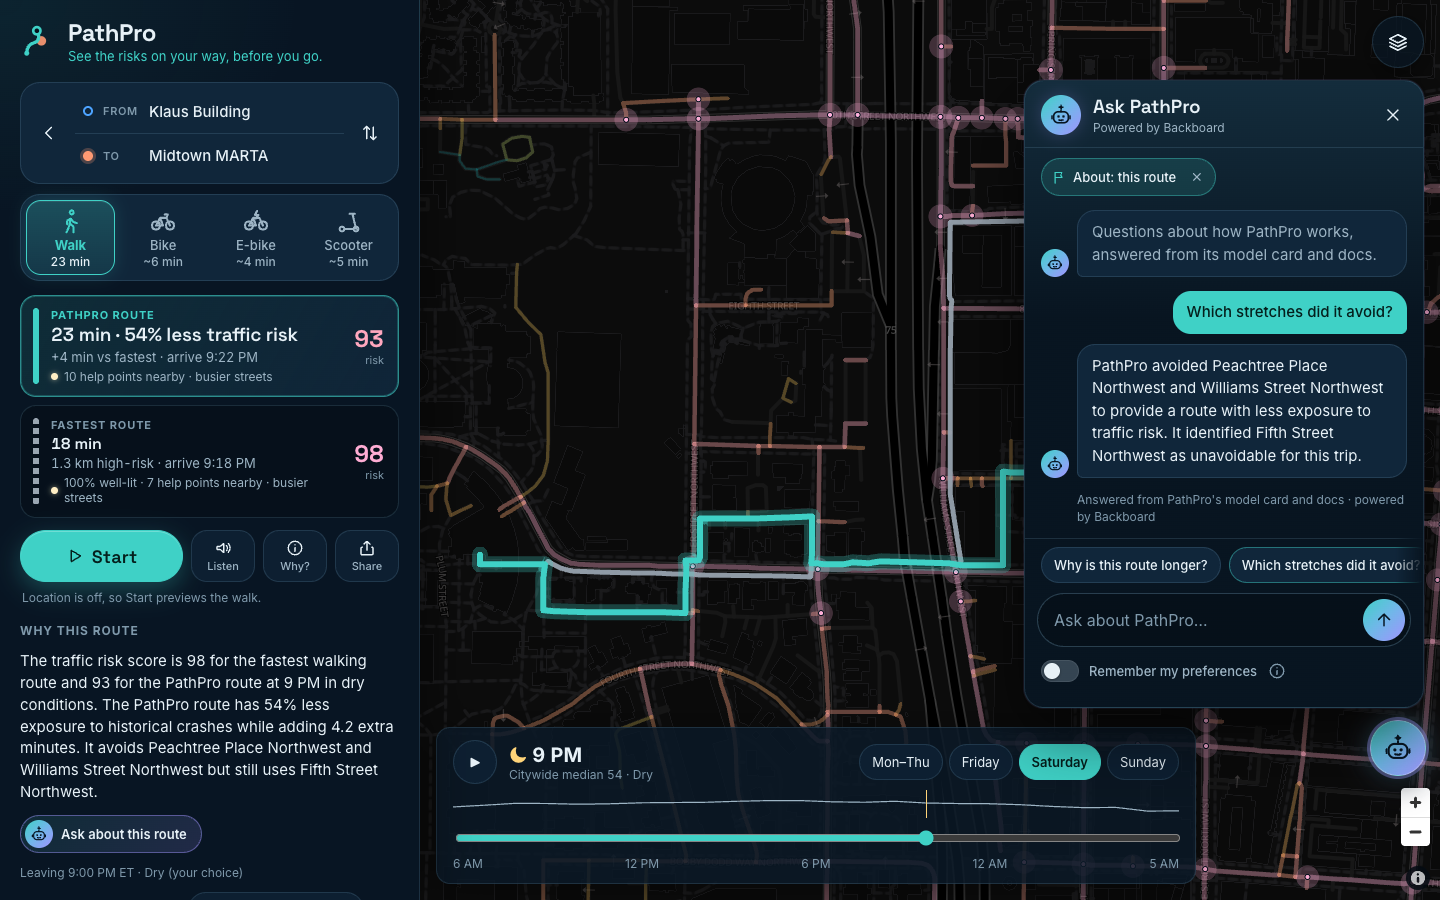 On desktop, the chat docks beside the map and explains which high-risk stretches the route avoided.
Imagine the fix
For city planners, every walking street has "Imagine this street redesigned". PathPro writes the prompt itself from that street's top risk factors, and Grok Imagine draws the evidence-based fixes: high-visibility crosswalks, curb extensions, a refuge island, a protected bike lane, better lighting. Then Gemini looks at the picture before anyone sees it: it confirms which planned fixes actually appear and rejects any image with readable text, logos or recognizable faces. Every picture is labeled "not a real photo". It's a way to see the change before a dollar is spent on concrete.
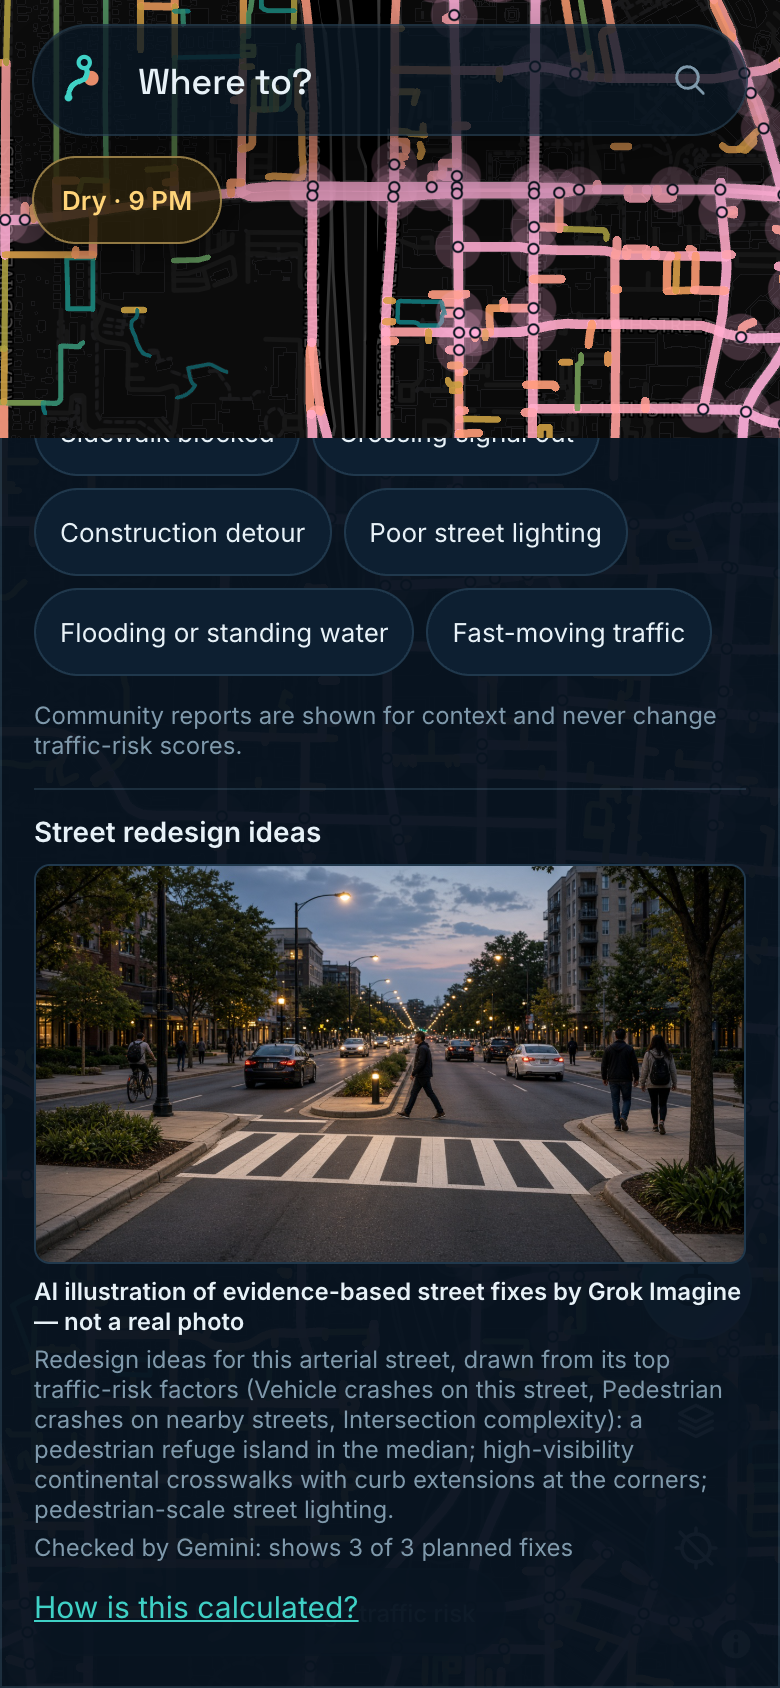 10th Street NW, redesigned by Grok Imagine and checked by Gemini ("shows 3 of 3 planned fixes").
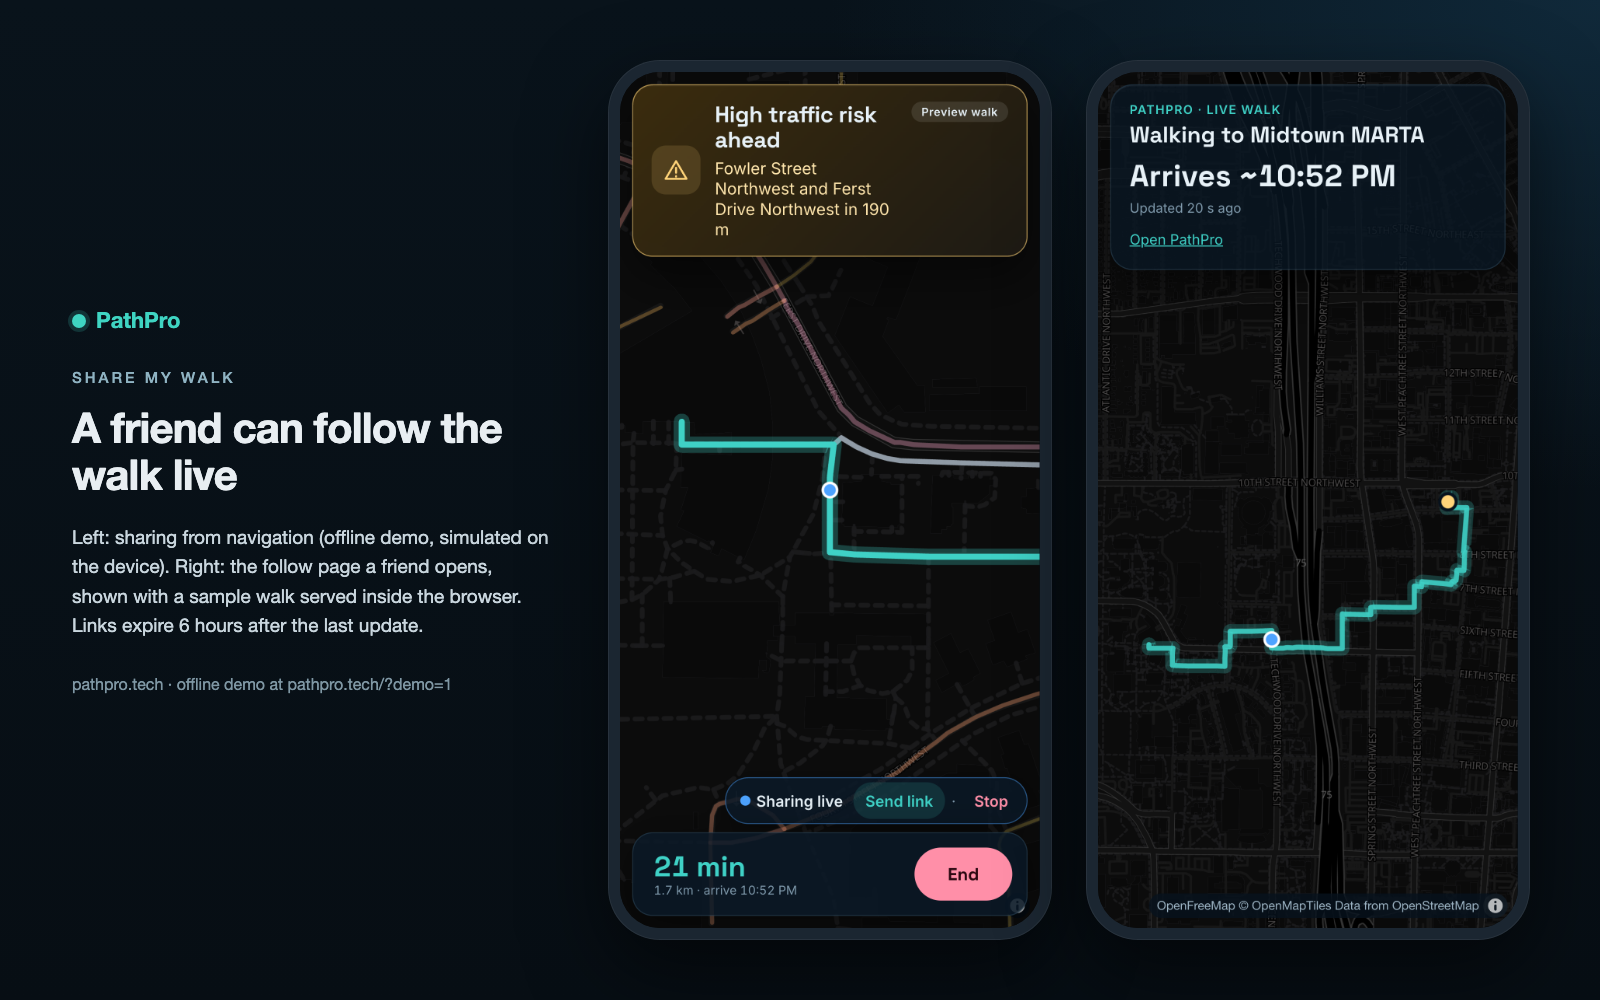 Share my walk: a friend follows your walk live from a link.
Does it actually work?
I trained on 2020–2023 and tested on 2024, a year the model never saw. The 10% of street length PathPro ranks highest had 74.3% of the 2024 pedestrian crashes (95% CI 70.5–78.3%). The City's High Injury Network, the list Atlanta uses to prioritize street fixes, caught 53.8%. Past crash counts alone caught 49.8%, and a random pick caught 11.9%. For cyclists it got 69.9%, against 43.6% for the High Injury Network.
Put another way: if a city spends the same budget fixing 10% of its street length, PathPro's ranking reaches about 38% more of next year's pedestrian crashes. For someone walking home, 4 extra minutes cuts their traffic-risk exposure by more than half.
How I built it
I pulled about 250,000 public crash records from eight sources (ARC, the City of Atlanta, Central Atlanta Progress, and Georgia Tech), merged the duplicates, removed personal fields, and matched each crash to an OpenStreetMap street. One source turned out to store local time as UTC. I only caught it because its daylight/dark field didn't line up with the hour; fixing it took agreement from 60% to 94%.
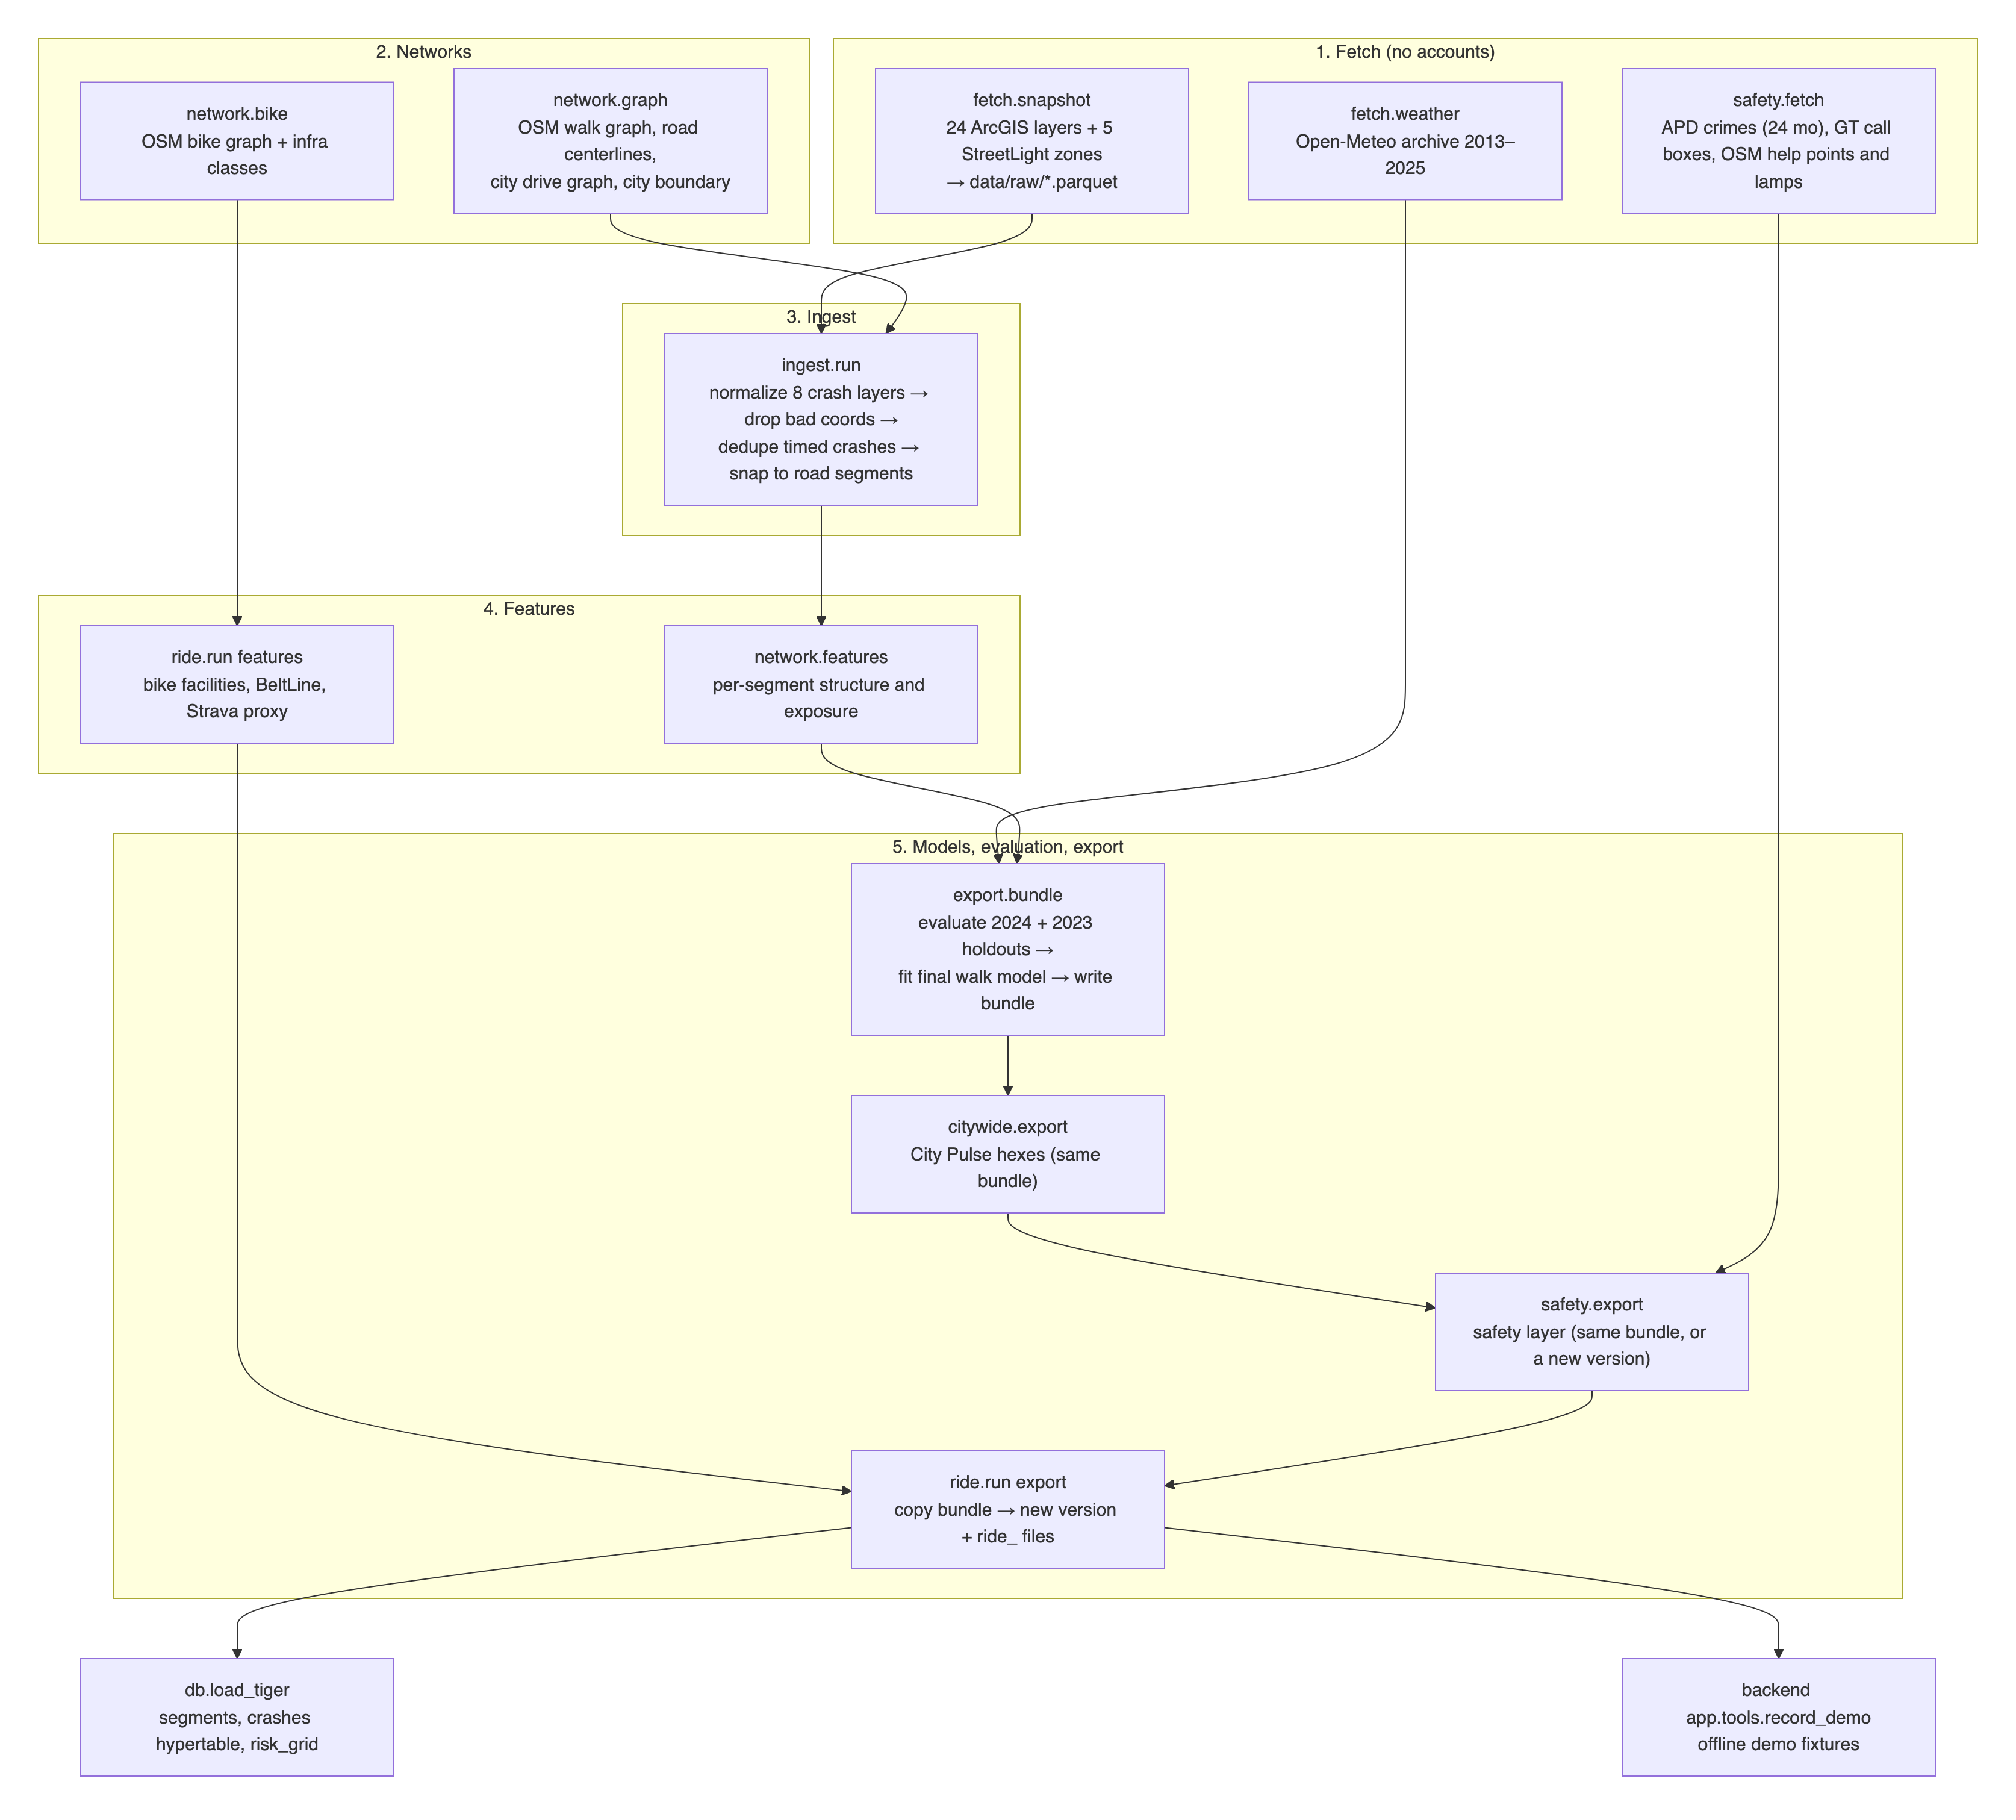 From public crash records to the model bundle the app serves.
The model predicts crashes per street while accounting for how many people actually walk there. It's a Poisson GLM plus a monotone LightGBM, validated with spatial blocks, then blended with each street's own history using Empirical Bayes. A second model handles hour, day, darkness, and rain. I used no demographic or income data anywhere.
The AI features sit on top of the model; they don't replace it. Grok writes the "Why?" text from the street's own evidence, and a validator throws out any sentence containing a number that isn't in that evidence, so the score always comes from the model. Grok Voice reads the navigation alerts (the clips are fetched when you start walking, so they play instantly), and Grok Imagine draws the redesigns. If a provider is down, explanations fall back to Groq, then Gemini, then a plain template, and the voice falls back to ElevenLabs and then the phone's built-in voice.
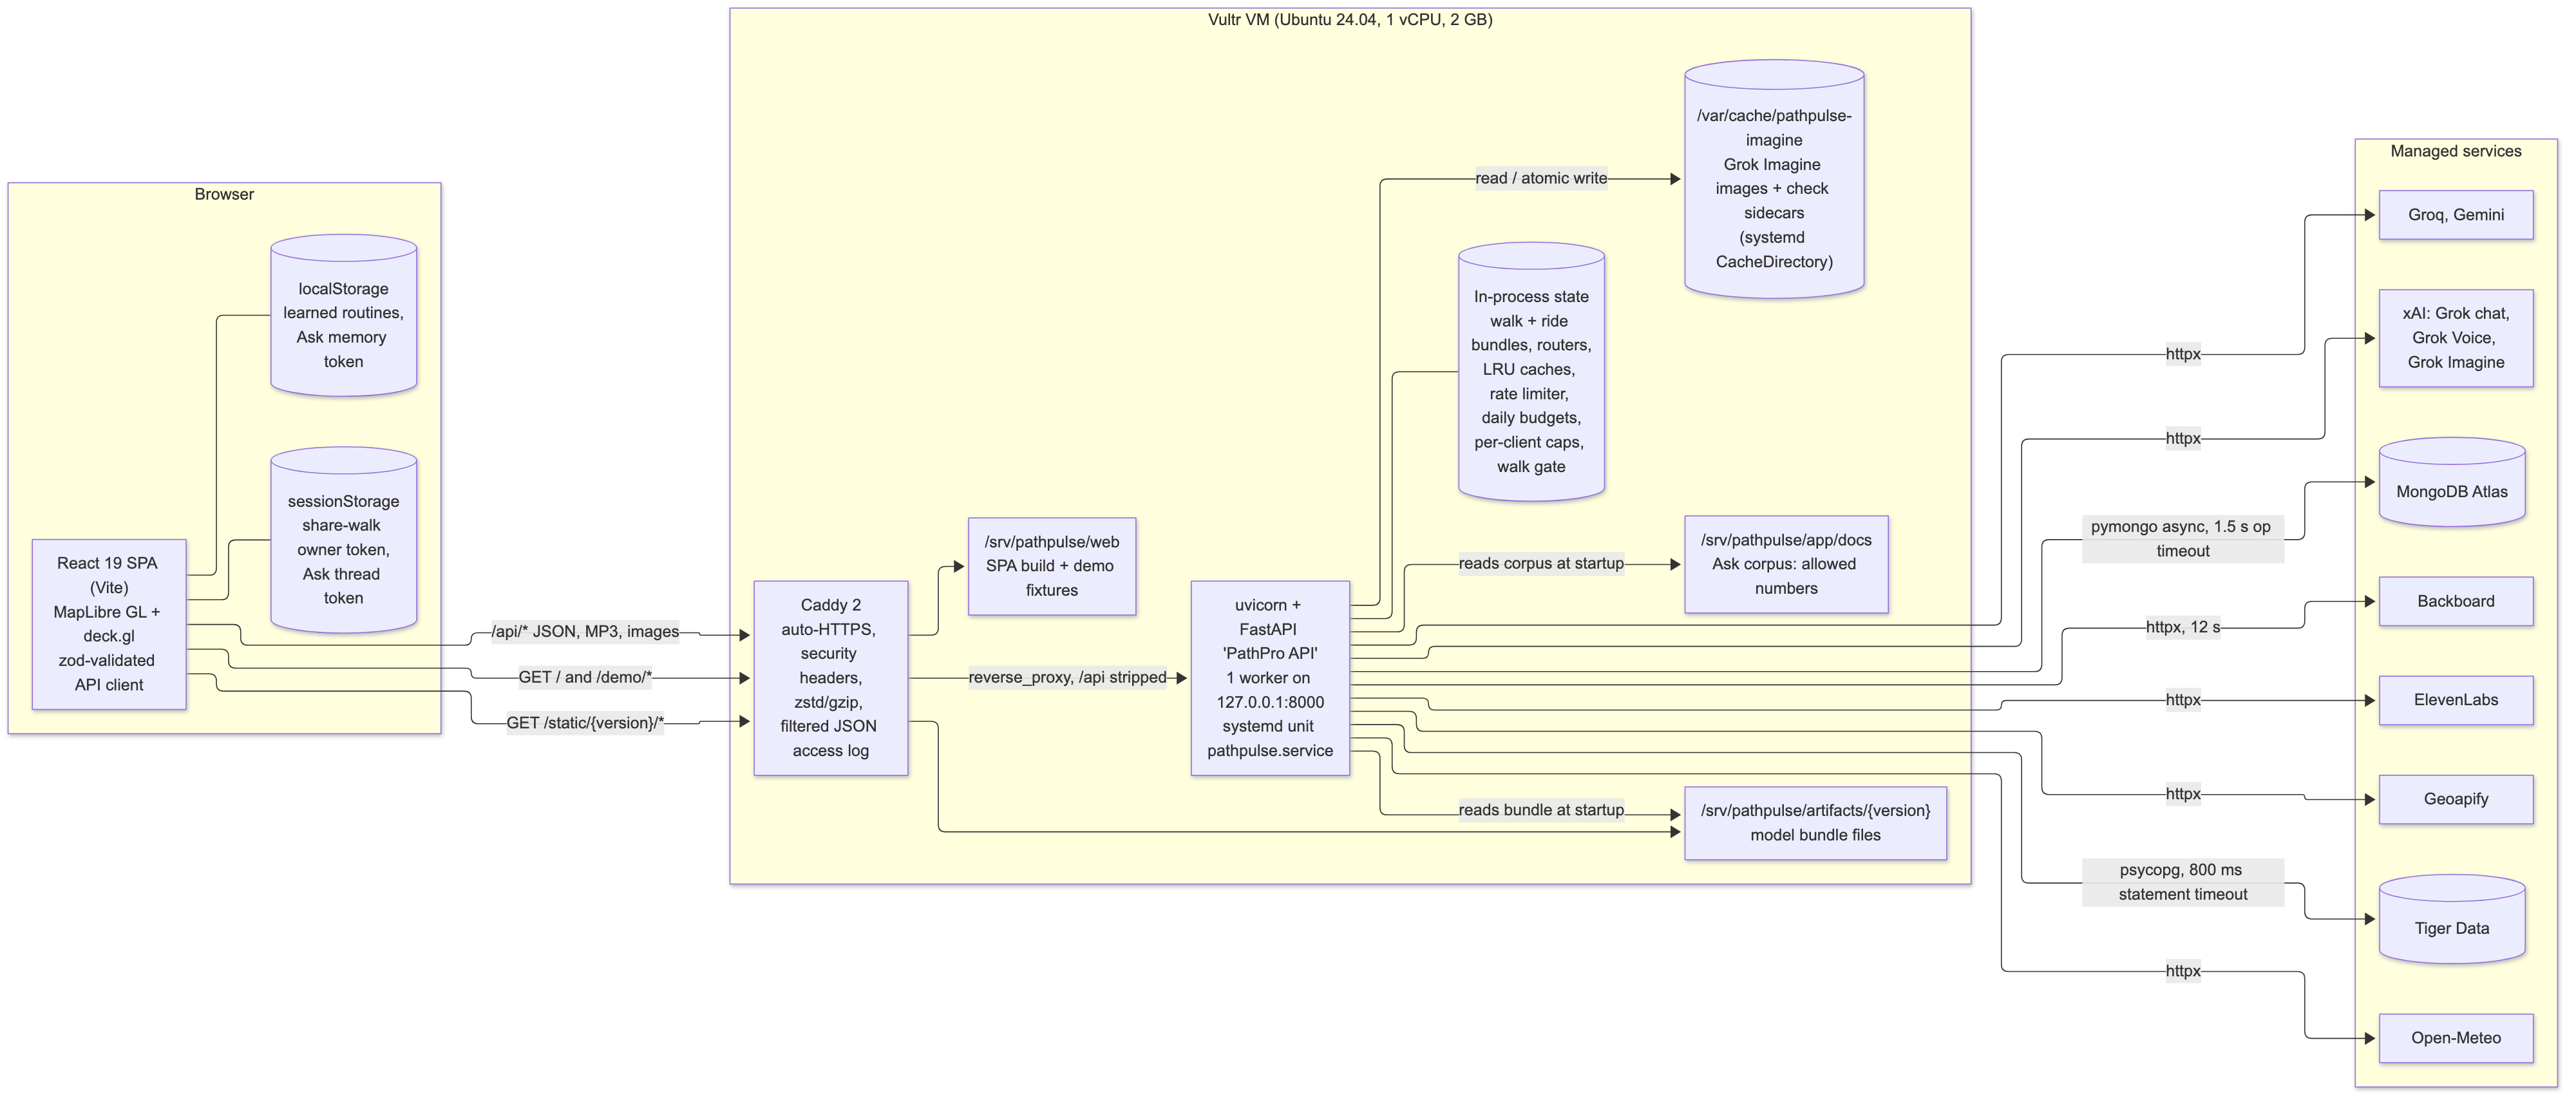 How the pieces fit: the app on one Vultr VM, with Grok, Gemini, Backboard, Tiger Data and MongoDB Atlas around it.
The rest of the stack:
- Vultr runs the whole app on one VM in Atlanta, behind Caddy for HTTPS. One script deploys it.
- Backboard runs Ask PathPro: retrieval over the model card and docs, the on-screen context, and opt-in memory, with one private assistant per browser that Forget me deletes.
- The domain is pathpro.tech. Say it out loud: "path protect."
- Tiger Data (TimescaleDB + PostGIS) holds 220,594 crash rows and powers each street's crashes-by-hour chart through a continuous aggregate.
- MongoDB Atlas stores street reports and shared walks, with TTL indexes so old ones clean themselves up.
- The frontend is React, TypeScript, MapLibre, and deck.gl. Routing is Dijkstra on a SciPy sparse graph, about 150 ms at the median for both routes.
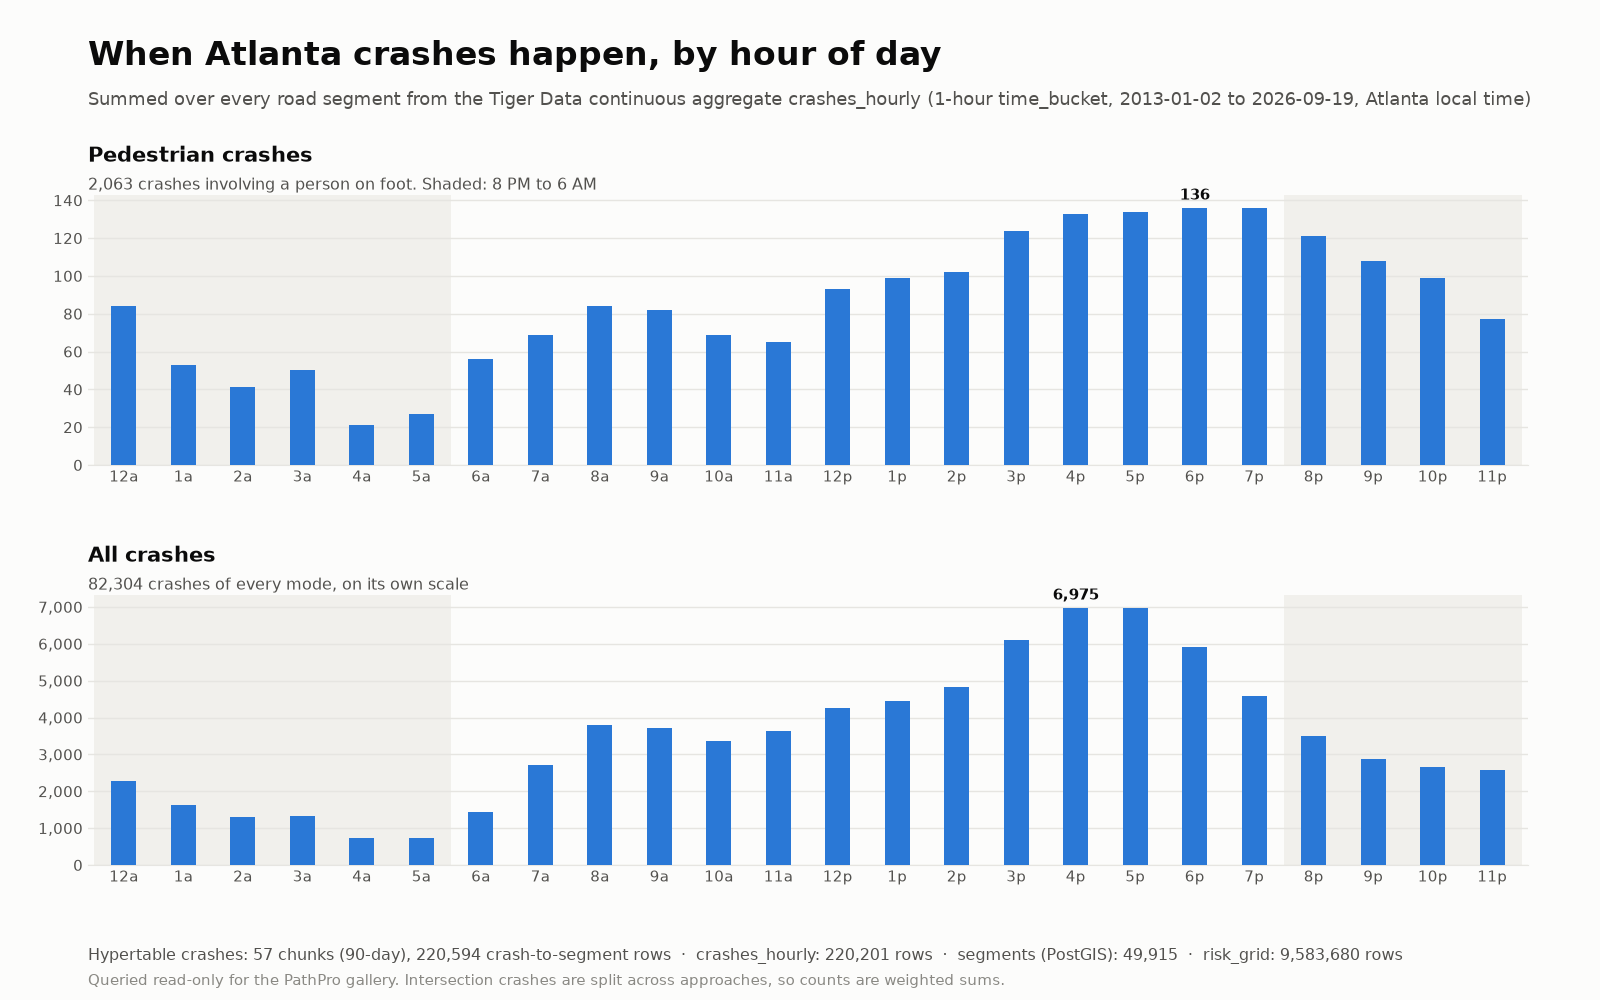 When crashes happened on a street, served from a Tiger Data continuous aggregate.
I wrote tests before code the whole way through (about 1,145 of them) and ran separate review passes for the code, the ML, and security.
Safety data, handled carefully
Adding crime data was the hardest call I made. Crime maps have a history of branding whole neighborhoods, and I didn't want to build another one. So PathPro only shows Atlanta Police reports of crimes against persons, grouped into hexagons by time of day, with no addresses or victim details, and always next to a note about what the data can and can't tell you. The bands adjust for how many people walk there, so an area with no reports never shows up as "higher." Crime never affects routing: a test multiplies every crime count by 1,000 and checks that the routes don't change.
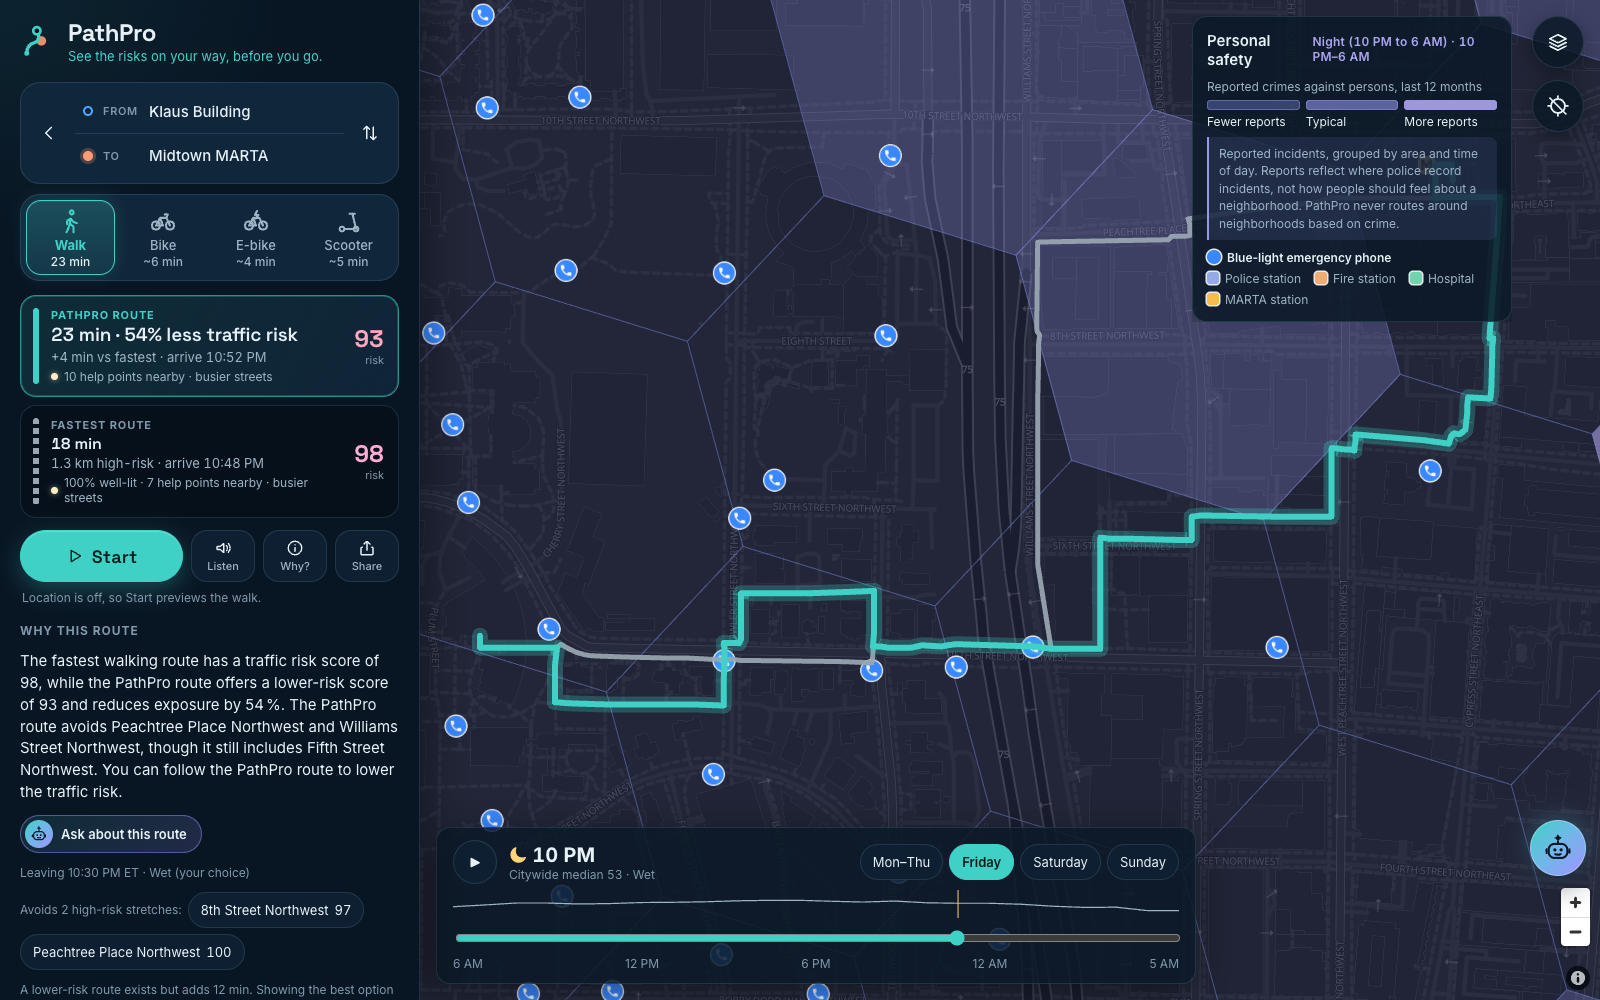 Reported crimes against persons by area and time of day, help points, and the fairness note that always sits beside them.
Lighting data covers only about 4% of streets. Where the data doesn't know, PathPro says so.
Challenges I ran into
- A third of the crashes wouldn't match any street. Midtown's sidewalks are mapped as separate lines from the roads, so I moved the model onto road centerlines and let the sidewalks inherit the risk. Matches went from 66% to 96%.
- A mentor tried my first version on their phone and told me it wasn't intuitive. They were right. I rebuilt the interface that afternoon around GPS, a simple route card, and turn-by-turn walking.
- My routes looked like zigzags. OSMnx stores many street geometries backwards, so I was drawing every other segment in reverse and overstating distance by 1.6×. It's fixed, and a test guards it now.
- My first confidence intervals were too narrow. Resampling by spatial block fixed that. I also found that rain matters less than I expected, and I report it.
What I'm proud of
The model beats the City's own High Injury Network on a year it never saw. Every number on the screen traces back to the model, and the AI can't make one up. The safety features help without steering anyone away from a neighborhood. And the app keeps working when the weather API, an AI provider, a database, GPS, or the Wi-Fi goes down.
What I learned
Most of the work was cleaning data and checking my own numbers, not picking a model. Crash data and crime data are both skewed by how many people are around to be counted, and saying that out loud made my claims stronger. Watching one person use the app on a real phone taught me more than any test did.
What's next for PathPro
Wheelchair and stroller routing, better lighting data through the City or Georgia Power, a planning dashboard that pairs the top-ranked streets with Grok Imagine redesigns, and other cities, which mostly means swapping one boundary file.
Built With
- backboard
- cursor
- deck.gl
- elevenlabs
- fastapi
- gemini
- geopandas
- grok
- grok-imagine
- grok-voice
- groq
- lightgbm
- maplibre
- mongodb-atlas
- osmnx
- playwright
- postgis
- python
- react
- scikit-learn
- tiger-data
- timescaledb
- typescript
- vultr
- xai

Log in or sign up for Devpost to join the conversation.