Inspiration
When researching about different medical topics and diseases, the information is almost always locked behind dense text, confusing jargon, and endless Wikipedia articles. Medical terms are difficult for many learners to understand so we wanted to build a tool that can provide a dynamic visual experience so anyone can intuitively understand how a disease travels through and affects different parts of the human body.
What it does
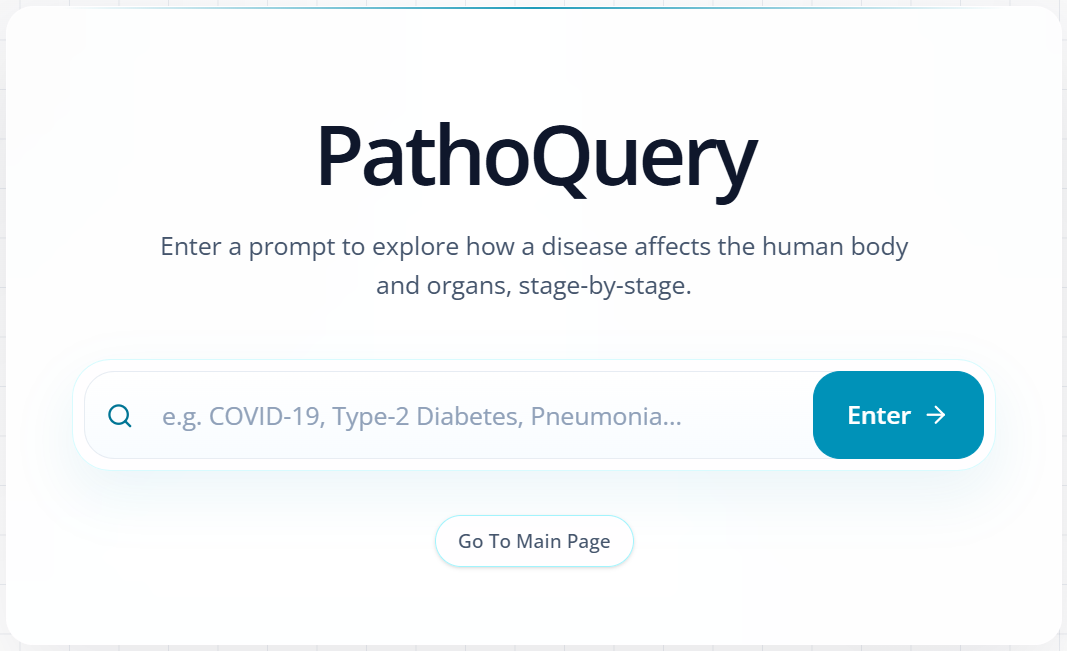
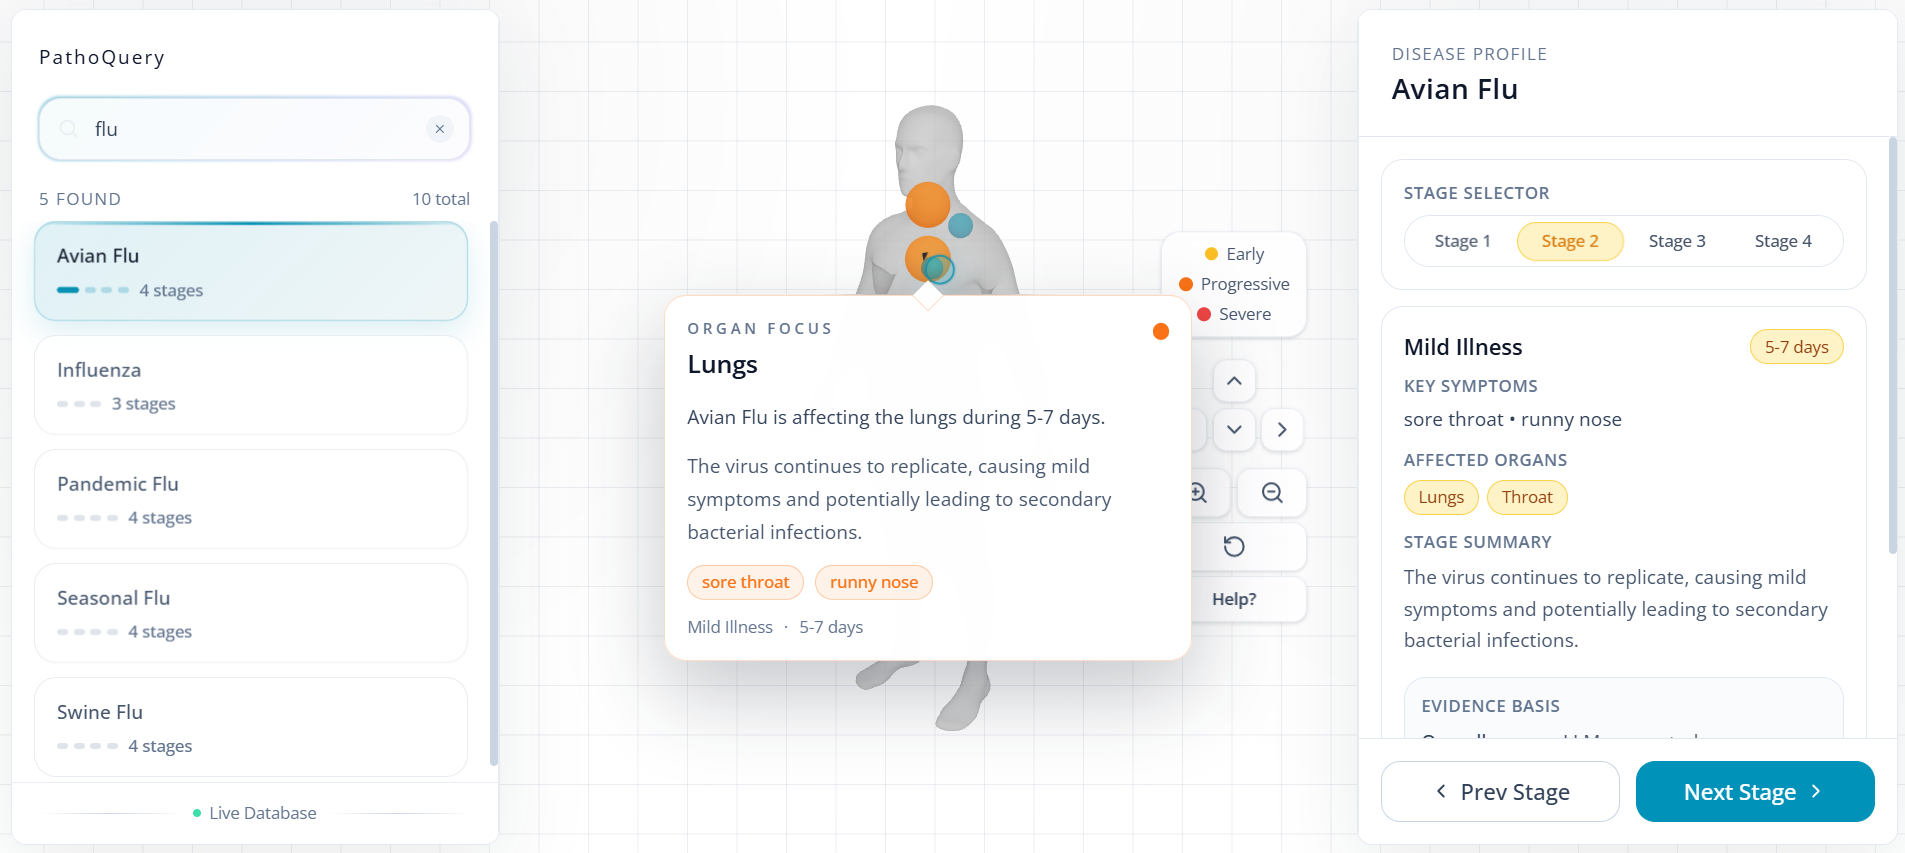
PathoQuery is an AI-powered platform that visualizes the progression of diseases through the human body. Users simply prompt the system with a known disease (e.g. COVID-19 or Influenza) or symptoms and circumstances in natural language, and the app generates an interactive map on the human body, locating where the diseases are most prevalent, and provides a stage-by-stage visualization for how a disease progresses. The RAG system built with watsonx.ai is trained on journal articles published on PubMed to provide reliable and scientifically-evident information for viral infections. For diseases out of the scope of trained data, the model returns LLM-generated information while citing and justifying the quality of the generated text.
How we built it
We structured the project as a full-stack application.
- Backend: We used IBM's watsonx.ai and Entrez API to make a vector database from PubMed journal papers and train our RAG model.
- Data Integration: We then used Python Flask to pass the data generated from the RAG model to the front-end using RESTful API to display the categorized information in our frontend.
- Frontend: We used a React + Vite framework with Typescript and Tailwind CSS for fast production to create organized layouts develop the frontend and interactive UI. We also used three.js to integrate the 3D visualization and motion (3D rotation + zoom).
Challenges we ran into
We struggled with finding datasets that provide information on the progression of diseases spreading in the human body, and which body parts/organs get most affected by the diseases. Since it was difficult to find a dataset, we decided to design a context-based RAG system which could achieve a similar purpose.
We also struggled with developing a 3D animation to visualize the spread of viruses throughout the human body. Finding relevant assets and integrating 3D coordinates for highlighting relevant organs of the body was time-consuming and required a lot of debugging and trial and error, but ultimately we learned how to make use of three.js to simplify and accomplish it!
Our accomplishments
We successfully integrated IBM watsonx.ai to process user prompts and provide structured disease information. We learned how to integrate three.js to create a 3D visualization and control it on a web application. We created an intuitive, interactive frontend visualization that simplifies complex medical data to educate the general public.
Lessons learned
We gained significant experience in integrating RAG systems, specifically using IBM watsonx.ai, into a full-stack web application. We learned about the complexities of finding and structuring medical data for visualization. We improved our skills in frontend data visualization using React and three.js, and managing state for dynamic UI updates.
Next steps
- Implement 3D Visualizations: Overcome our initial challenges by creating 3D animations of pathogen transmission and impact on a cellular/tissue level.
- Expand Disease Vector Database: Include a much wider range of diseases, moving beyond viral infections.
- Enhance User Interaction: Add features that allow users to dive deeper into specific symptoms or body parts affected, helping deepen the user's understanding and intuition of the disease.

Log in or sign up for Devpost to join the conversation.