-
-

Overall Web Dashboard
Inspiration
Disease outbreaks don't happen in a vacuum, they spread through highways, airports, and human behavior. We wanted to build something that helps policymakers actually "see" those dynamics in real time, so that decisions around quarantines, travel restrictions, and resource allocation aren't made blindly. If a governor closes a border or a city shuts down transit, what actually happens next? We wanted Patho to answer that question visually and instantly.
What it does
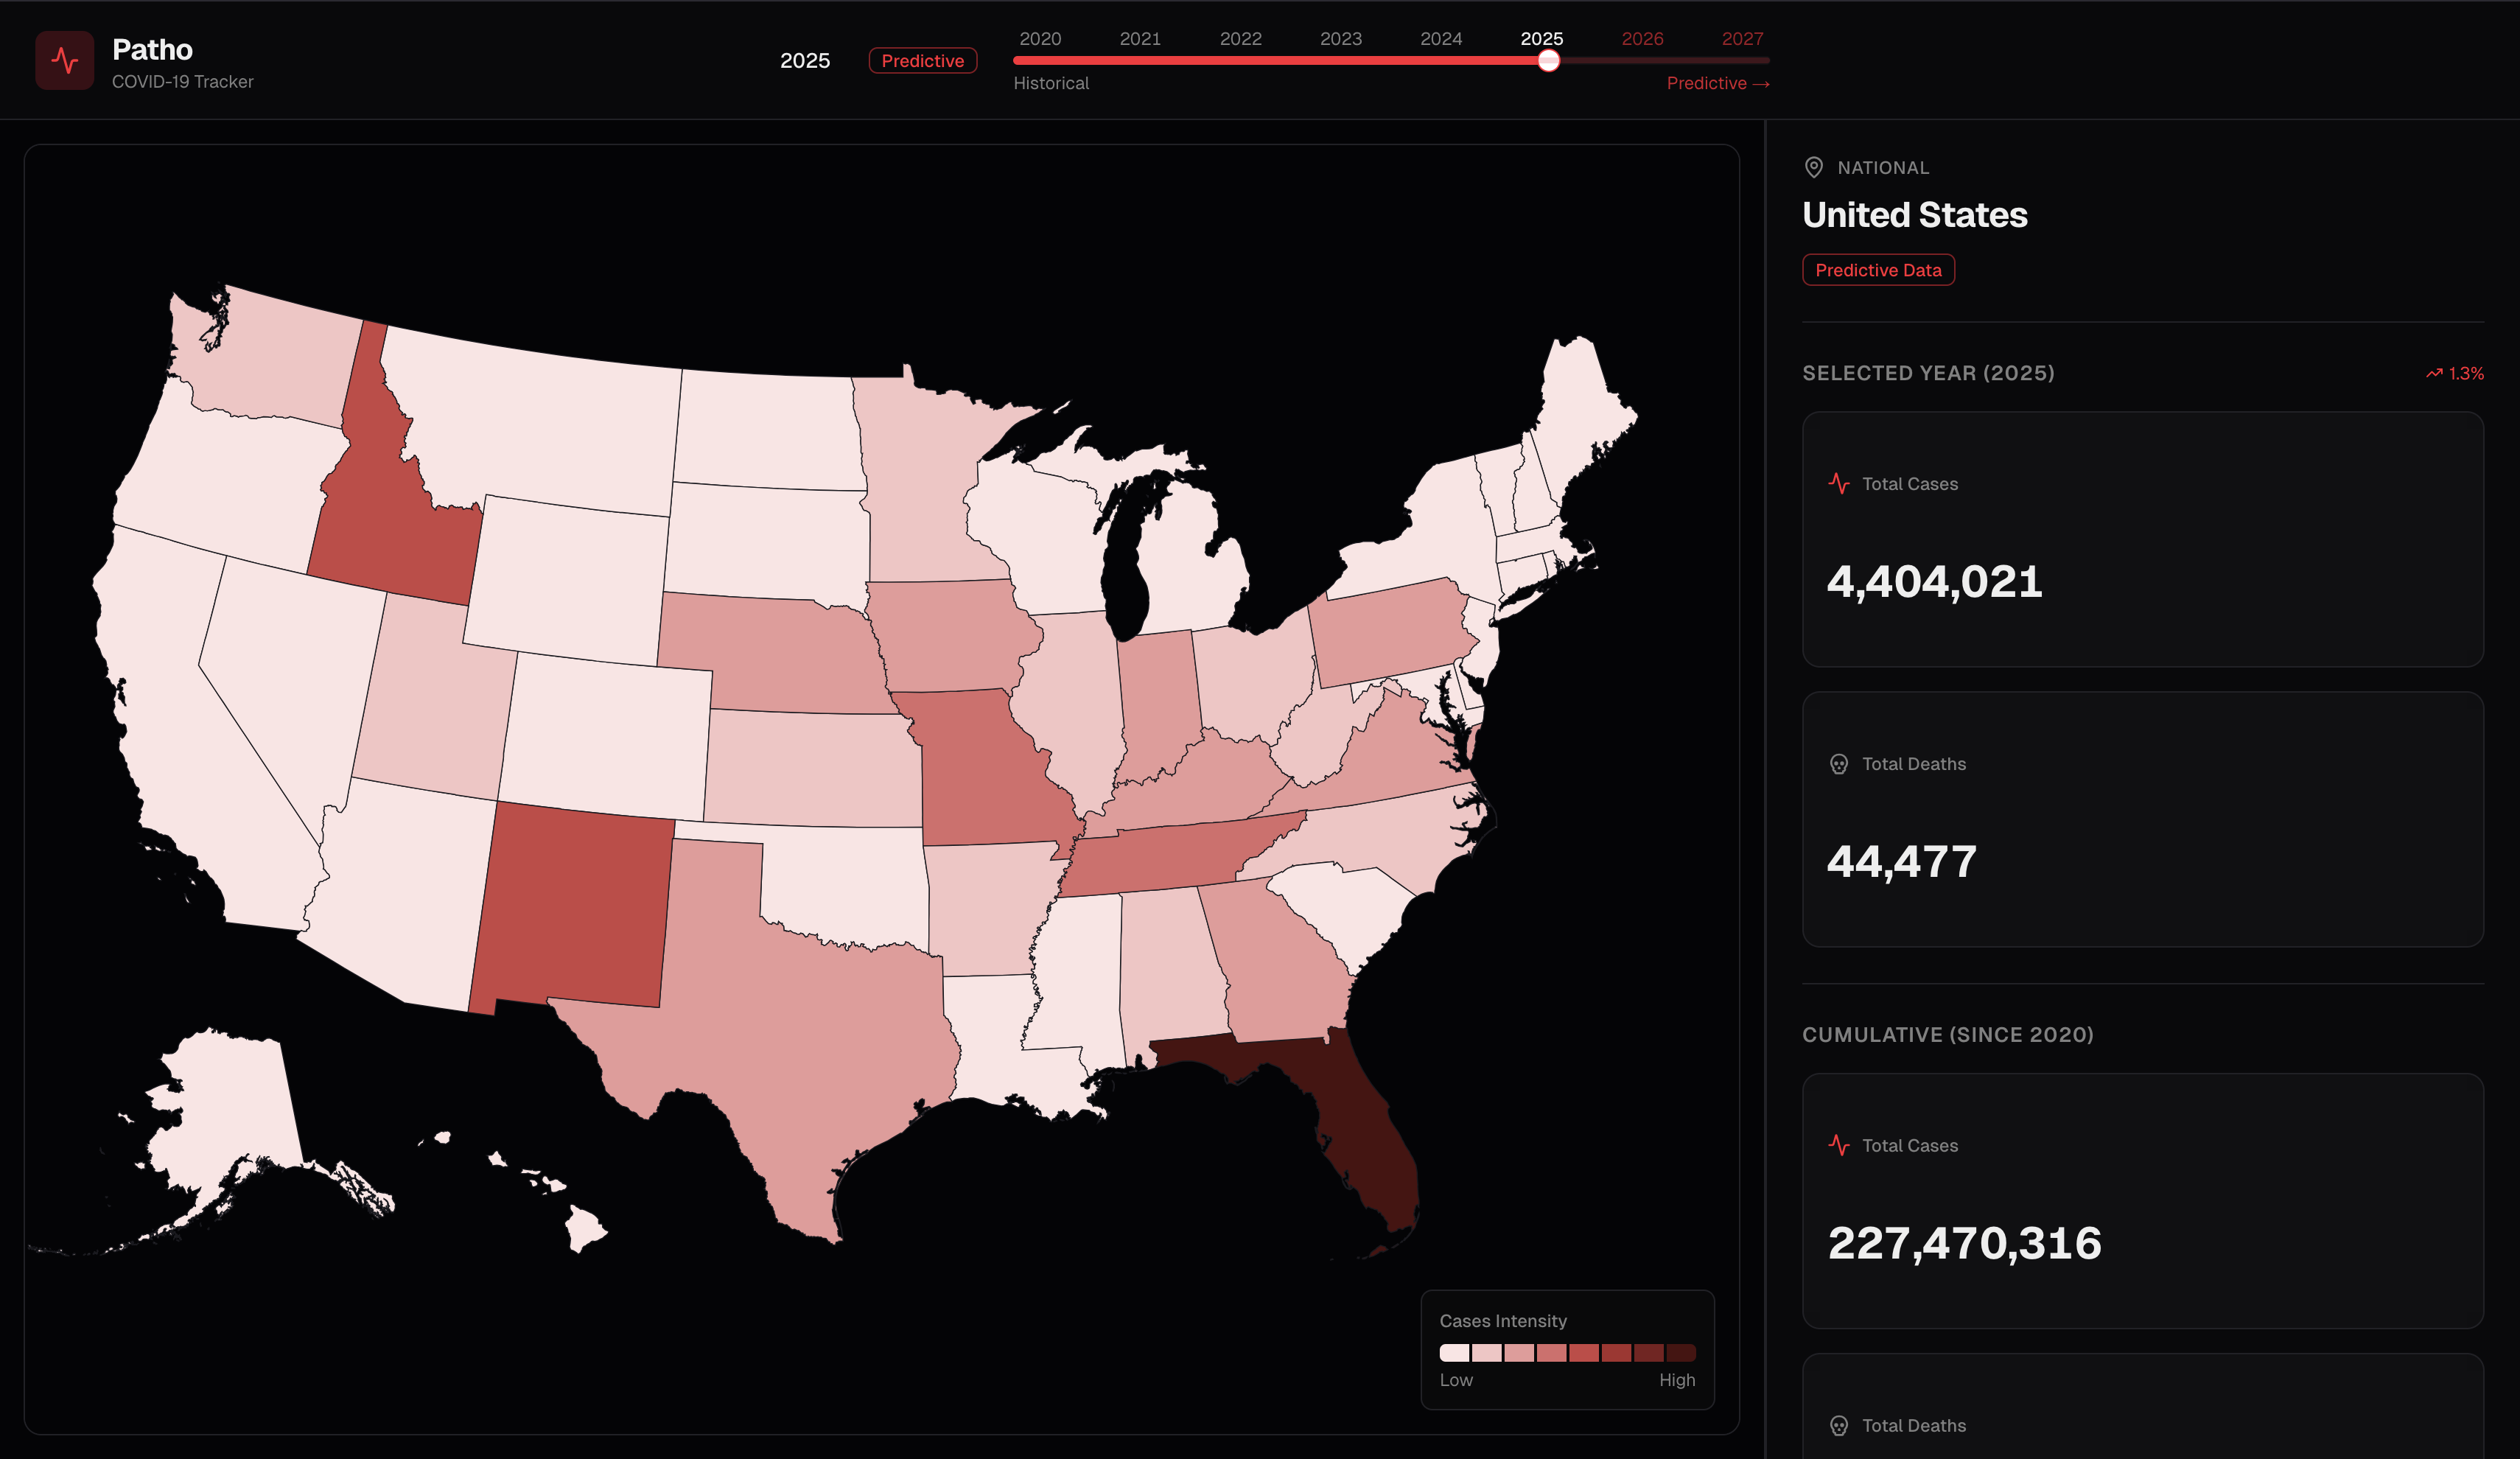
Patho is an interactive public health dashboard that maps COVID-19 case and death data across every US county, pulling from historical CDC datasets. Users can click any state or county to get granular metrics, scrub through a time slider to watch outbreaks evolve, and toggle predictive models to see where cases are projected to go.
How we built it
We built Patho on a modern full-stack architecture optimized for speed. The frontend is Next.js with Tailwind CSS and react-simple-maps for the interactive map UI. The backend is a stateless FastAPI server running on Python, deployed on a Google Cloud VM behind nginx with HTTPS. For AI, we used the Meta-Llama-3-8B-Instruct model via the Featherless API to dynamically generate predictions for future cases, and deaths in each county of the United States.
Challenges we ran into
Two things hit us harder than expected. First, the data itself. The CDC datasets are massive and inconsistently formatted, so figuring out which metrics were actually meaningful at the county level, and how to normalize them across FIPS codes and time periods, took significant iteration. Second, deployment was rougher than anticipated. Getting nginx, certbot, and uvicorn all playing nicely together on a Google Cloud VM, especially with HTTPS required by our Vercel frontend, burned more time than we'd like to admit.
Accomplishments that we're proud of
Honestly, the dashboard just looks good. Public health data is usually presented in dense, inaccessible tables, and we're proud that Patho makes it feel approachable and even compelling. Beyond aesthetics, successfully chaining three separate APIs together, Featherless, ElevenLabs, and our own FastAPI backend, into a seamless sub-2-second experience from county click to audio playback felt like a real technical win.
What we learned
We came in knowing the individual pieces, Next.js, Python, REST APIs, but this project taught us how much harder it is to make them all work together under time pressure. Managing CORS across services, handling streaming responses correctly, and keeping a shared Git history clean across a split frontend/backend team were all humbling lessons. We have a much deeper respect for full-stack infrastructure now.
What's next for Patho
We want to push the ElevenLabs integration further by giving users an actual conversational AI they can query about any region's outbreak history, not just passive audio summaries. We also want to expand beyond COVID to other diseases like flu, RSV, and mpox. A big feature on our roadmap is modeling the impact of transportation networks: showing how commercial flight routes and highway traffic corridors accelerate or contain spread. Long term, we want Patho to pull live CDC data streams so the map is always current, and layer in richer statistics like vaccination rates, hospital capacity, and demographic vulnerability.
Built With
- ananconda
- elevenlabs
- featherless
- google-cloud
- node.js
- python
- react
- typescript
- v0
- vercel

Log in or sign up for Devpost to join the conversation.