-
-
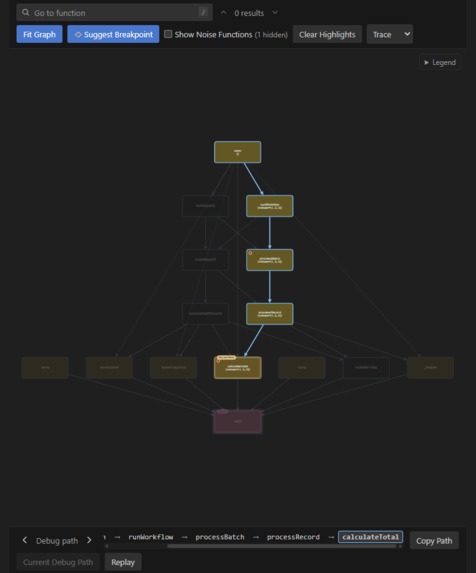
Debugging Graph
-
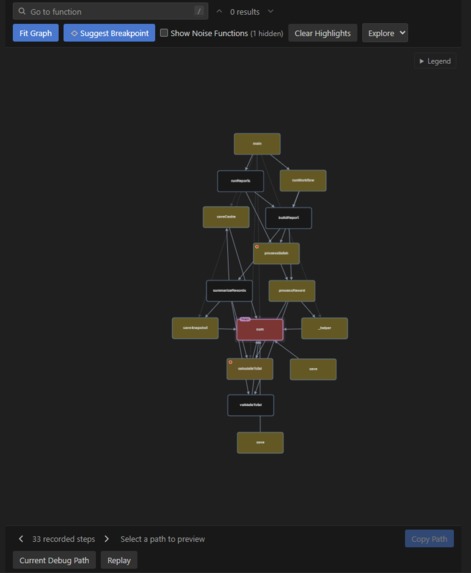
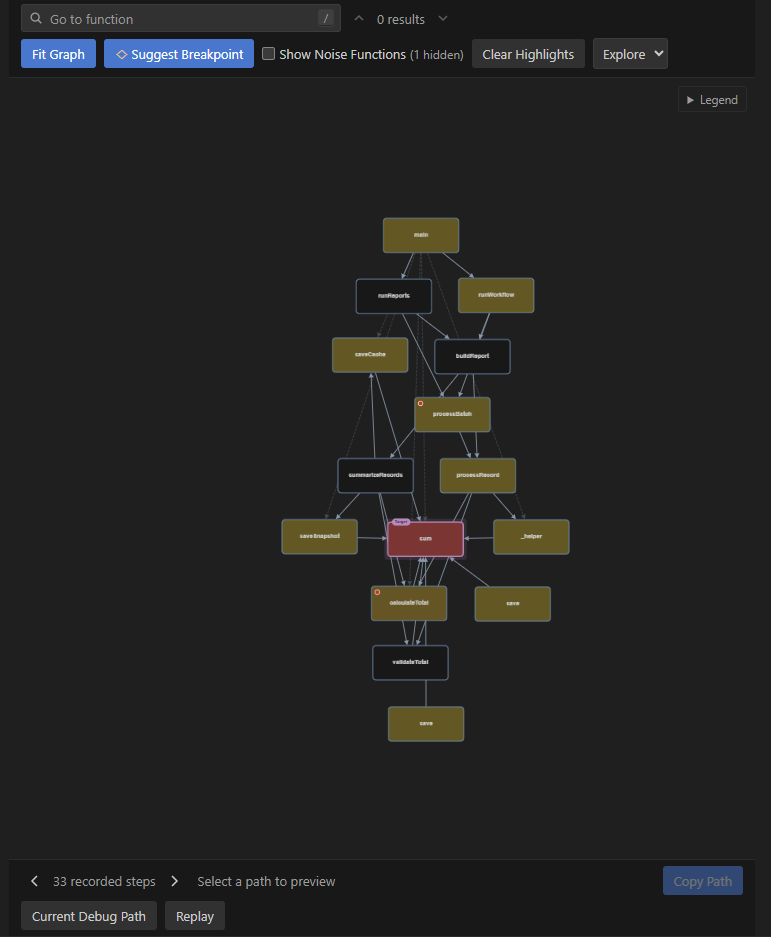
Explore View of Graph
-
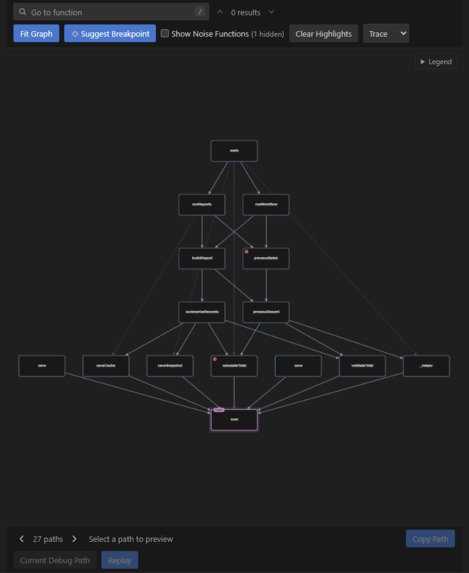
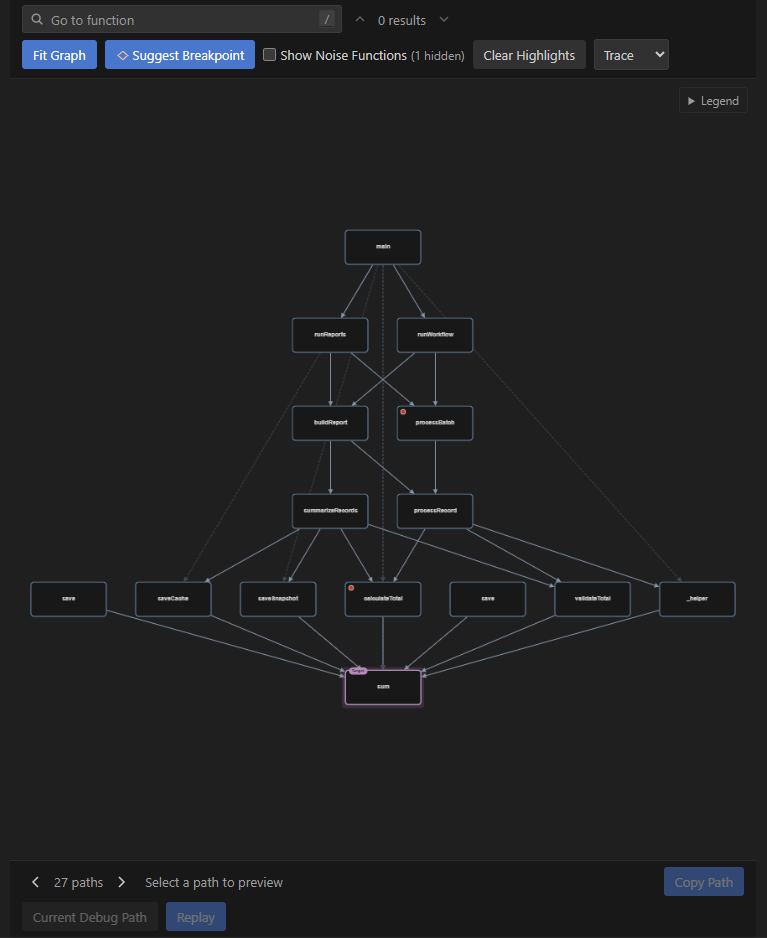
Static Graph of Functions
Inspiration
We kept running into the same problem: being dropped into a huge codebase that we did not write and having no idea how it fits together. You spend hours jumping between files just to figure out what calls what and why the code ends up where it does. The map of how everything connects lives only in the original author's head. We wanted the editor to draw that map for us.
What it does
PathFinder turns any function into an interactive map of your code. Right-click a function and it draws the call graph, showing who calls it and what it calls, right inside VS Code. Then it layers your program's real behavior on top.
See the structure:
Call graph from a right-click on any line in a function Noise tags that automatically mark uninteresting nodes so the important ones stand out Chokepoint nodes that highlight the functions every path has to pass through Recursion nodes that mark groups of functions that call each other in a loop Truncation markers so you know when a graph is deeper than what is shown A clean layout with search, so tangled graphs stay readable and you can jump to any node
Watch it run:
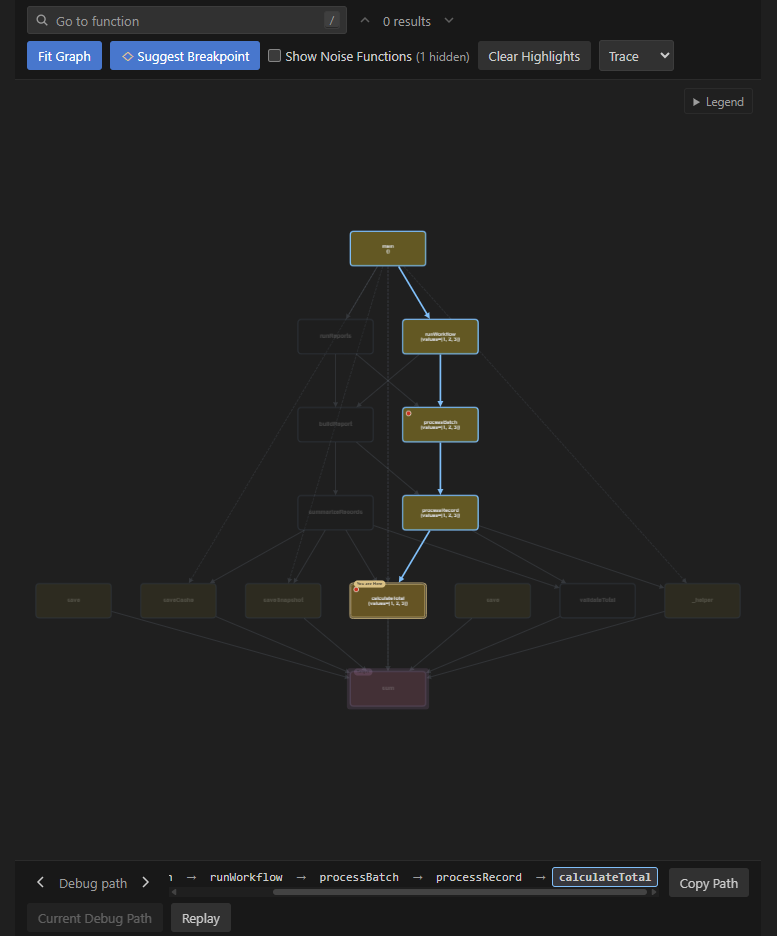
Live execution path that lights up through the graph while you debug Replay that animates the path one node at a time Session time travel that records every pause and step, so after a session ends you can scrub back and forth through your whole run Exception paths colored red, so you can see exactly how an error traveled through the code
Understand each function:
A heatmap that colors nodes by how many times they actually ran, counted live on every call, for Python, C, and C++ Live argument values on paused nodes, like add(a=3, b=4) A plain-English AI summary of what a path is doing Hover tooltips, click to jump to the code, breakpoint markers, a legend, a live breadcrumb of the current path, and a copy-path button
It works across Python, C, and C++, so the same way of thinking carries from one language to the next.
How we built it
PathFinder is a VS Code extension written in TypeScript, with the graph drawn in a webview using Cytoscape. We build the call graph from VS Code's Call Hierarchy API, so we rely on the language servers already installed instead of parsing code ourselves.
The debugging features hook into VS Code's Debug Adapter Protocol. A tracker watches the live call stack and matches each frame to a node in the graph by its file and line. For the heatmap we needed real counts of how often each function runs, without changing the user's code, so we inject a small hook into the running program. For Python we use the sys.monitoring interface, and for C and C++ we use a GDB script. The counts stream back to the extension and color the graph. The AI summaries send the captured path to Anthropic's API and show the response.
We split the work three ways. One of us built the structural analysis and language support, like the noise tags, chokepoints, recursion detection, the C and C++ heatmap, the AI integration, and exception handling. One built the graph rendering, the layout, search, replay, and the overall look and feel. One built the debugger features: live counting, argument values, the session history scrubber, breakpoint markers, and the smaller tools that tie it together. We merged our work into a shared repo continuously.
Challenges we ran into
The hardest part was counting function calls live and accurately without getting in the way of the debugger. Our first idea, Python's sys.settrace, did not work, because the debugger already uses that hook. We switched to sys.monitoring, which runs next to the debugger without fighting it.
The second problem that kept coming back was identity. The debugger, the graph builder, and the counting hook each see a function a little differently, because of absolute versus relative paths, letter case on Windows, and the way nested and decorated functions are named. Getting all of them to agree on which node is which, so a highlight lands on the right node, took careful matching by location rather than by name.
And because three of us were editing the same files at the same time, a lot of effort went into keeping our changes merged cleanly and the build working for everyone.
Accomplishments that we're proud of
It works from end to end, not as a mockup. You can right-click a function, watch its real path light up as you debug, see the busiest functions glow, and then rewind through your whole session afterward. Getting live, every-call counting to run quietly beside the debugger, in both Python and C and C++, is the piece we are most proud of, because it was the part we were least sure we could do. We are also proud that, as a team of three, we shipped a wide set of features that all work together.
What we learned
We learned how much a debugger can do with the tools VS Code already gives you. The Call Hierarchy and the Debug Adapter Protocol handed us most of our data for free. We also learned that a tool like this lives or dies on getting different systems to agree on identity, and that getting that right early saves hours of wondering why nothing is highlighting. And we got much better at working in the same repo at the same time without stepping on each other.
What's next for PathFinder
Whole-project graphs that scale to large codebases, with controls to collapse and filter nodes Comparing two runs, so you can see how different inputs take different paths and find why a bug only happens sometimes More languages through the same approach, like JavaScript, Java, and Go Shareable debug recordings that export a session's path, counts, and timings as a bug report others can replay
Built With
- c
- c++
- claude
- css
- cytoscape
- debug-adapter-protocol
- debugpy
- express.js
- gdb
- gemini
- git
- html5
- node.js
- python
- typescript
- vscode

Log in or sign up for Devpost to join the conversation.