
Inspiration
I was looking for some data to visualise when I stumbled on this page from the Library of Congress. The information on the page was great but the presentation made it a bit difficult to get an overview.
What it does
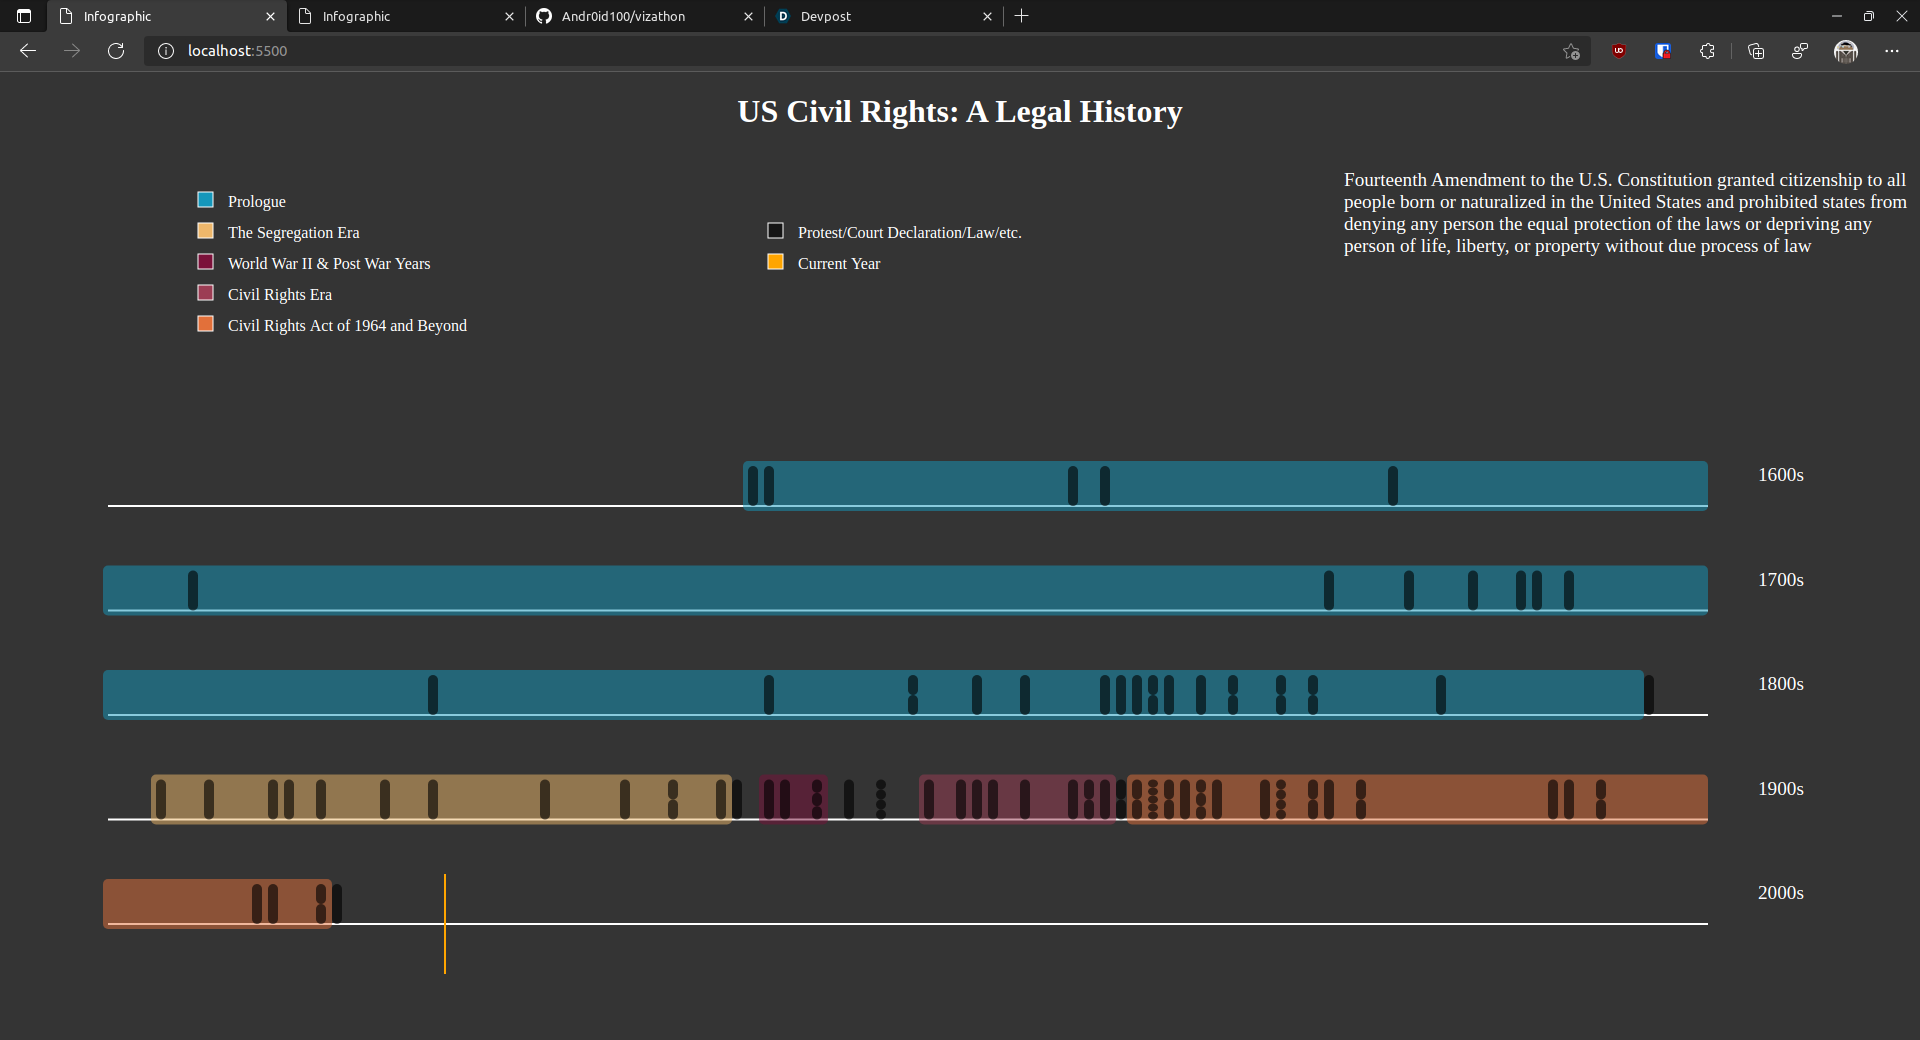
The project presents the events throughout the timeline of Civil Rights. Various events like Court Rulings, Law Signing, Protests, etc. are represented which gives the user an overview of the whole history.
How we built it
For the data collection, I used python with Beautiful Soup Library. The framework made the data collection process very smooth and required little manual intervention. I used D3.js to create the viz.
Challenges we ran into
While building the project, I was wondering if I should classify the events as positive and negative which can then be used for further design components. I decided against it because some events were ambiguous and I didn't feel qualified to make those calls.
Accomplishments that we're proud of
I successfully managed to use D3 transitions without making the code too messy. ( ゚ヮ゚)/
What we learned
Frameworks: D3 and Beautiful Soup Personally: The extremely long struggle for Civil Rights
What's next for Long fight for civil rights
I hope to contact some people who actually know a bit about the history and use their help to classify some events properly for condensing more information visually.

Log in or sign up for Devpost to join the conversation.