Inspiration
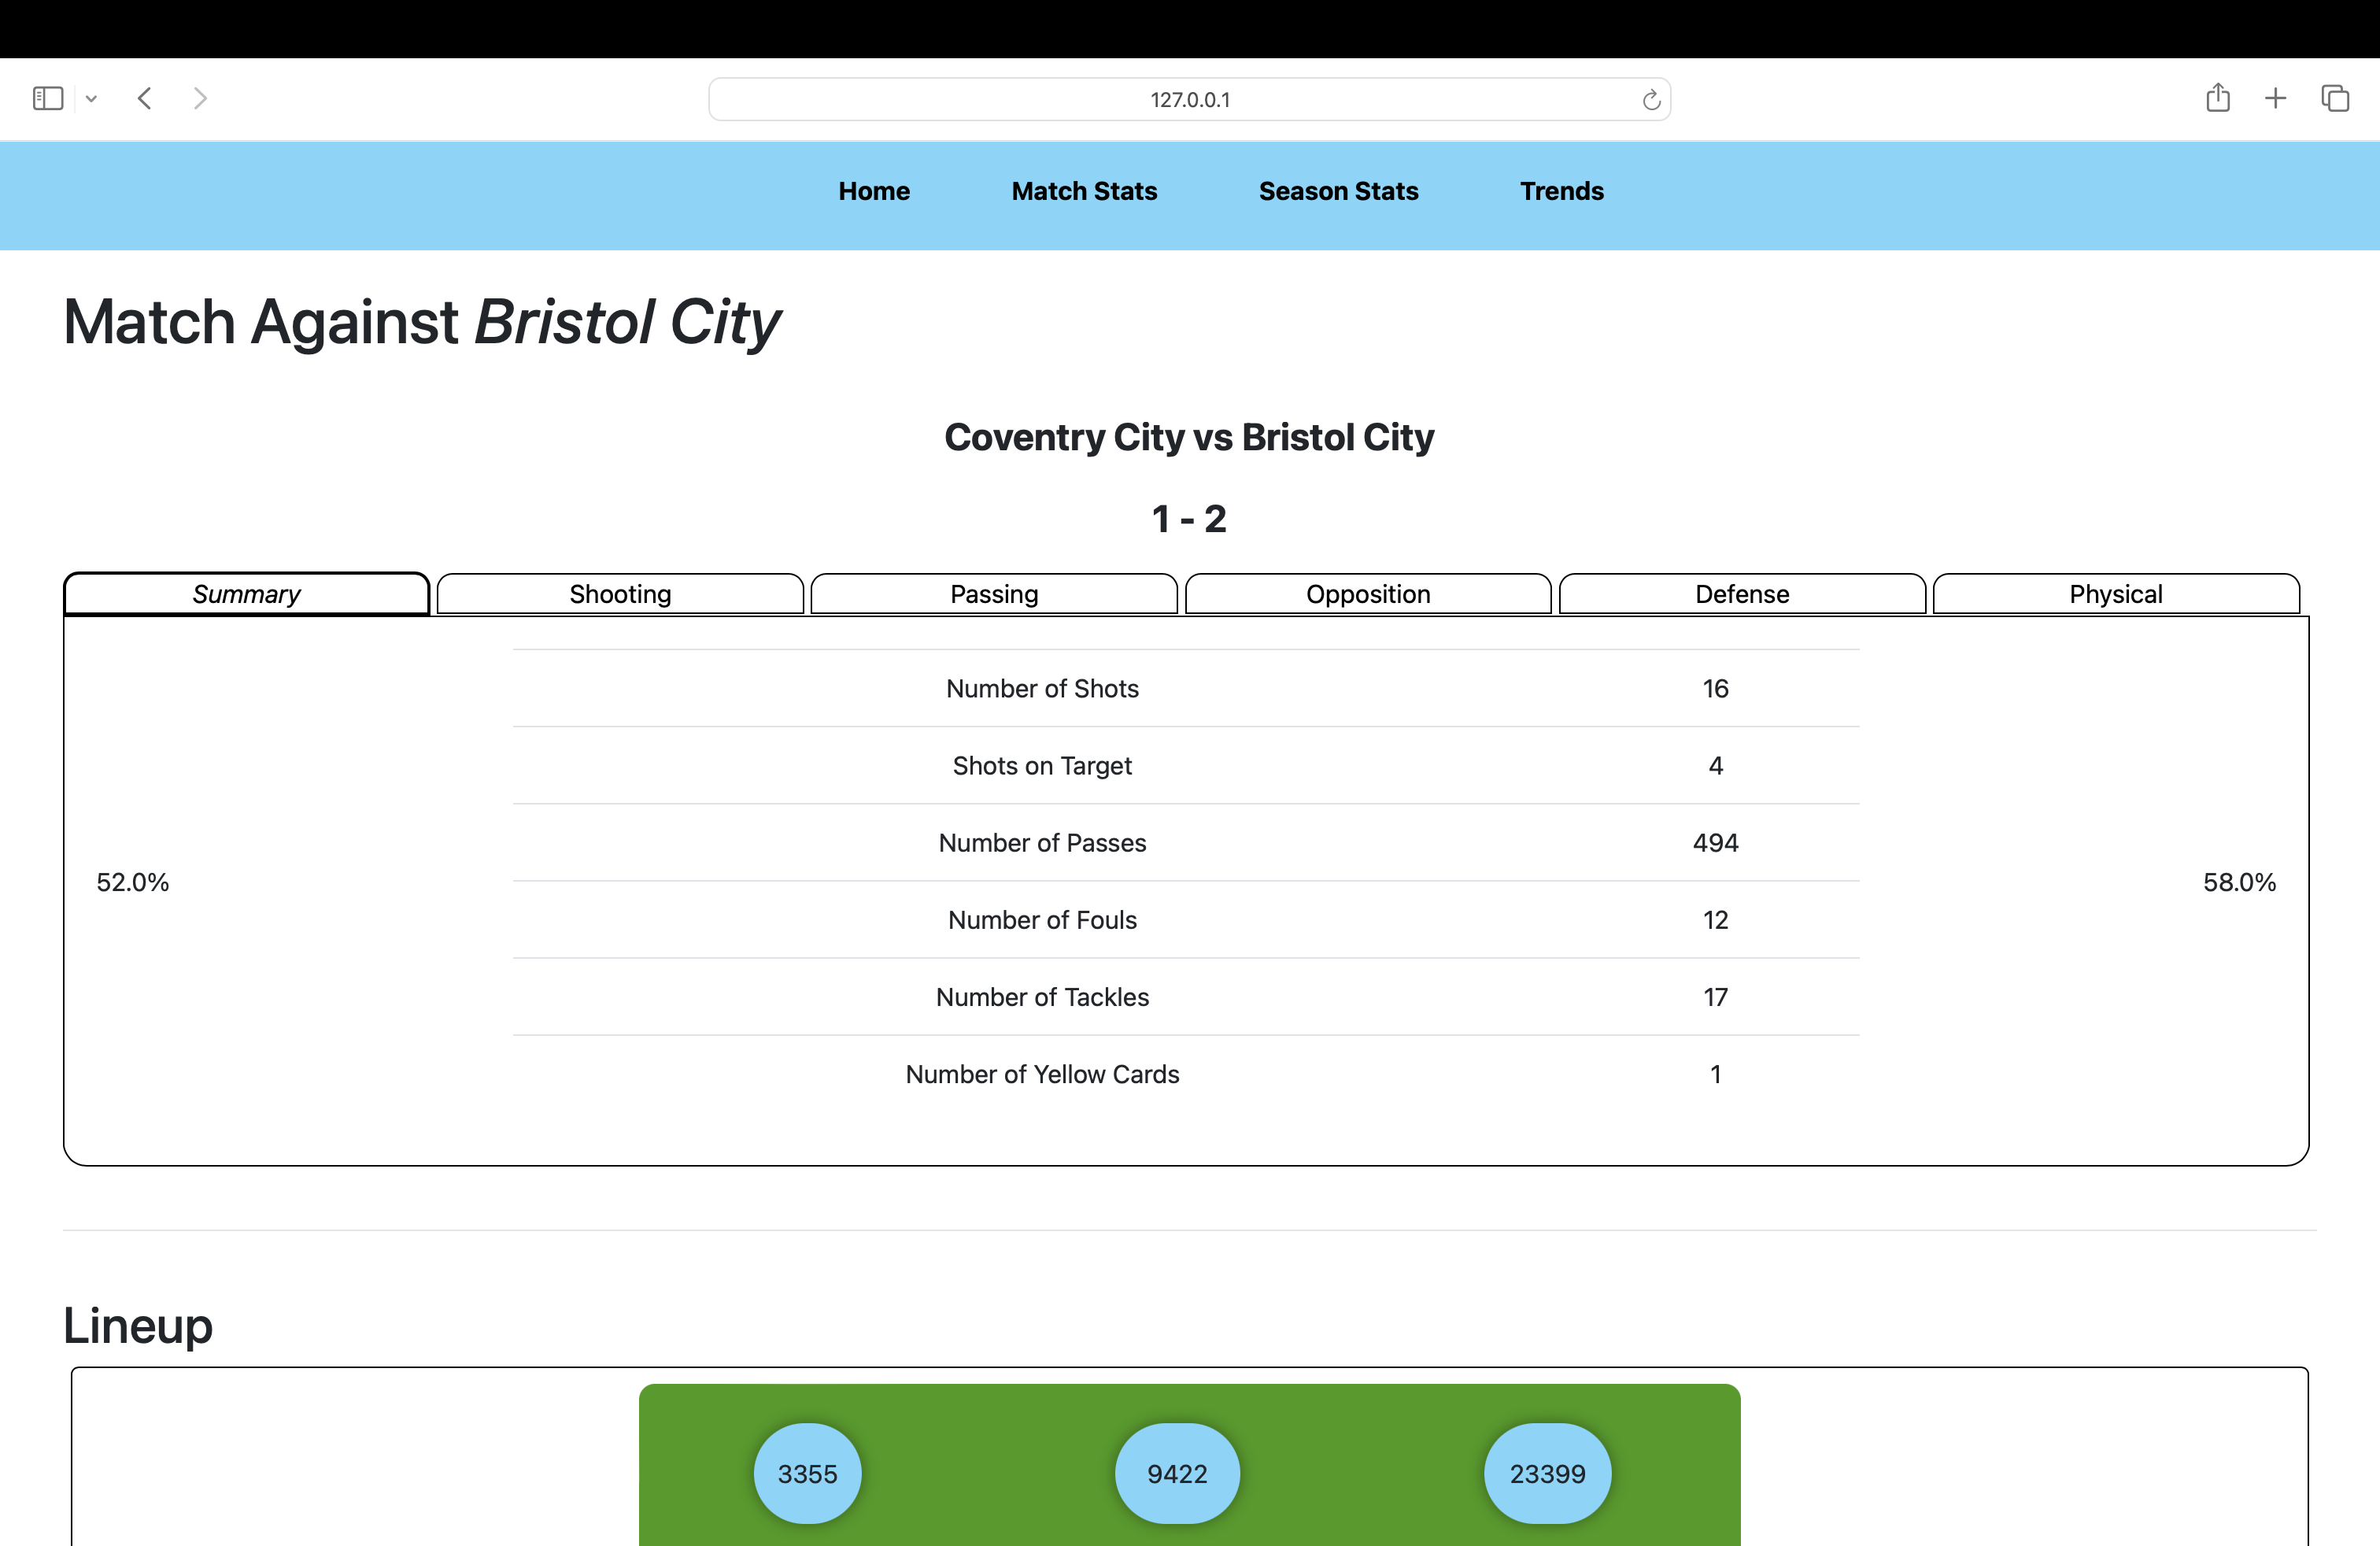
Our design and inspirations stem from many places. One of these places is EA FC (formerly known as the FIFA franchise); the main aspect that we took ideas from is the post-match display screen, which displays the match data (such as possession and offsides). We wanted to expand this concept to multiple variables.
In addition, we put ourselves in the shoes of the players and higher-ups to understand what variables are important and where we should place them. Throughout development, different revelations and nuggets of enlightenment fill our collective minds and we just chuck these ideas together.
What it does
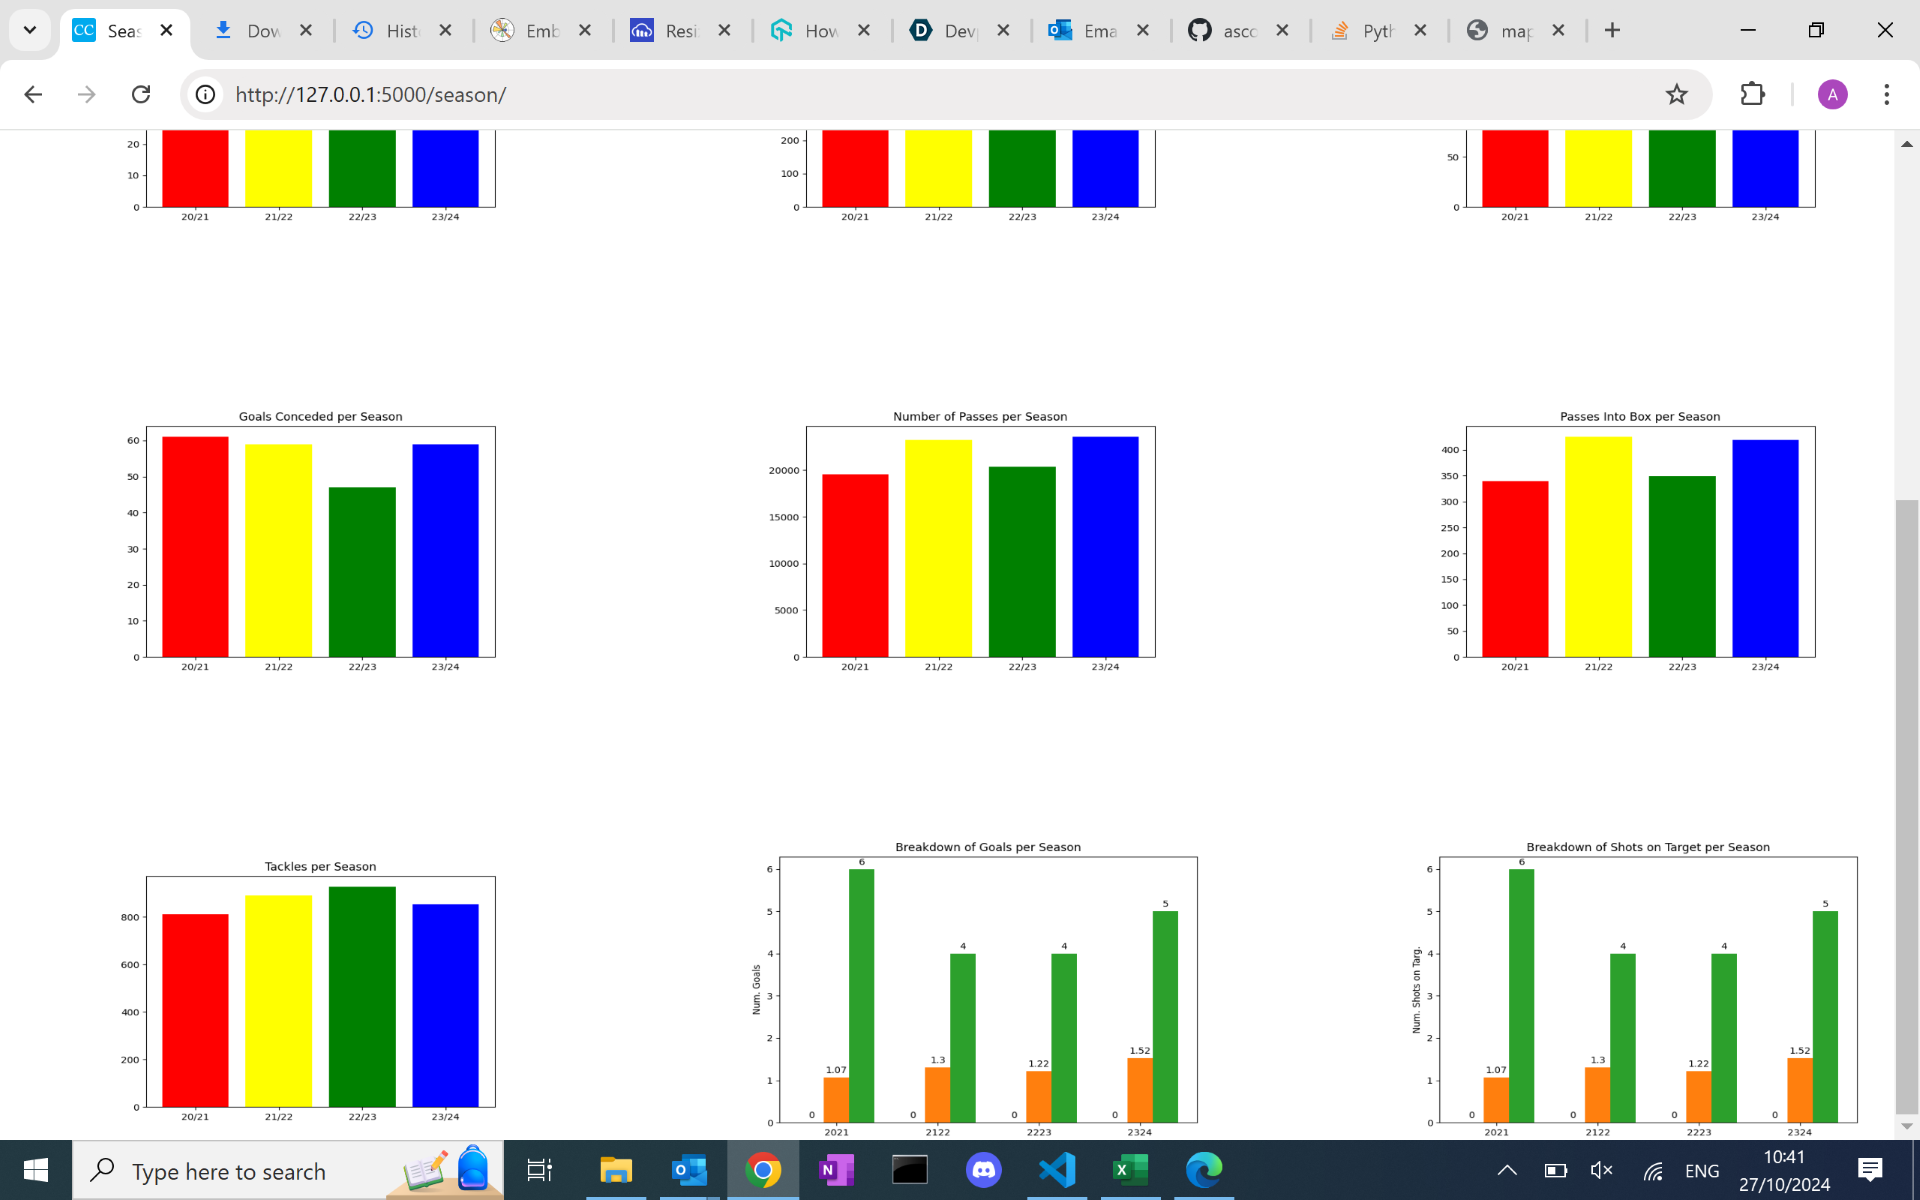
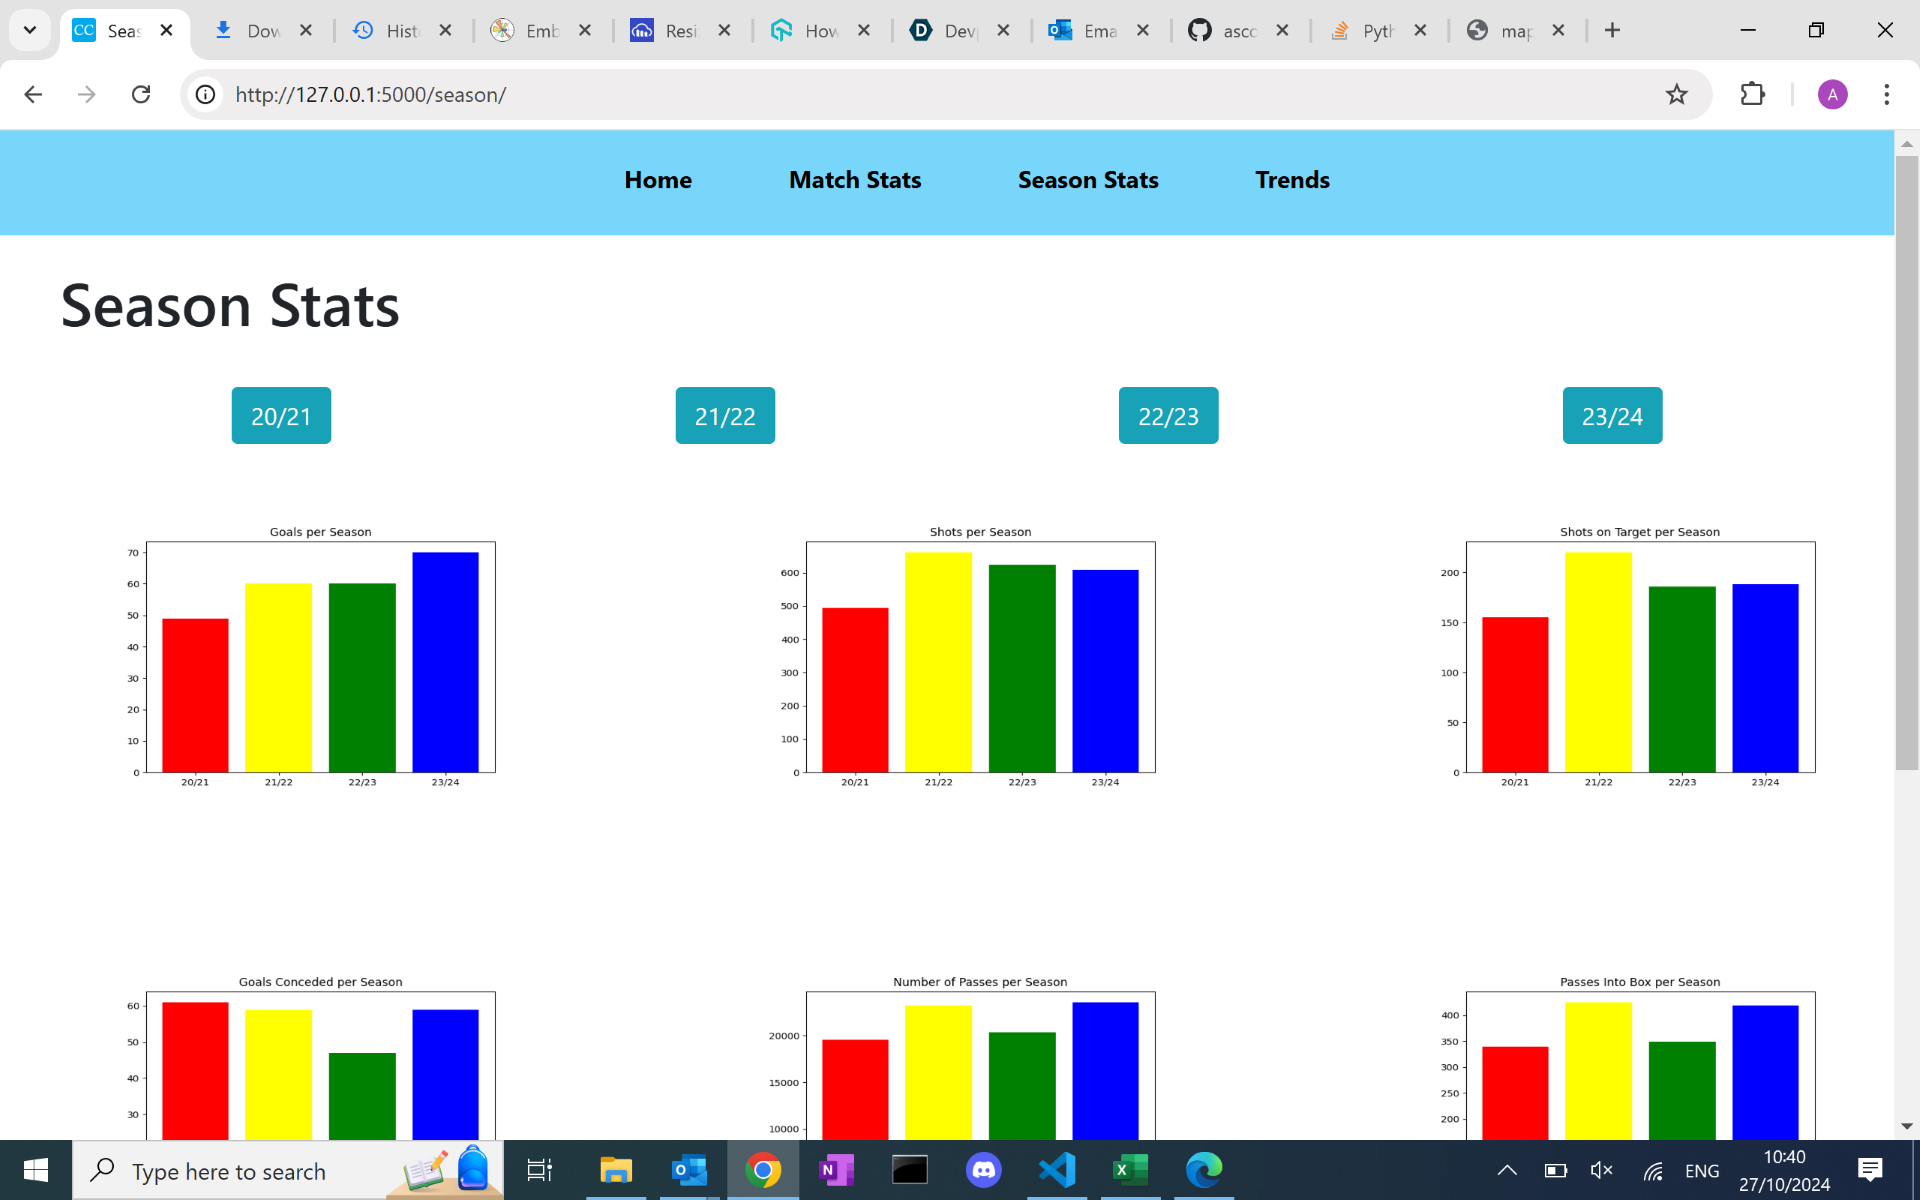
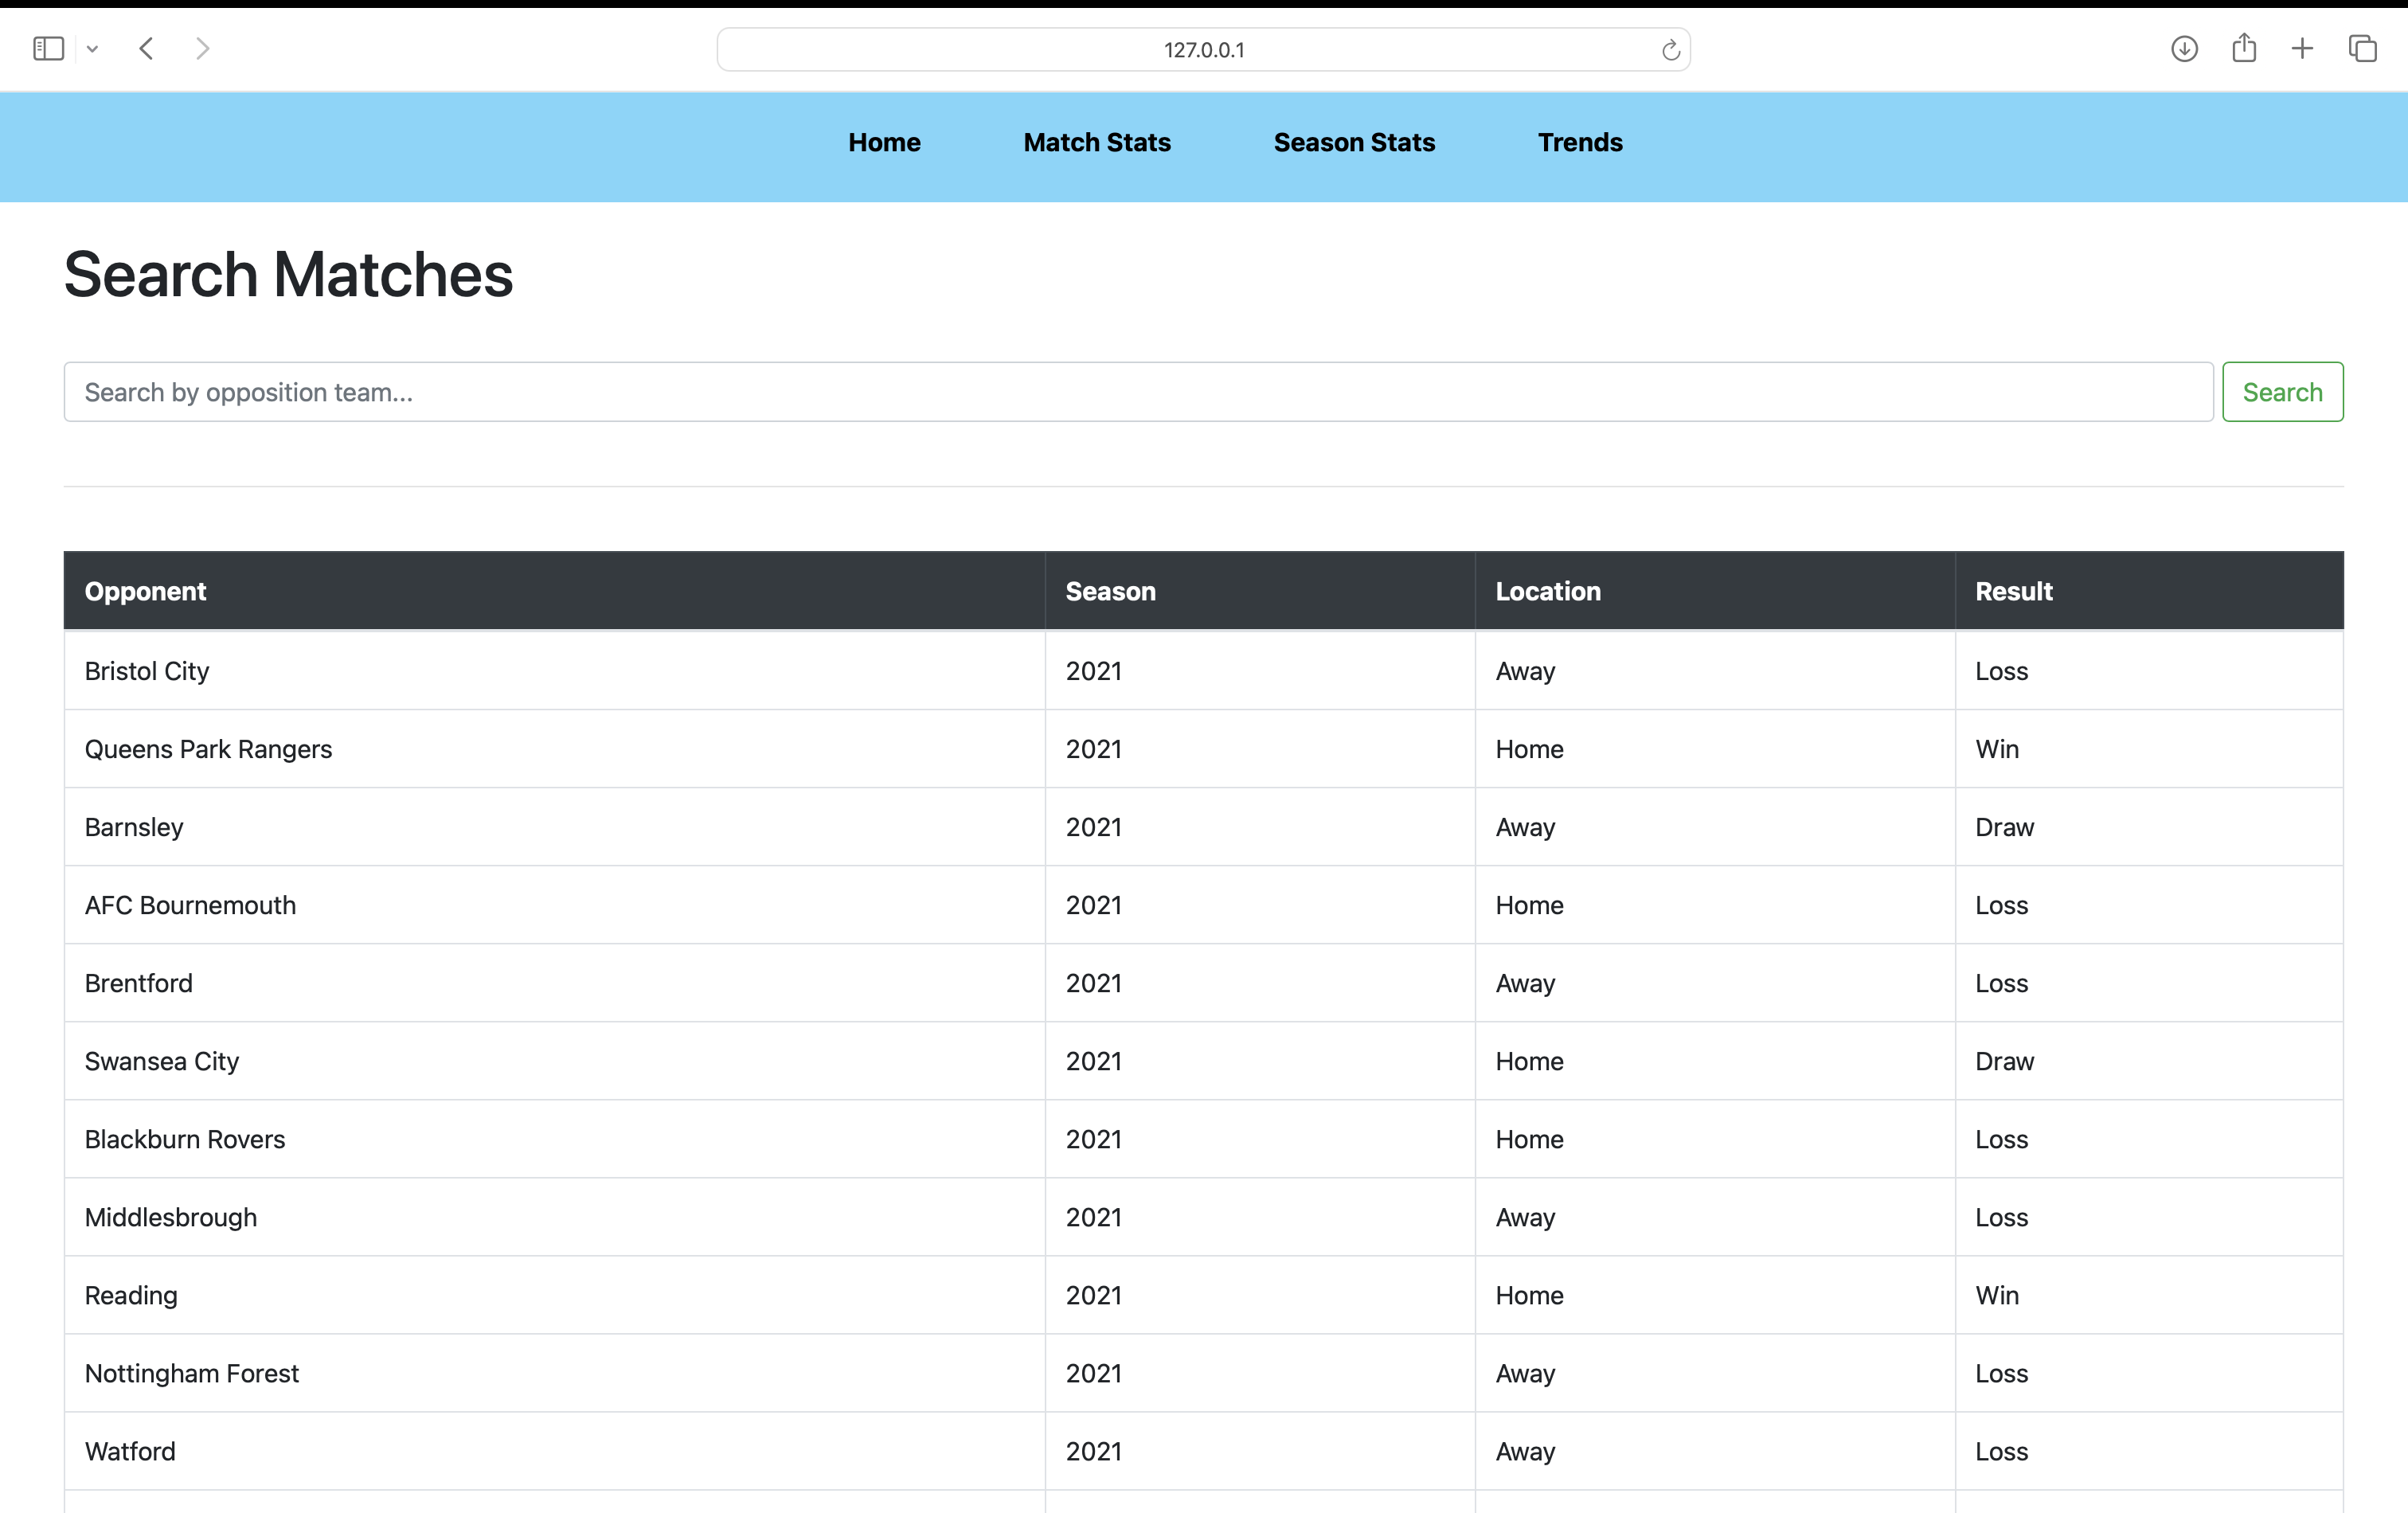
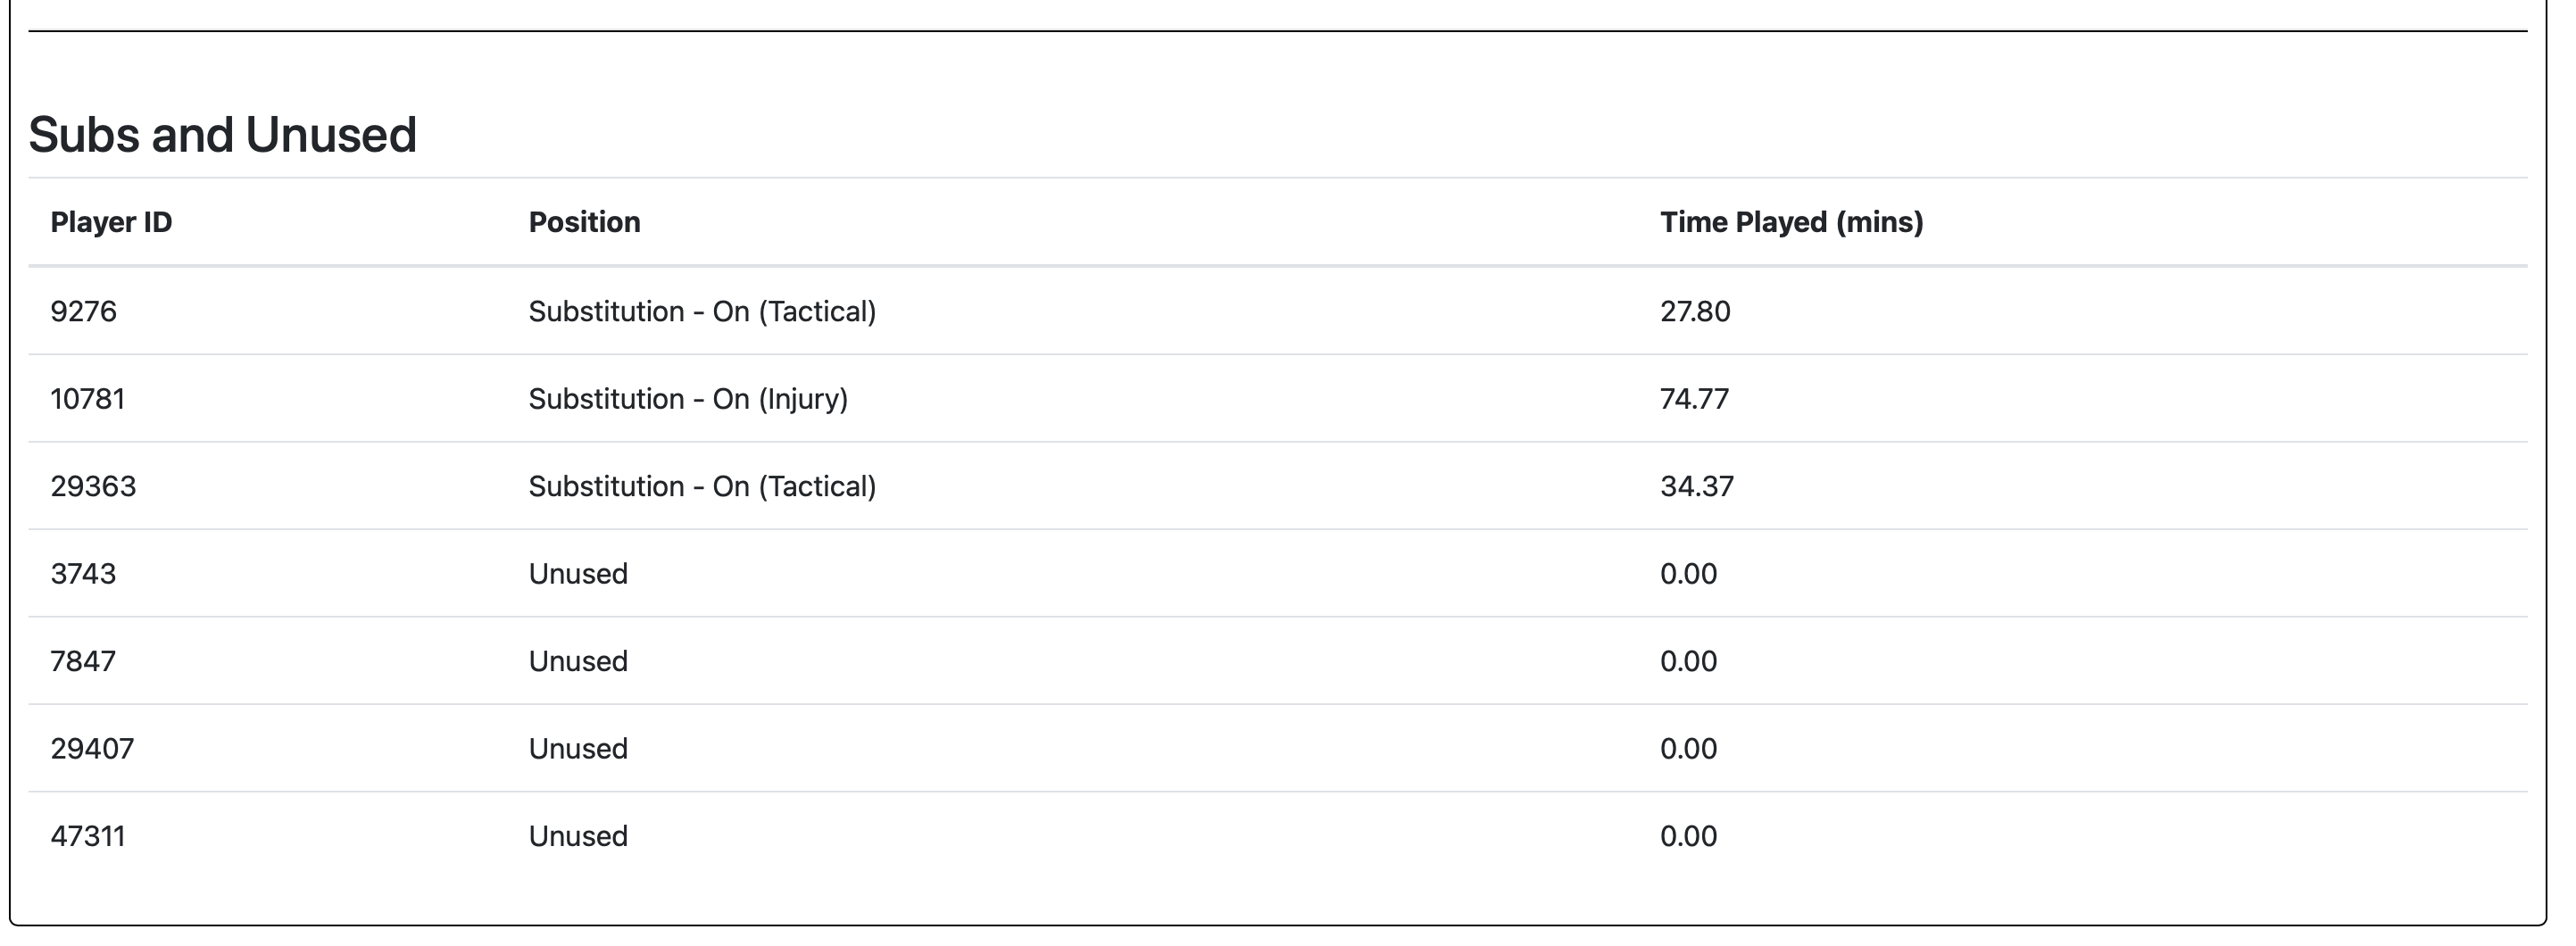
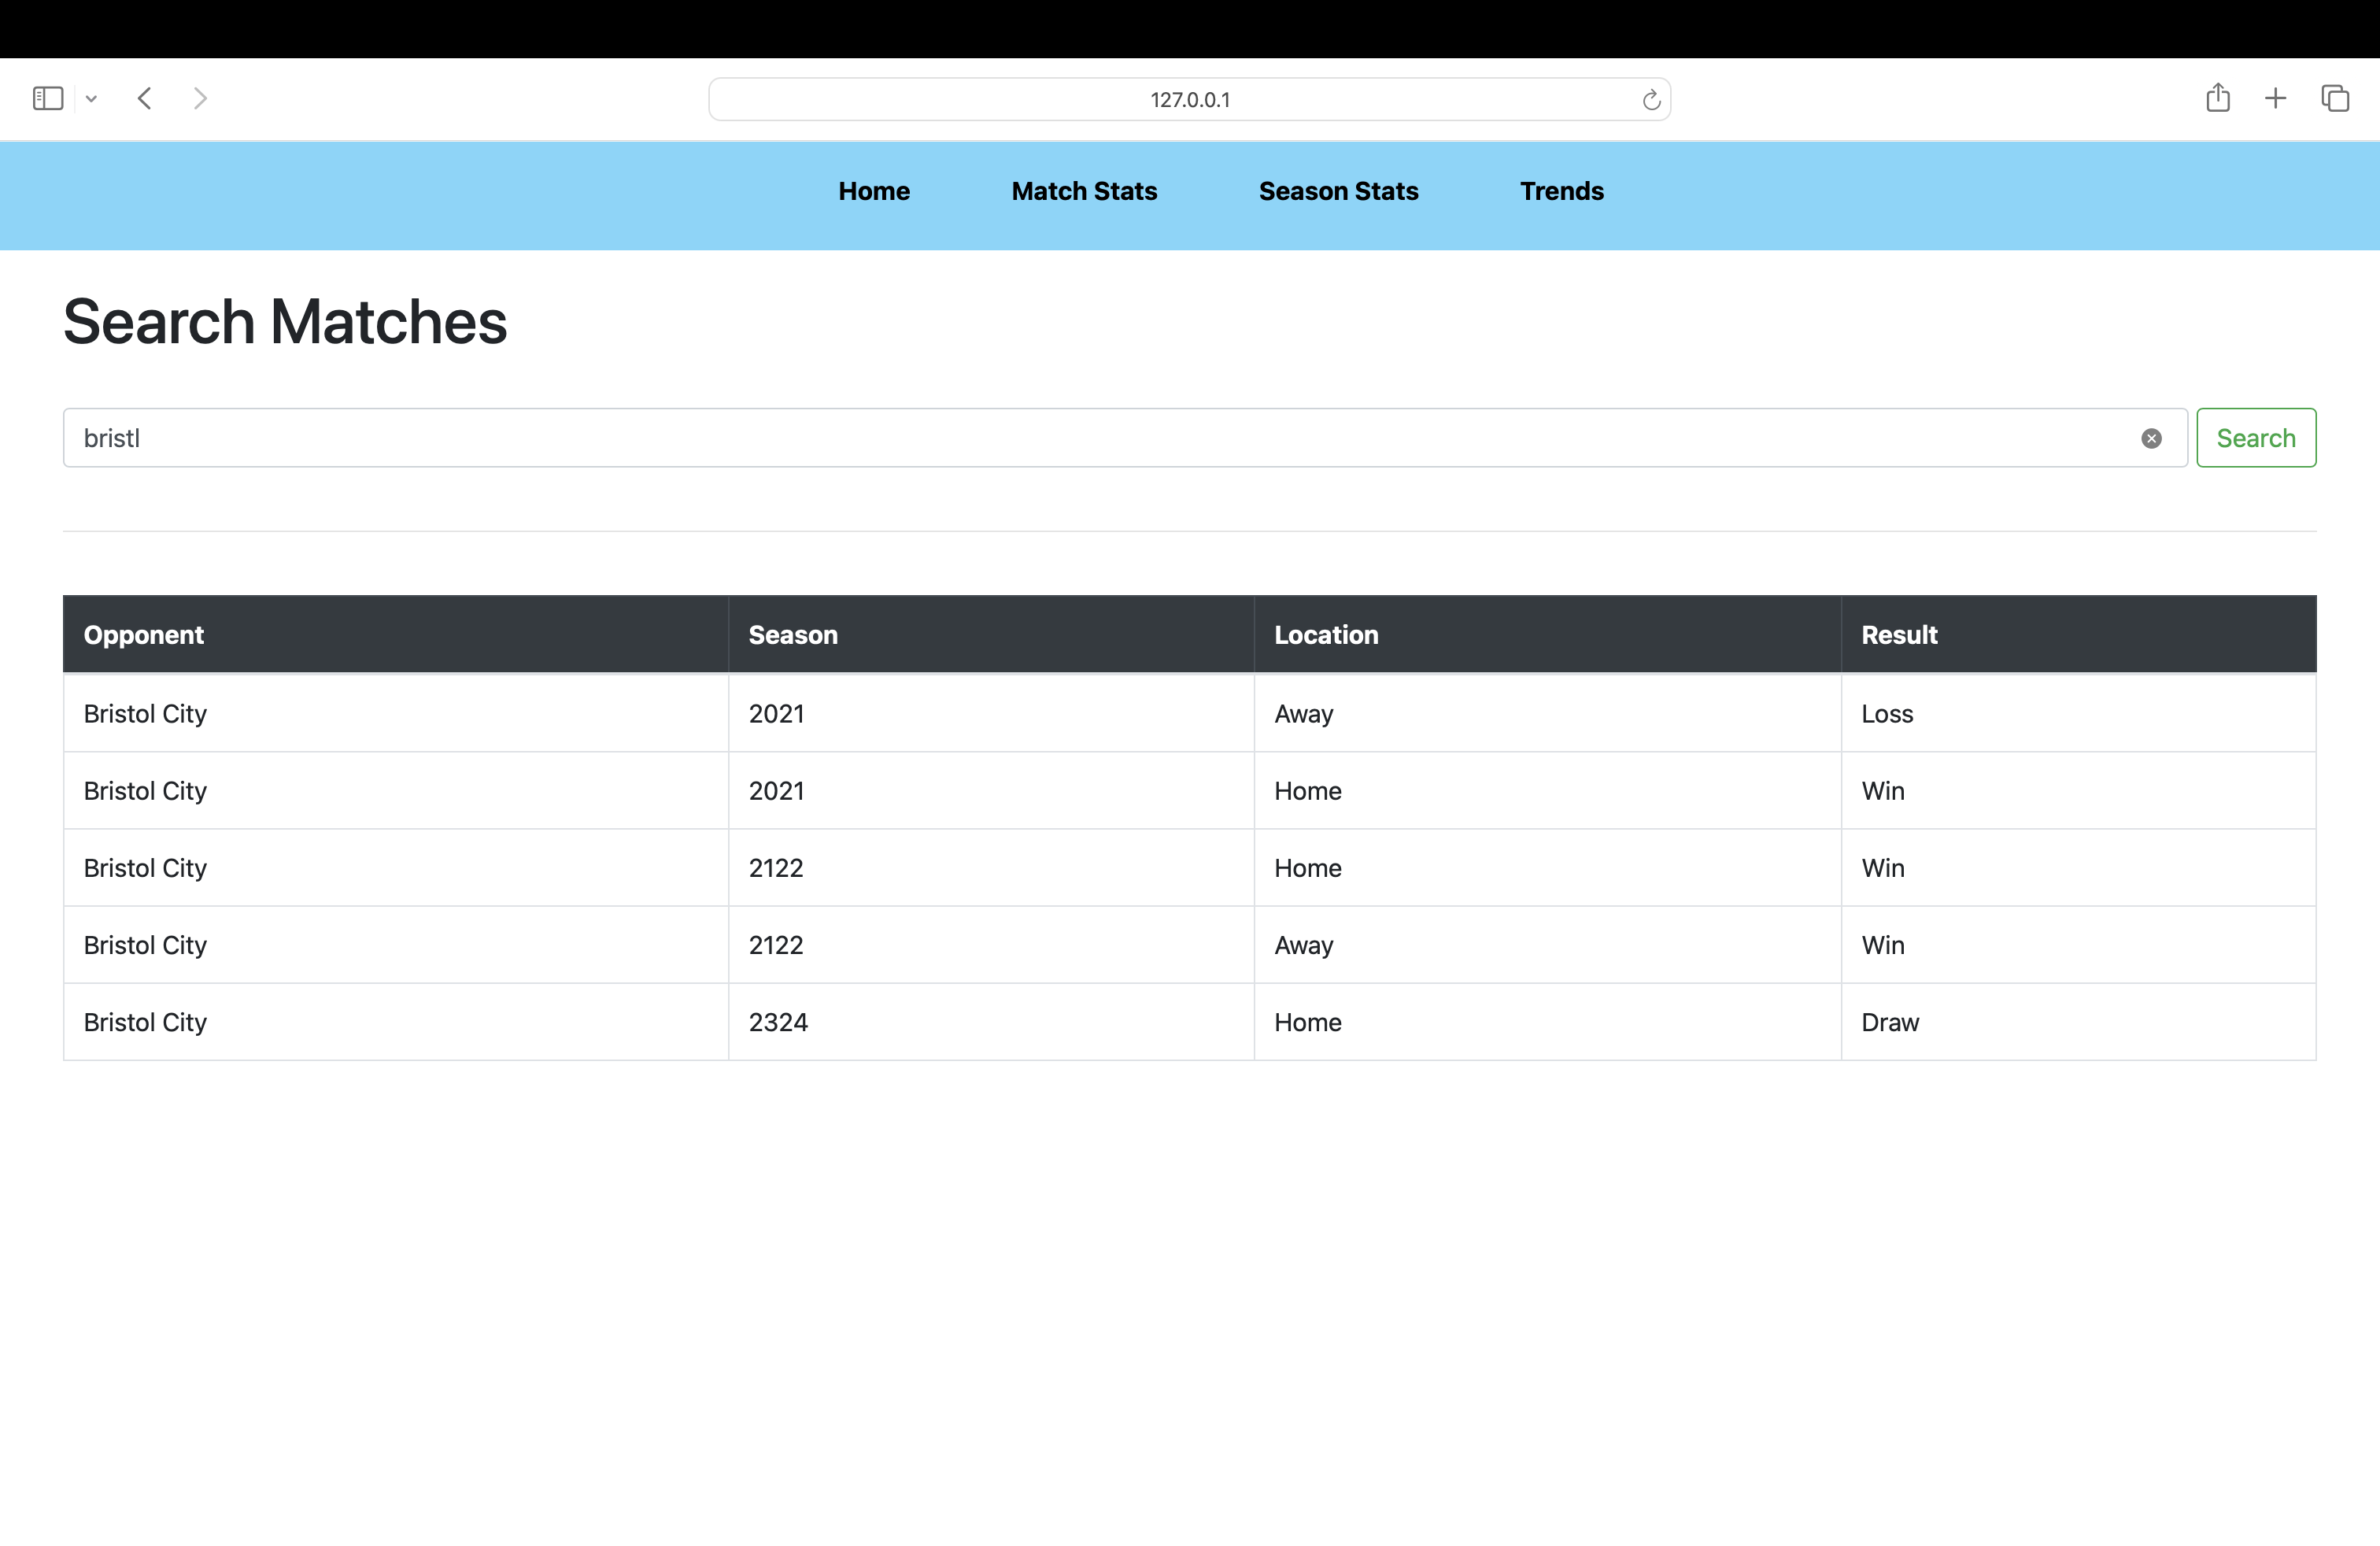
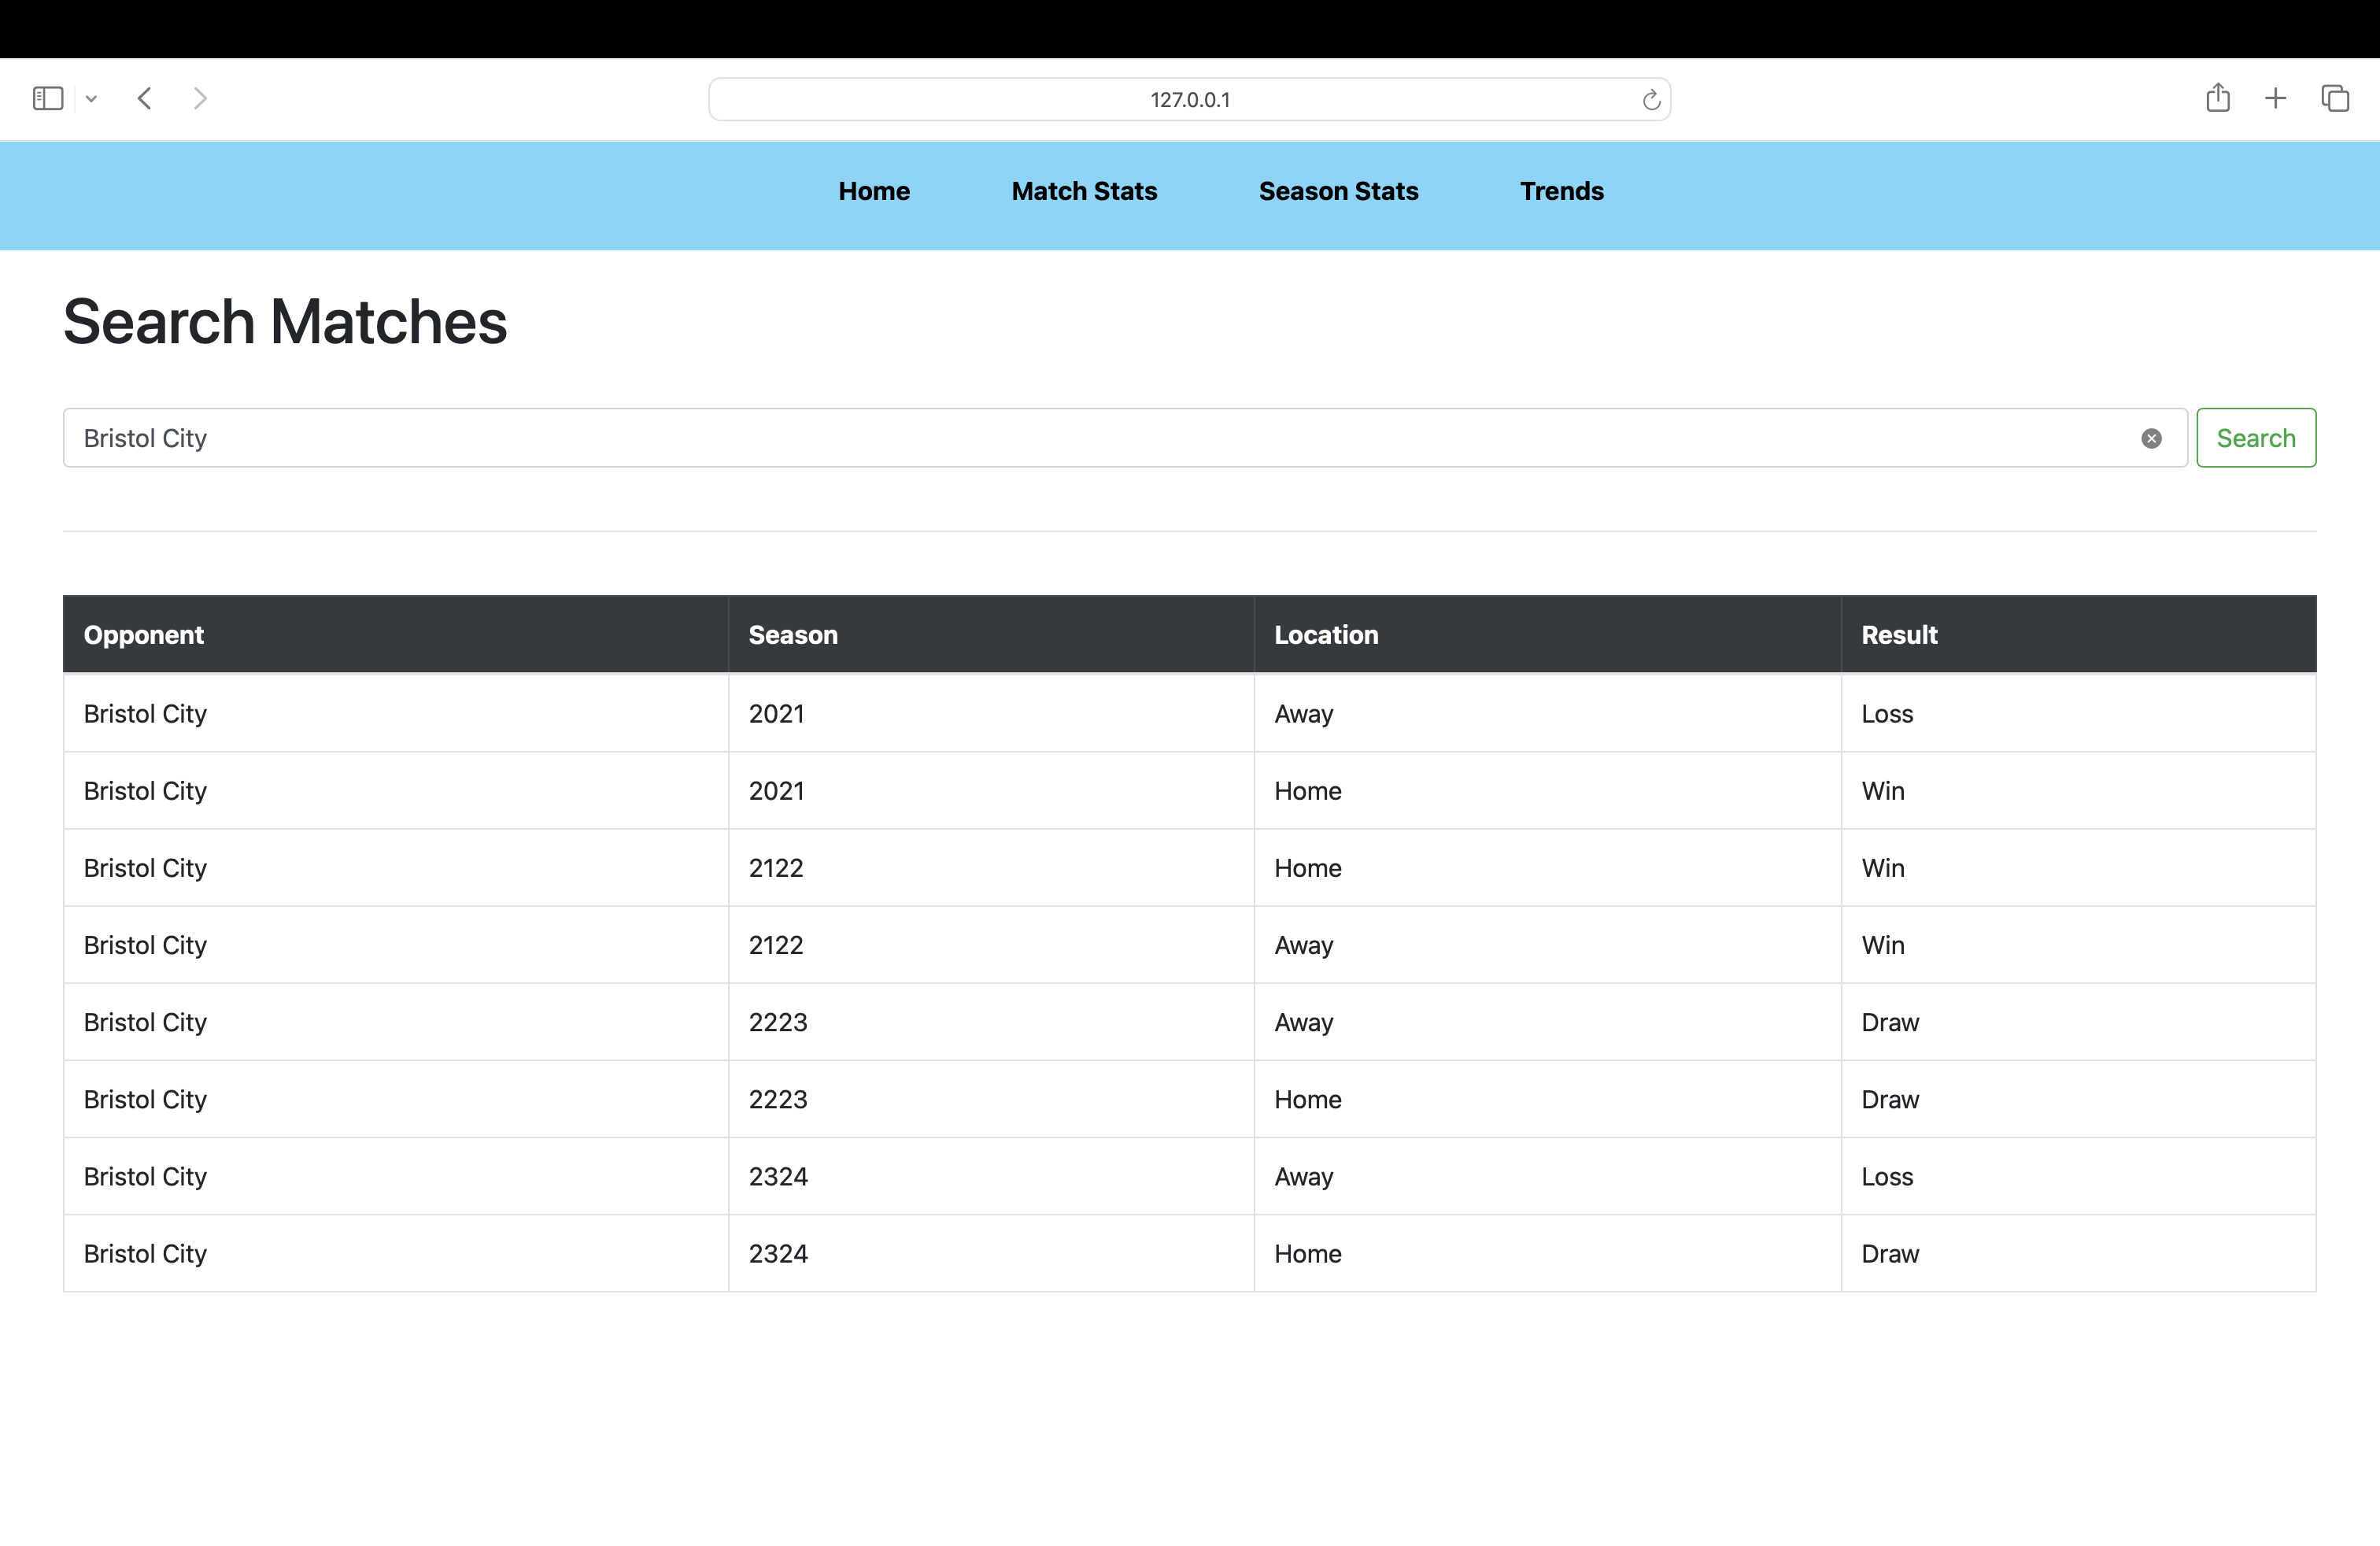
In essense, the project takes the CSV file and cleans it by removing "unnecessary" columns and removing records with NaN or empty values. With a cleaned dataset, we then analyse it many home-made function (with the help of some Python libraries). With the results of each function, we then aim to present them in a beautiful way, and make the results interactive. This will allow for a clear understanding of the data and makes trends easier to see.
How we built it
As mentioned earlier, we used some Python libraries. Our website was created in Flask, and libraries like pandas, matplotlib, numpy, etc. We split our team into frontend and backend, where one pair handles the aesthetics and the website itself, and the backend pair handles the data.
Challenges we ran into
Git is tough thing, and we had some kerfuffles here and there. Generally, our constant feedback, and potential dictatorial leadership ensured minimal software issues.
Accomplishments that we're proud of
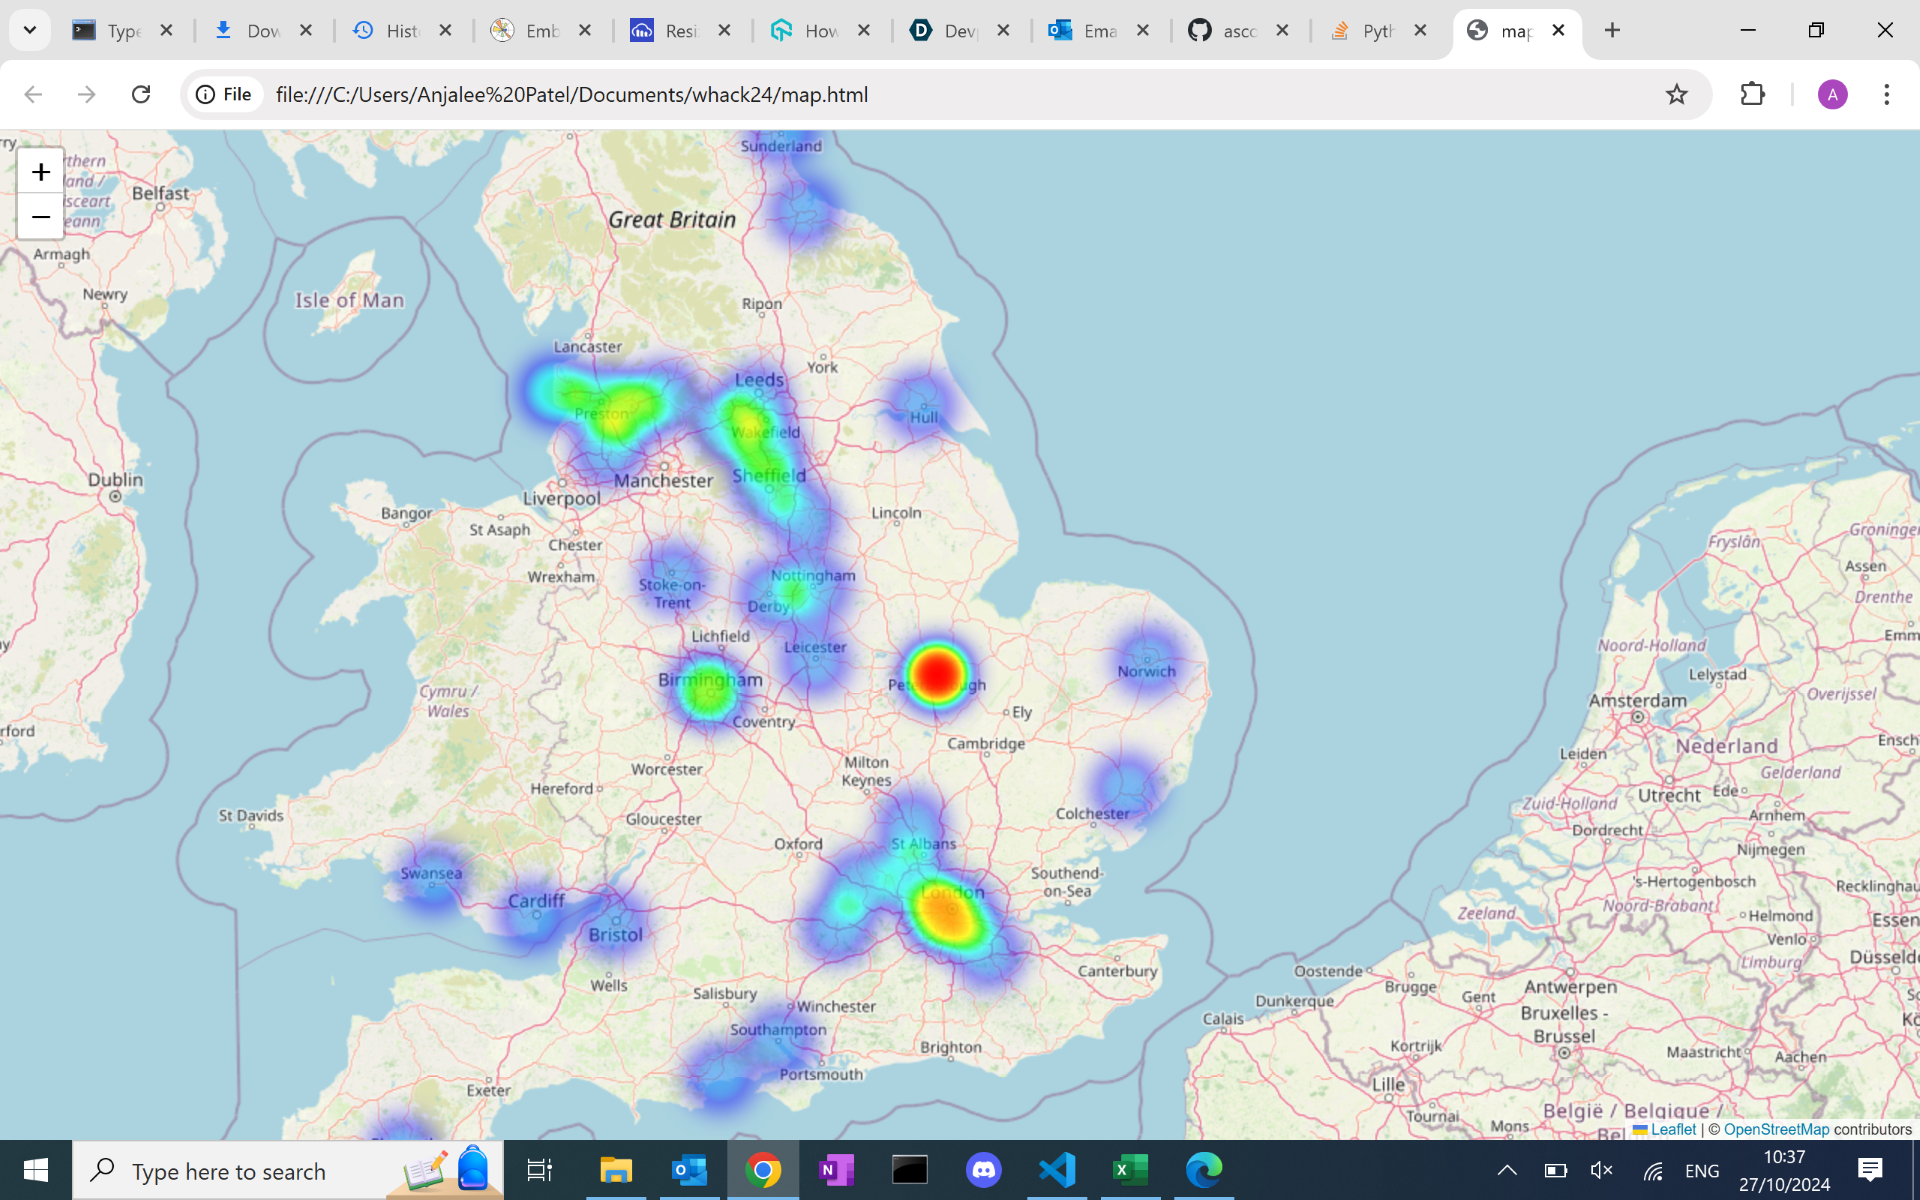
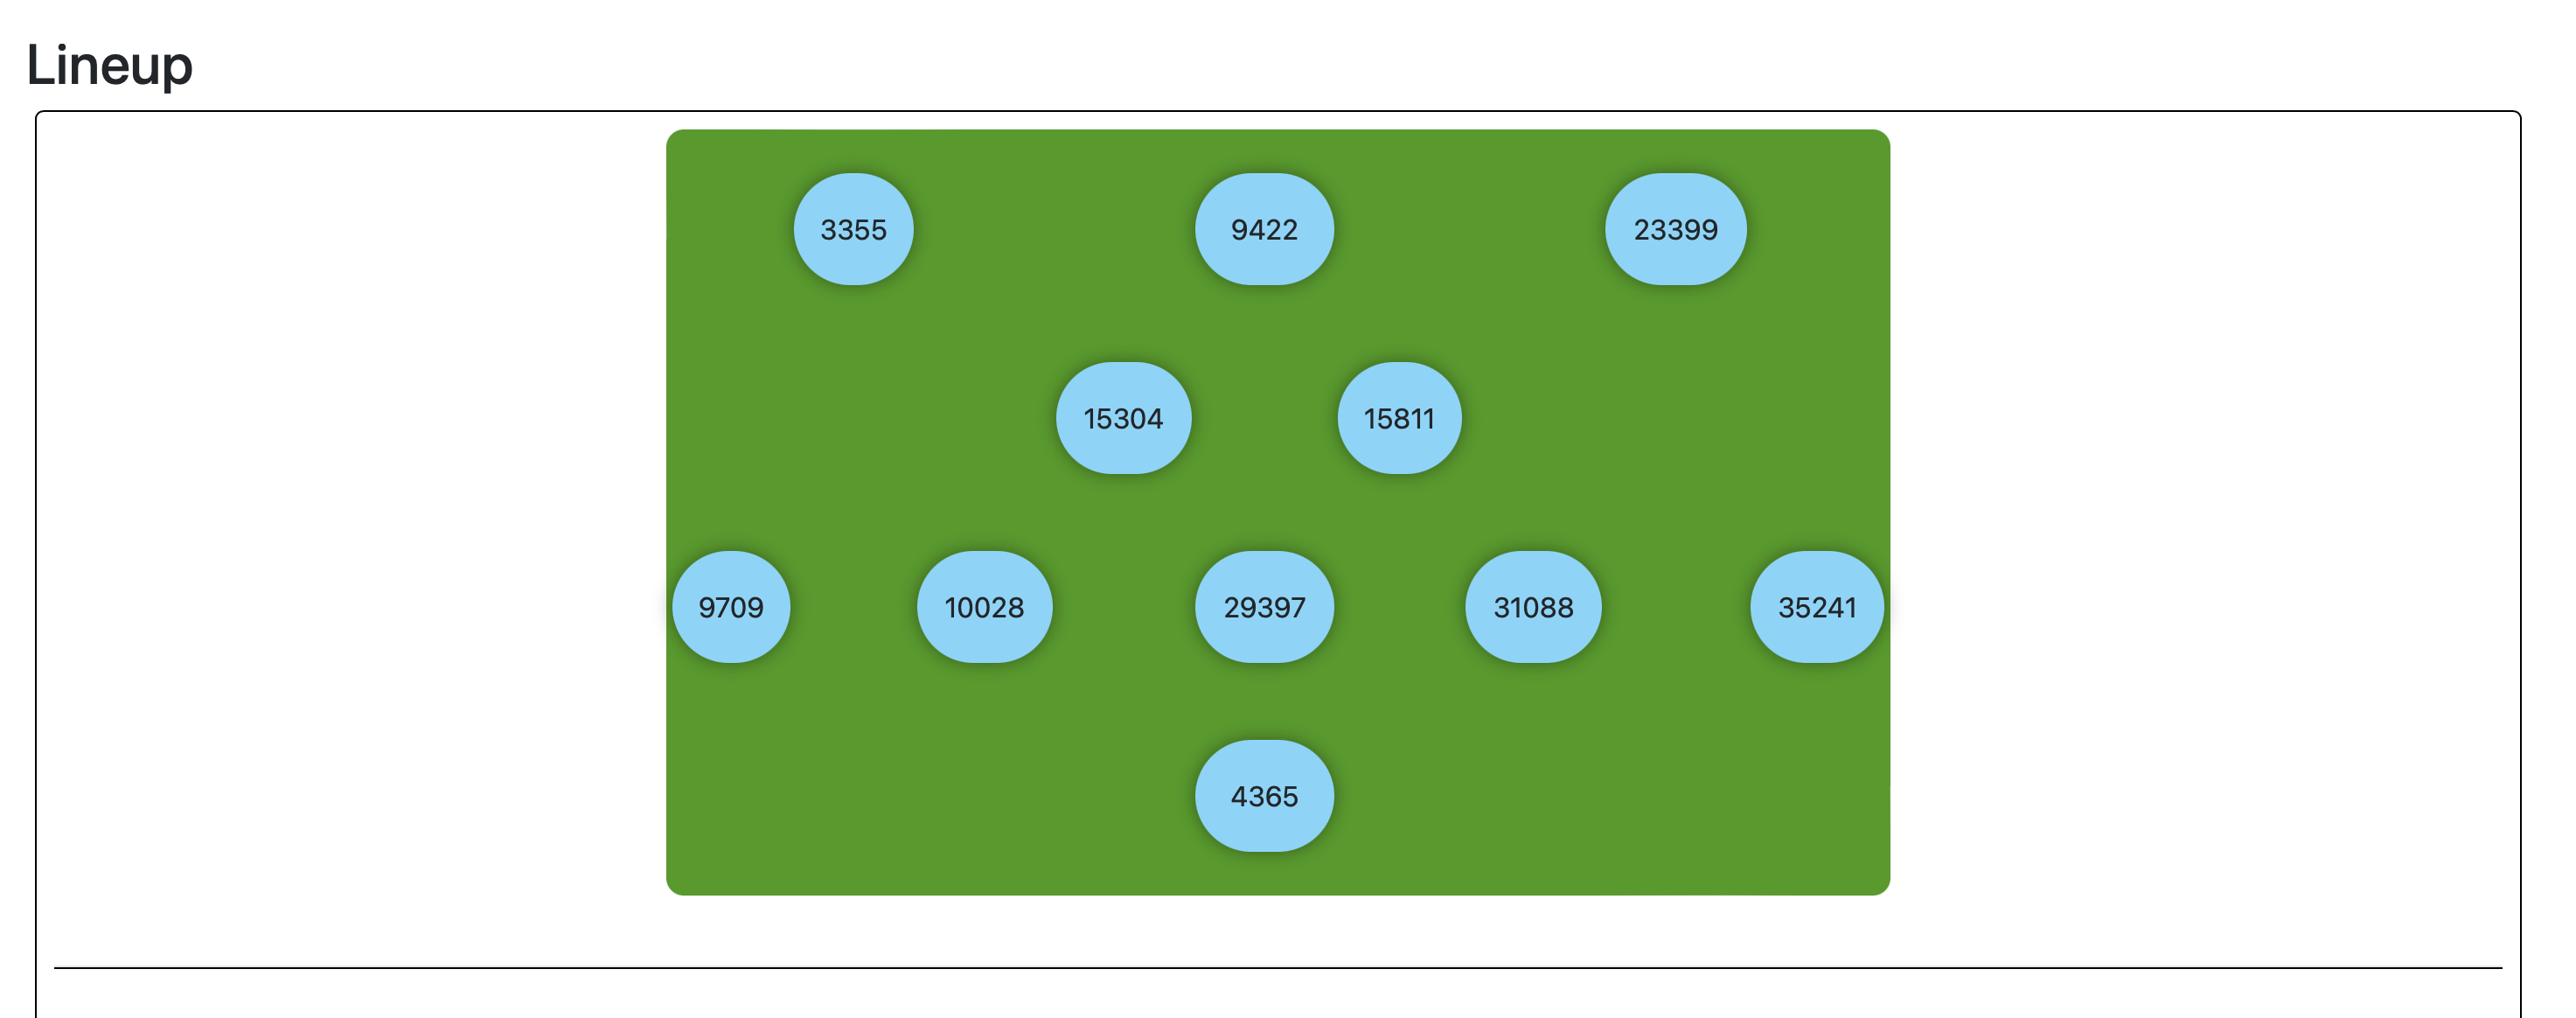
We are proud that we are able to build a pipeline of raw data to stunning visuals. Also the creating unique visualisations for lineups and away game strengths (with a heatmap).
What we learned
Git. Mainly Git. Collabrative programming was a unique experience.

Log in or sign up for Devpost to join the conversation.