Inspiration
We noticed that parking lots already contain valuable signals about store performance, yet most revenue forecasting relies on delayed reports. Our goal was to bridge the gap between real-world traffic and financial insight.
What it does
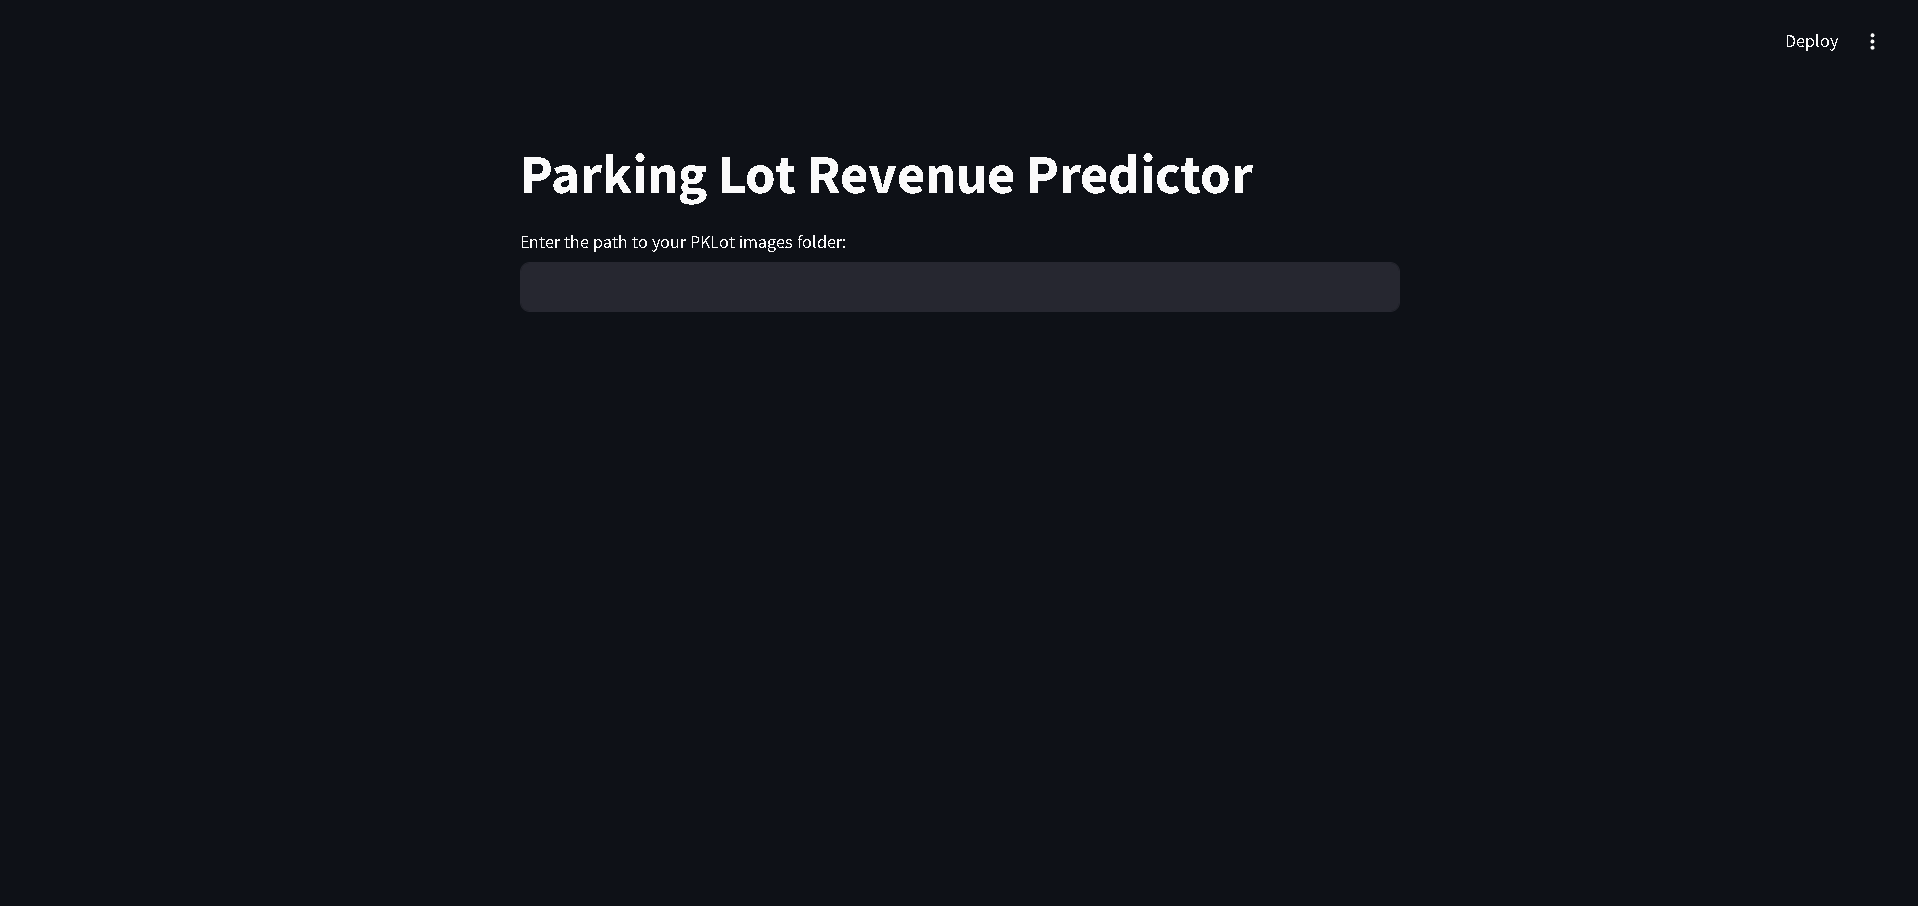
ParkingLotRevenuePredictor takes parking lot images, counts cars using computer vision, and forecasts potential store revenue. It outputs interactive charts and insights through a Streamlit dashboard.
How we built it
We trained on the PKLot dataset to build a lightweight car-counting pipeline. Forecasting models then mapped traffic to revenue. The dashboard was developed in Streamlit, containerized with Docker, and deployed via Hugging Face Spaces.
Challenges we ran into
Managing large image datasets, aligning traffic counts with revenue estimates, and ensuring fast model inference during deployment were major hurdles. We also had to debug Docker/Streamlit deployment issues under time pressure.
Accomplishments that we're proud of
We built a full pipeline—from image input to revenue forecasting—into a working, deployable tool. We also successfully containerized and hosted the project, making it hackathon-ready and easy to demo.
What we learned
We learned how to connect computer vision with revenue forecasting, the tradeoffs of performance vs usability, and best practices for rapid end-to-end deployment in hackathons.
What's next for ParkingLotRevenuePredictor
We plan to expand to real-time CCTV/IoT parking feeds, integrate macroeconomic data for more accurate forecasting, and develop APIs so retailers and investors can easily plug the tool into their analytics workflows.
Built With
- huggingfaceopenspace
- numpy
- opencv
- pandas
- python
- scikit-learn

Log in or sign up for Devpost to join the conversation.