-
-
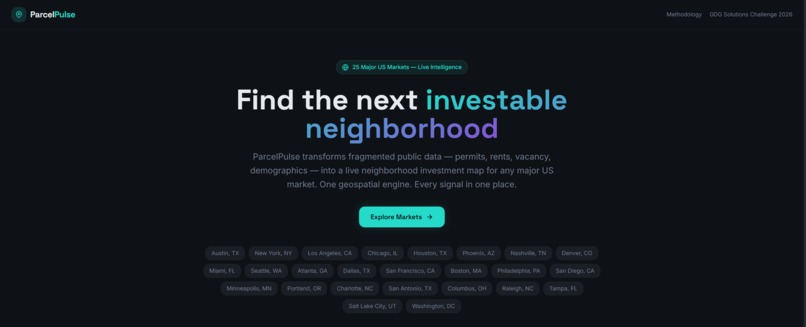
ParcelPulse Landing Page
-
Thumbnail
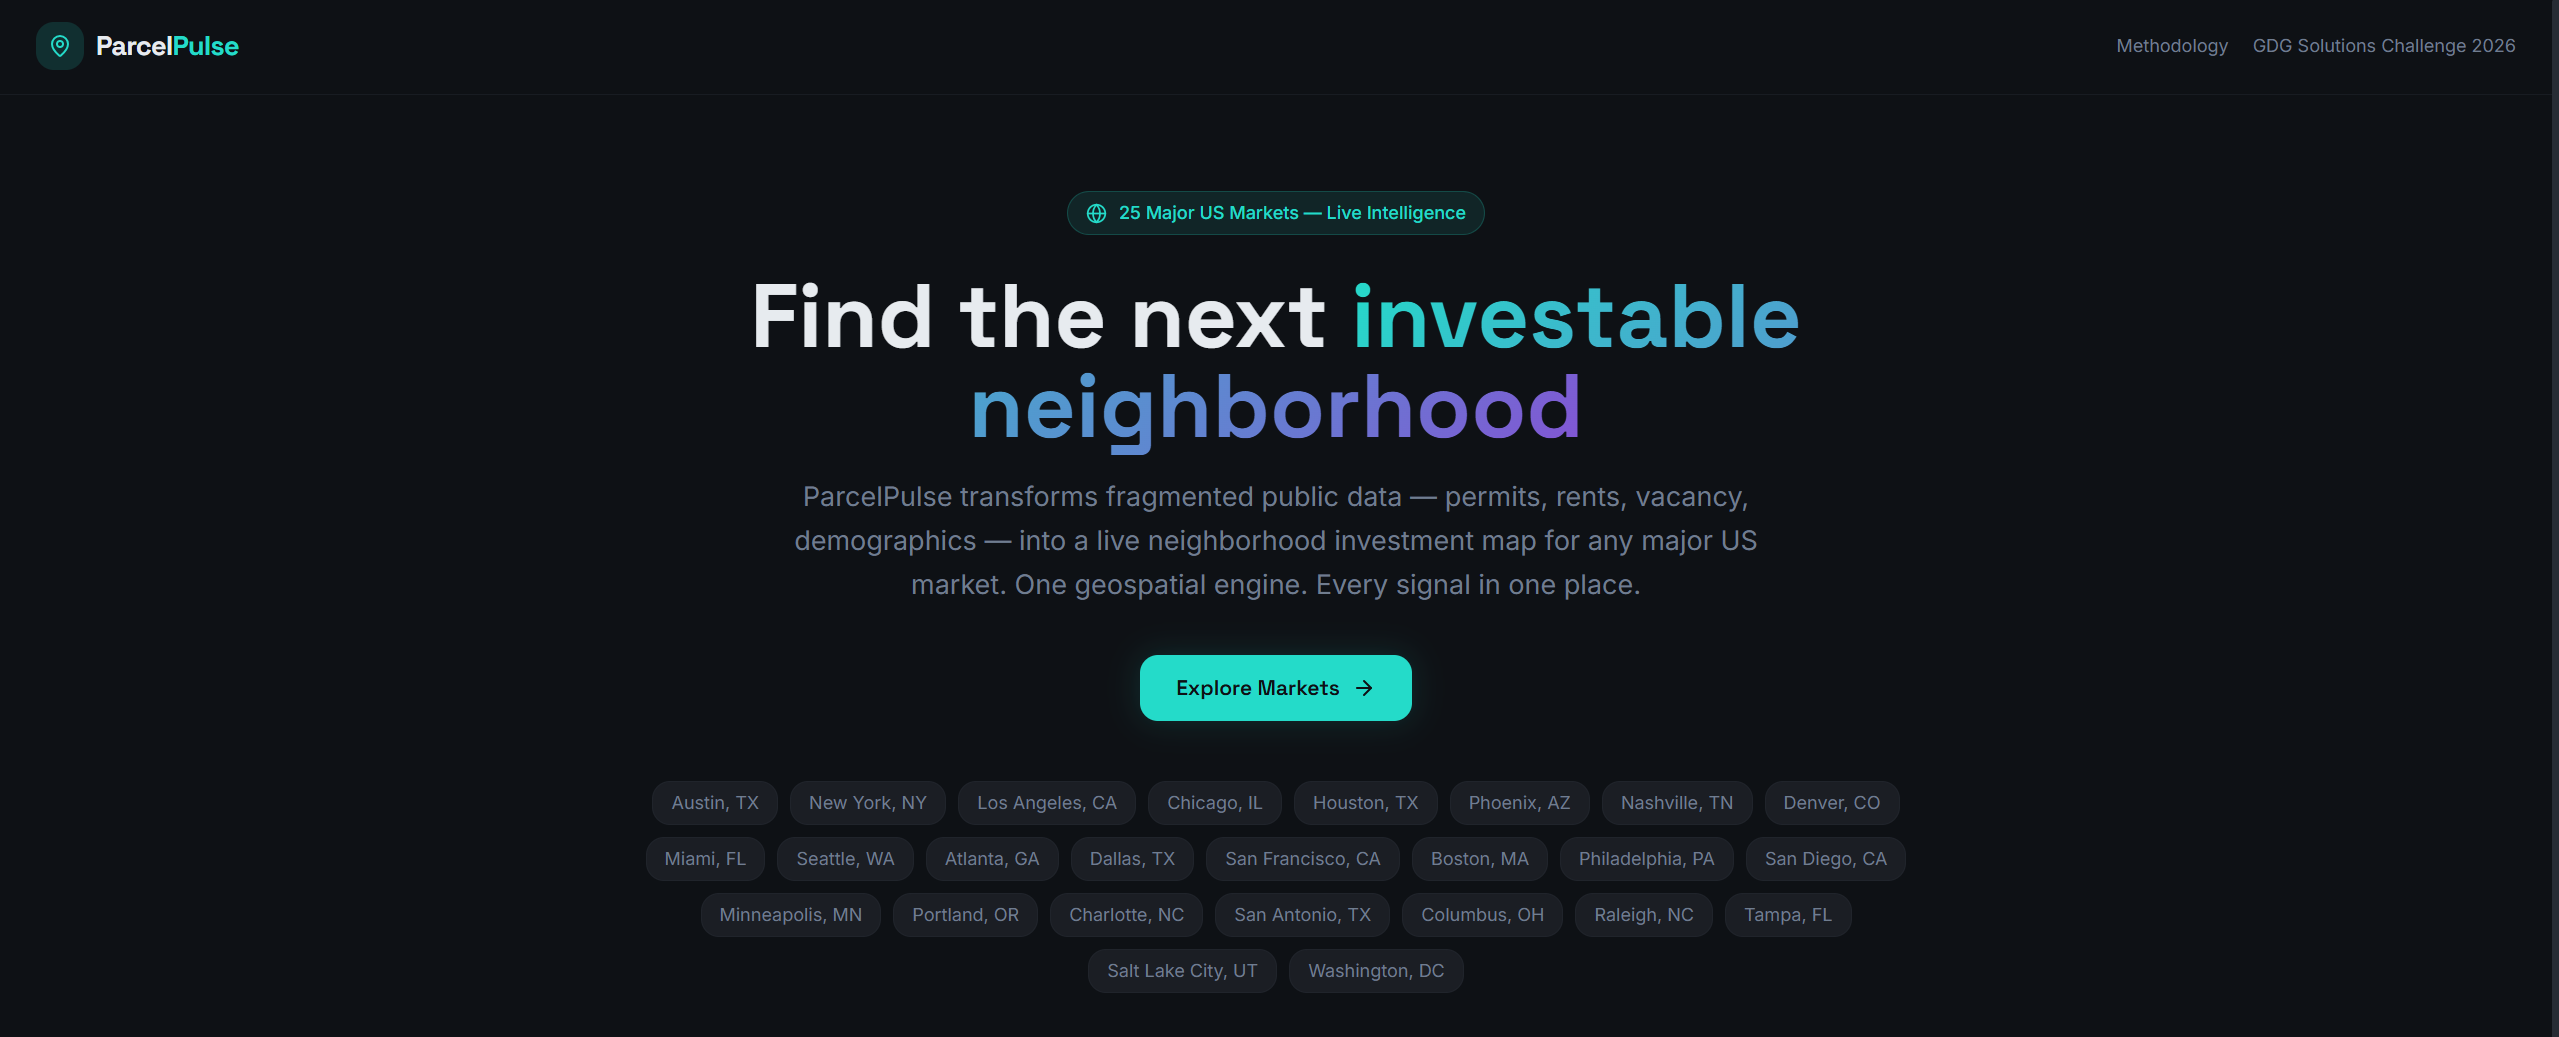
Turning fragmented public data into instant neighborhood intelligence
Real estate developers and analysts waste 40+ hours per market pulling data from Census, HUD, permit databases, Zillow, and BLS — all in different formats, different timelines, different geographies. By the time the picture comes together, the opportunity has moved.
We're Team 4 and we built ParcelPulse to fix that.
What we built
A single geospatial engine that ingests, normalizes, and visualizes real estate market data across 25 US cities — on a live map, in one click.
The dashboard
Six KPI cards surface the metrics that matter most: rent, vacancy, permits, jobs, migration, and income. Three of them pull live Census ACS data, flagged with a green "Live" badge. Below, a Google Maps heatmap overlays demand density and color-codes submarket boundaries by performance. Click any zone and a popup surfaces rent, vacancy, and growth for that submarket. A Gemini 2.5 Flash-powered AI Insights panel generates market summaries grounded in the actual data — no hallucinated generalities, just synthesis of what's on screen.
The neighborhood explorer
Every polygon on the map is scored 0–100 on Development Readiness — a weighted composite of five dimensions:
$$\text{Score} = w_1 \cdot \text{Supply Momentum} + w_2 \cdot \text{Rent Resilience} + w_3 \cdot \text{Demand Demographics} + w_4 \cdot \text{Vacancy Health} + w_5 \cdot \text{Labor Context}$$
Click any neighborhood and the detail panel opens: score breakdown, live KPIs, a Google Street View embed, and amenity density heatmaps via Google Places API — schools, transit, dining, all scored.
We also integrated Google Earth Engine for satellite imagery and NDVI (Normalized Difference Vegetation Index). Declining greenery is a surprisingly reliable early signal of active construction and neighborhood turnover.
$$\text{NDVI} = \frac{\text{NIR} - \text{Red}}{\text{NIR} + \text{Red}}$$
Finally, a TensorFlow.js model runs entirely in-browser — no data ever leaves the device — predicting rent and vacancy 12 months out. Gemini then synthesizes everything into a structured investment brief: opportunities, risks, and supporting signals.
Scale
The market engine is fully dynamic. Switch to any of the 25 cities — NYC, Nashville, Denver, Miami, Seattle, and more — and new neighborhoods, new scores, and new data render on the fly. No pre-built city datasets. Everything is generated at runtime.
How we built it
src/data/markets-registry.ts— seed coordinates and metrics for all 25 cities (8–14 neighborhoods each)src/data/market-engine.ts— the generic engine that generates neighborhoods, permits, time series, and scores for any market- Explorer components accept
neighborhoodsas props, fully decoupled from any city-specific import - Market switching via
?market=URL param with graceful first-load fallback - Zero TypeScript errors across the full codebase
What we learned
Scaling from one city to 25 exposed assumptions baked into the original Austin-only model. Walkability in Manhattan and walkability in Phoenix aren't the same thing. We solved this with market-relative normalization — every metric is scored against the distribution within that city, not a national absolute. Building a truly generic engine forced us to think in distributions, not hardcoded thresholds.
We also learned that running ML inference in-browser with TensorFlow.js is more viable than we expected — the privacy tradeoff (data never leaves the device) is a real product advantage, not just a talking point.
Challenges
The biggest challenge was the component refactor. Explorer views originally imported Austin data directly — pulling that coupling out and threading neighborhoods as props through the component tree touched nearly every file. The other hard problem was making the Gemini integration feel grounded rather than generic. Prompting it with the actual numeric KPIs in context, rather than just city names, was the key to getting useful output.
What's next
Pilot partnerships with proptech and real estate investment firms to validate the Development Readiness score against real deal outcomes. If our scores correlate with 12-month price appreciation, we have something defensible. The infrastructure is ready — we just need the ground truth data to close the loop.
Built With
- census-acs-api
- gemini-2.5-flash-(vertex-ai)
- google-earth-engine
- google-maps-javascript-api
- google-places
- google-street-view-api
- googlefonts
- next.js
- react
- tailwind-css
- tensorflow.js
- typescript

Log in or sign up for Devpost to join the conversation.