Inspiration
We wanted to give title and underwriting teams a clearer view of property risk before closing. Static reports and PDFs make it difficult to understand how flood zones, easements, climate exposure, and financial risk actually sit on a parcel. ParcelIQ was inspired by the need for spatial intelligence — turning addresses into an interactive, map-based property intelligence engine where users can move around a property and see contextual risk overlays tied directly to the land.
Instead of reading disconnected data points, users can visualize risk, understand financial impact, and receive AI-powered explanations — all in one unified interface.
What it does
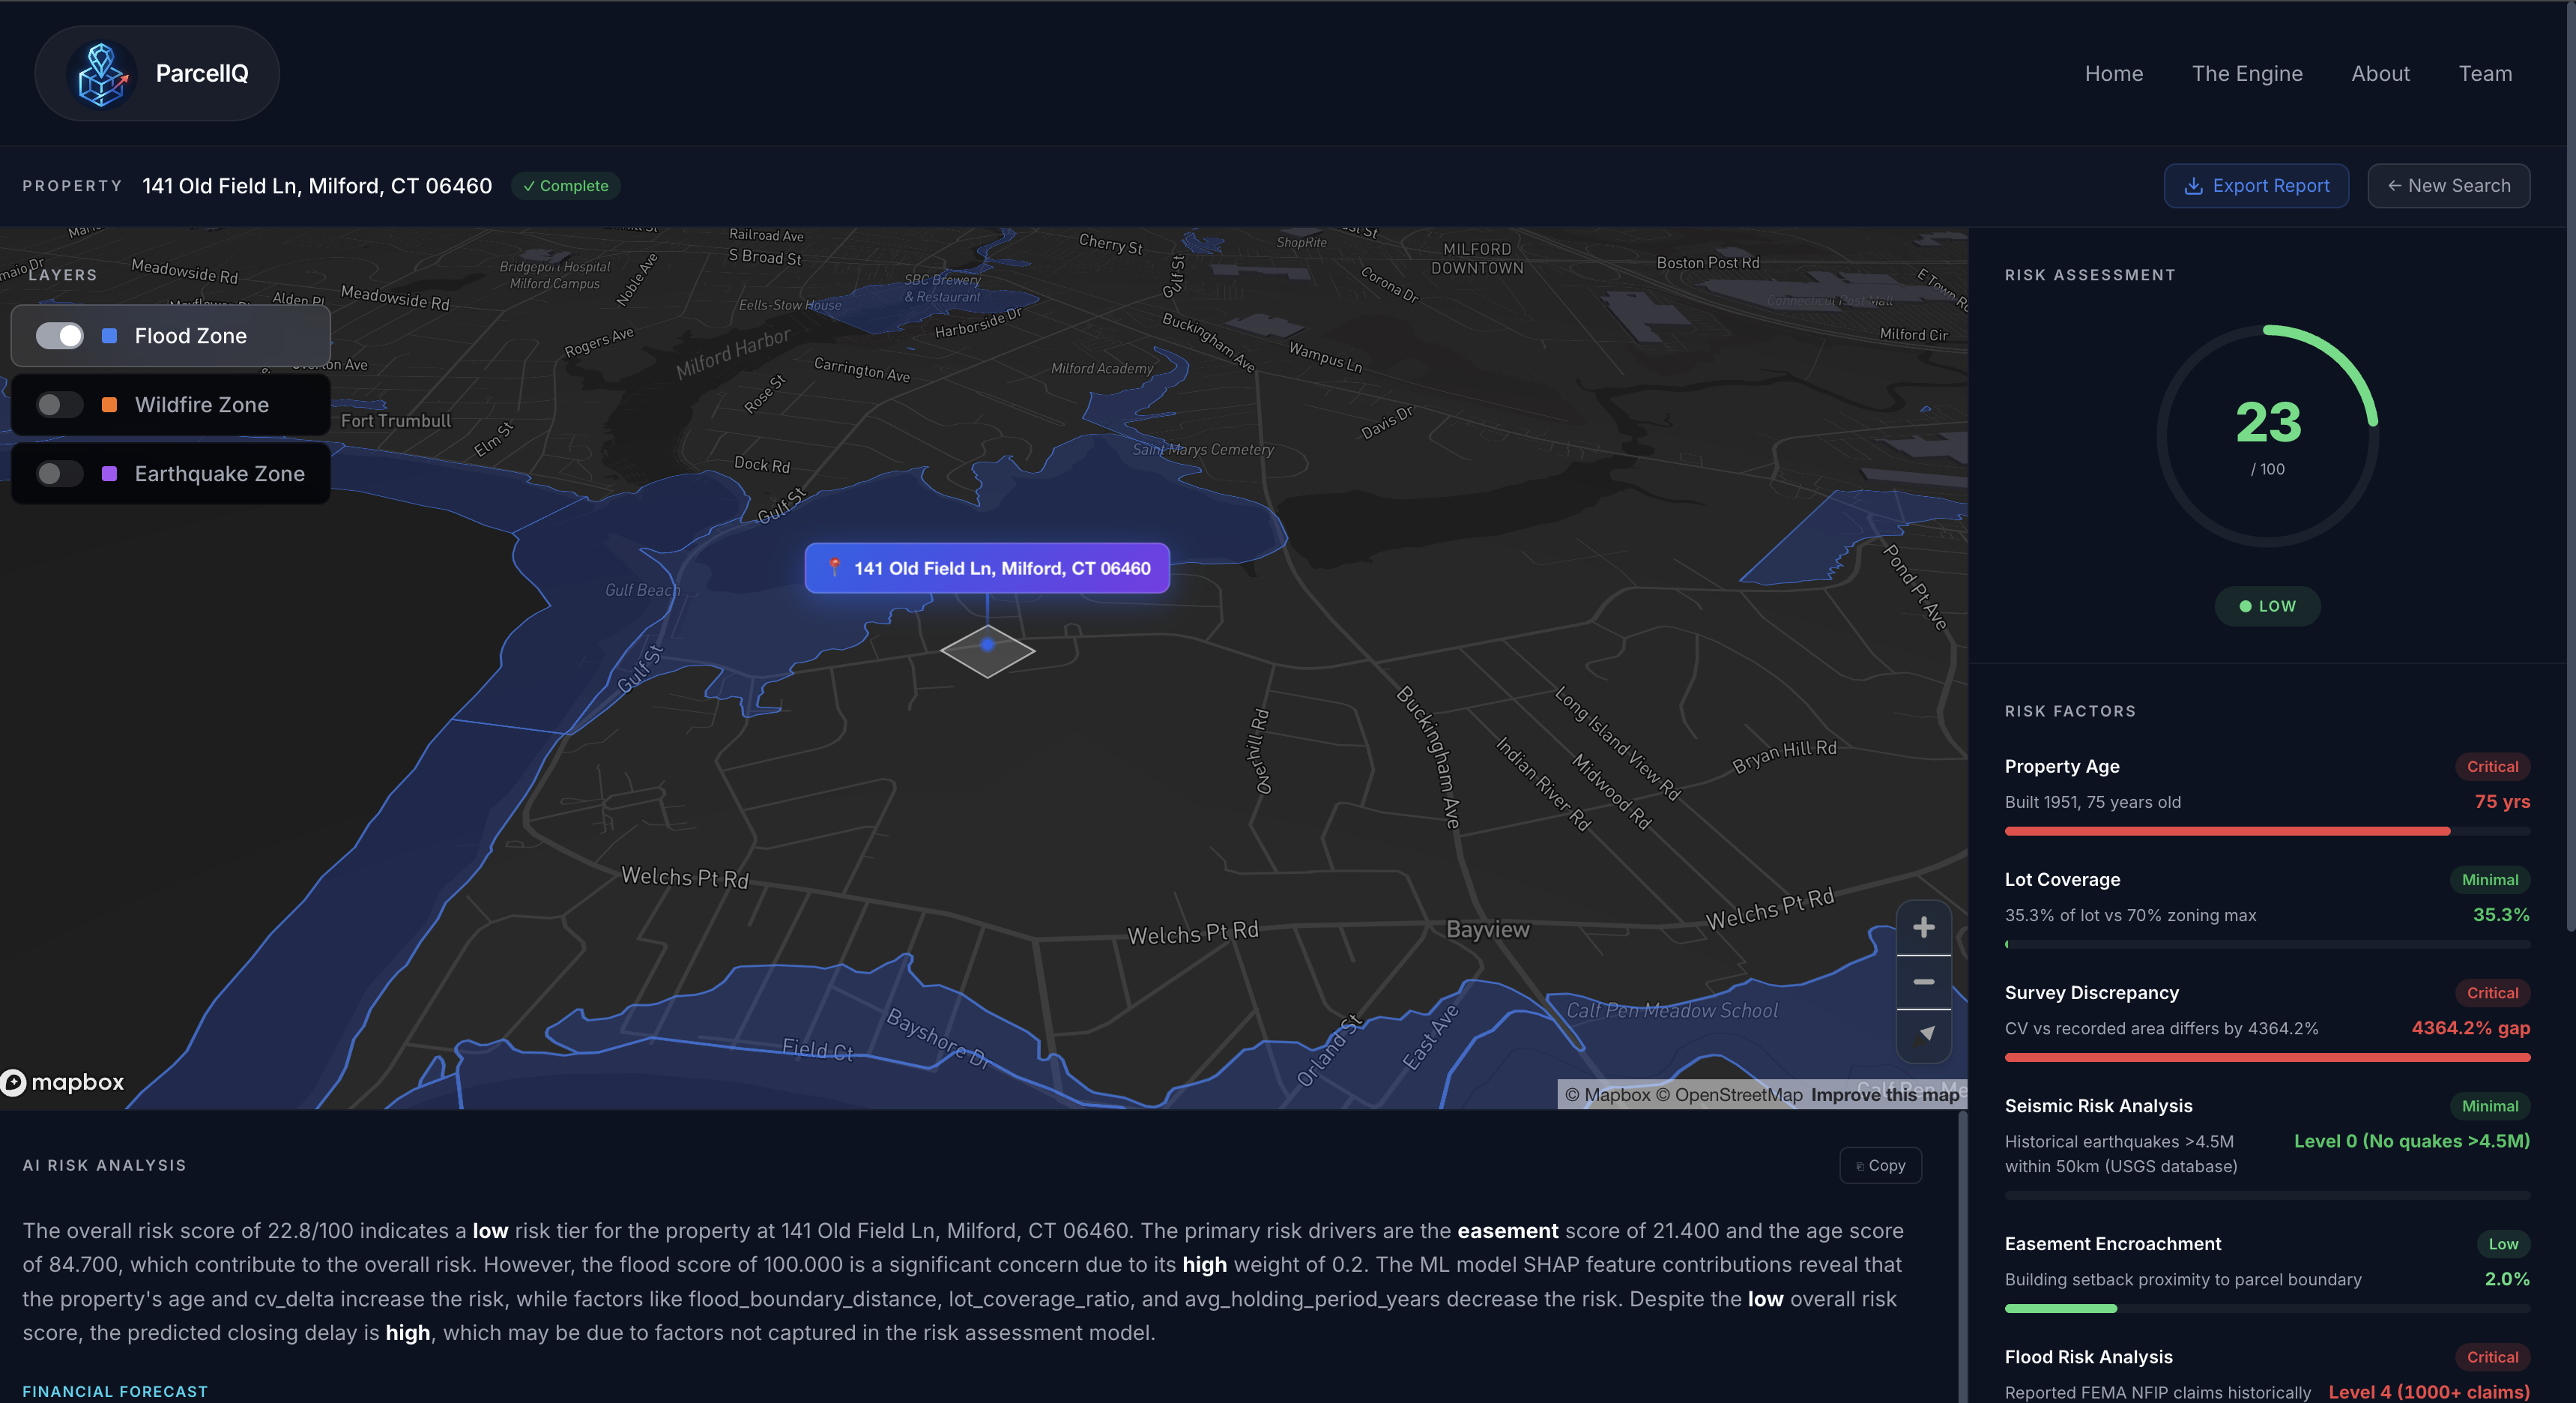
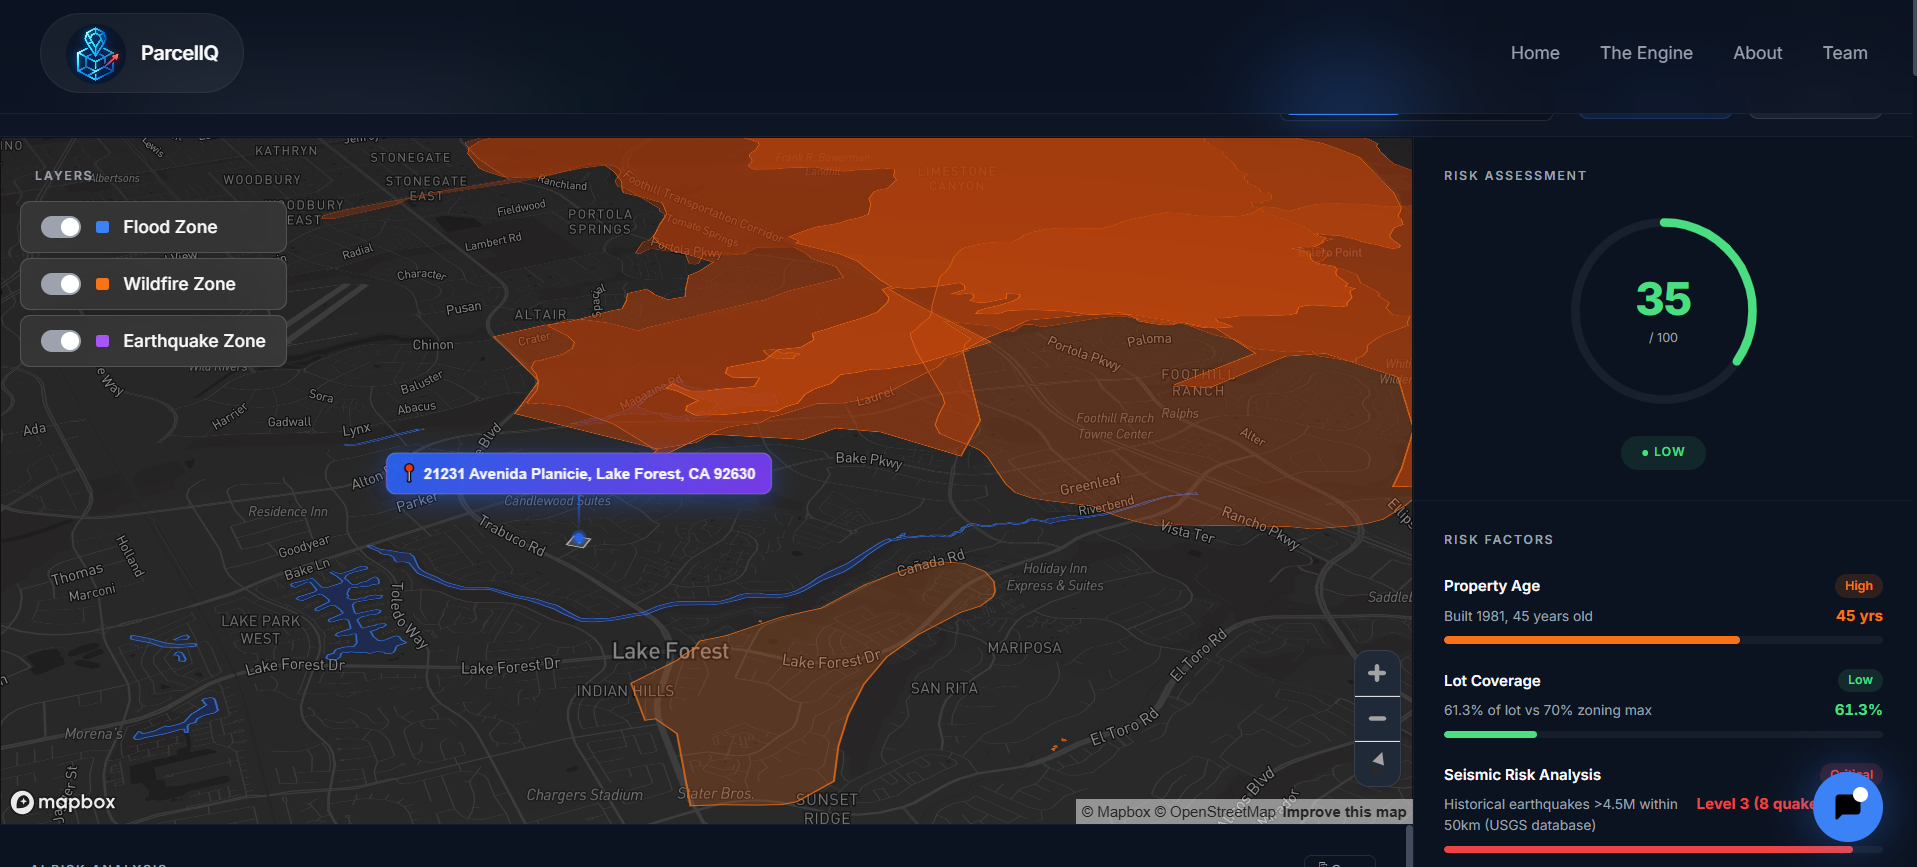
ParcelIQ is a spatial property risk intelligence engine. Users enter an address on the landing page and receive an AI-powered analysis that includes an interactive 3D Mapbox map with toggleable layers (flood, wildfire, earthquake, easements, building footprint), a financial risk dashboard, contextual spatial overlays, and an AI-generated summary.
Users can navigate around the property (Google Maps–style) and see floating overlays anchored to specific areas of the parcel. Clicking on a risk zone reveals financial projections, insurance impact estimates, projected value adjustments, and mitigation insights.
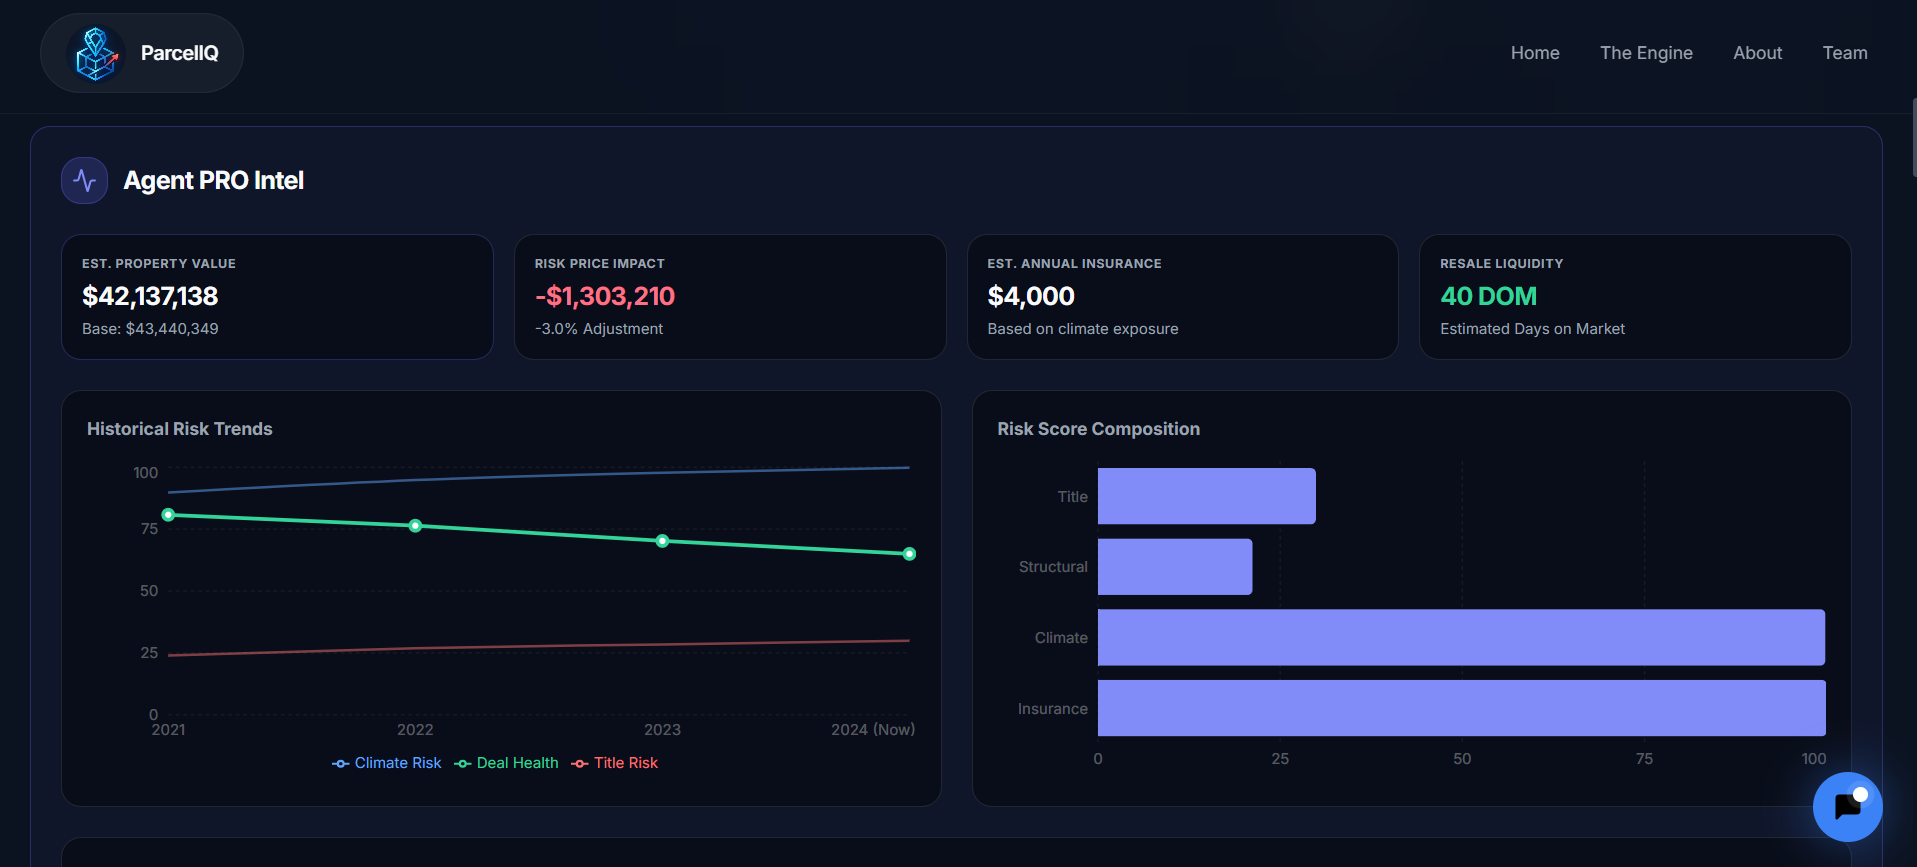
The dashboard includes:
- Risk score breakdown (weighted scoring with optional ML model fallback)
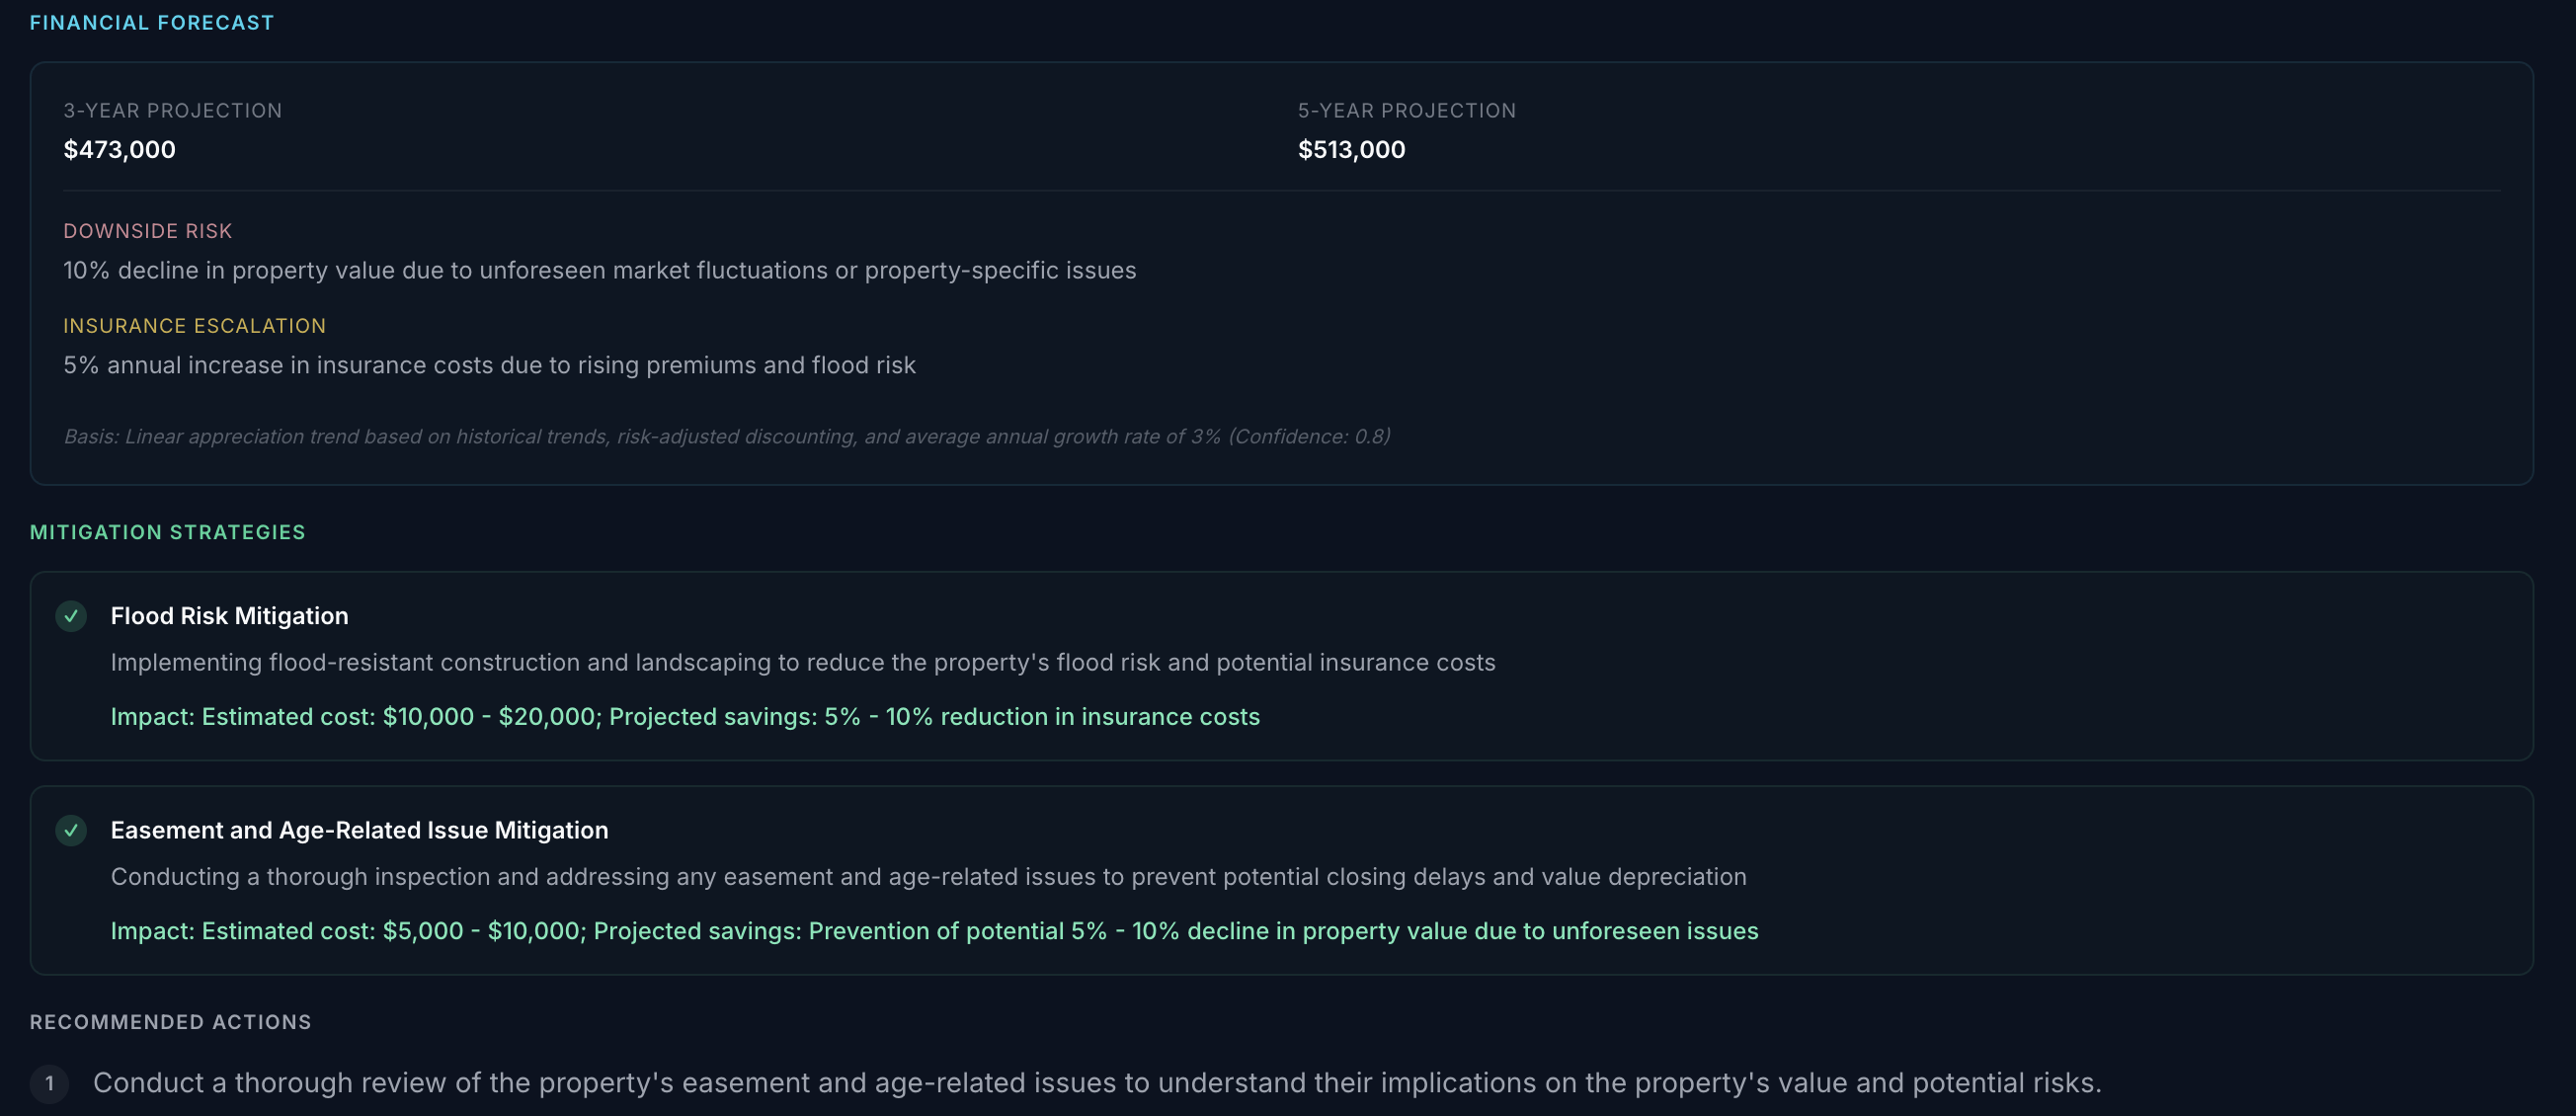
- Financial impact modeling (insurance shifts, projected value changes, liquidity outlook)
- Lot coverage estimation using OpenCV
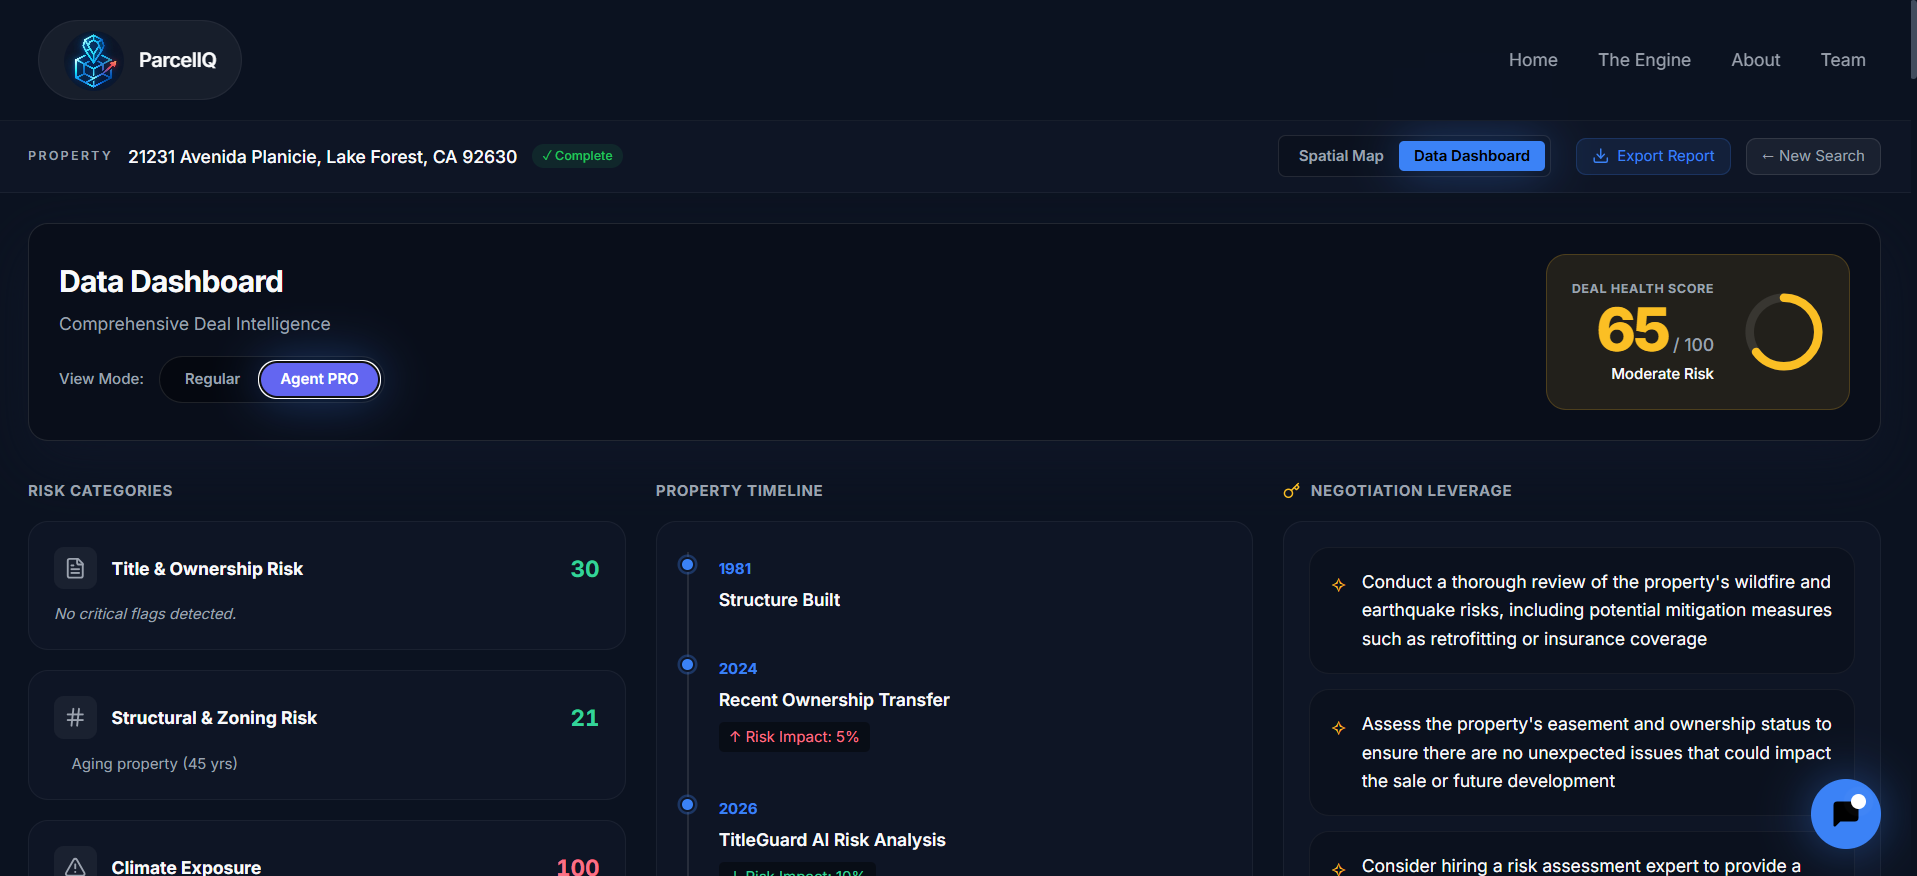
- Deal Health score
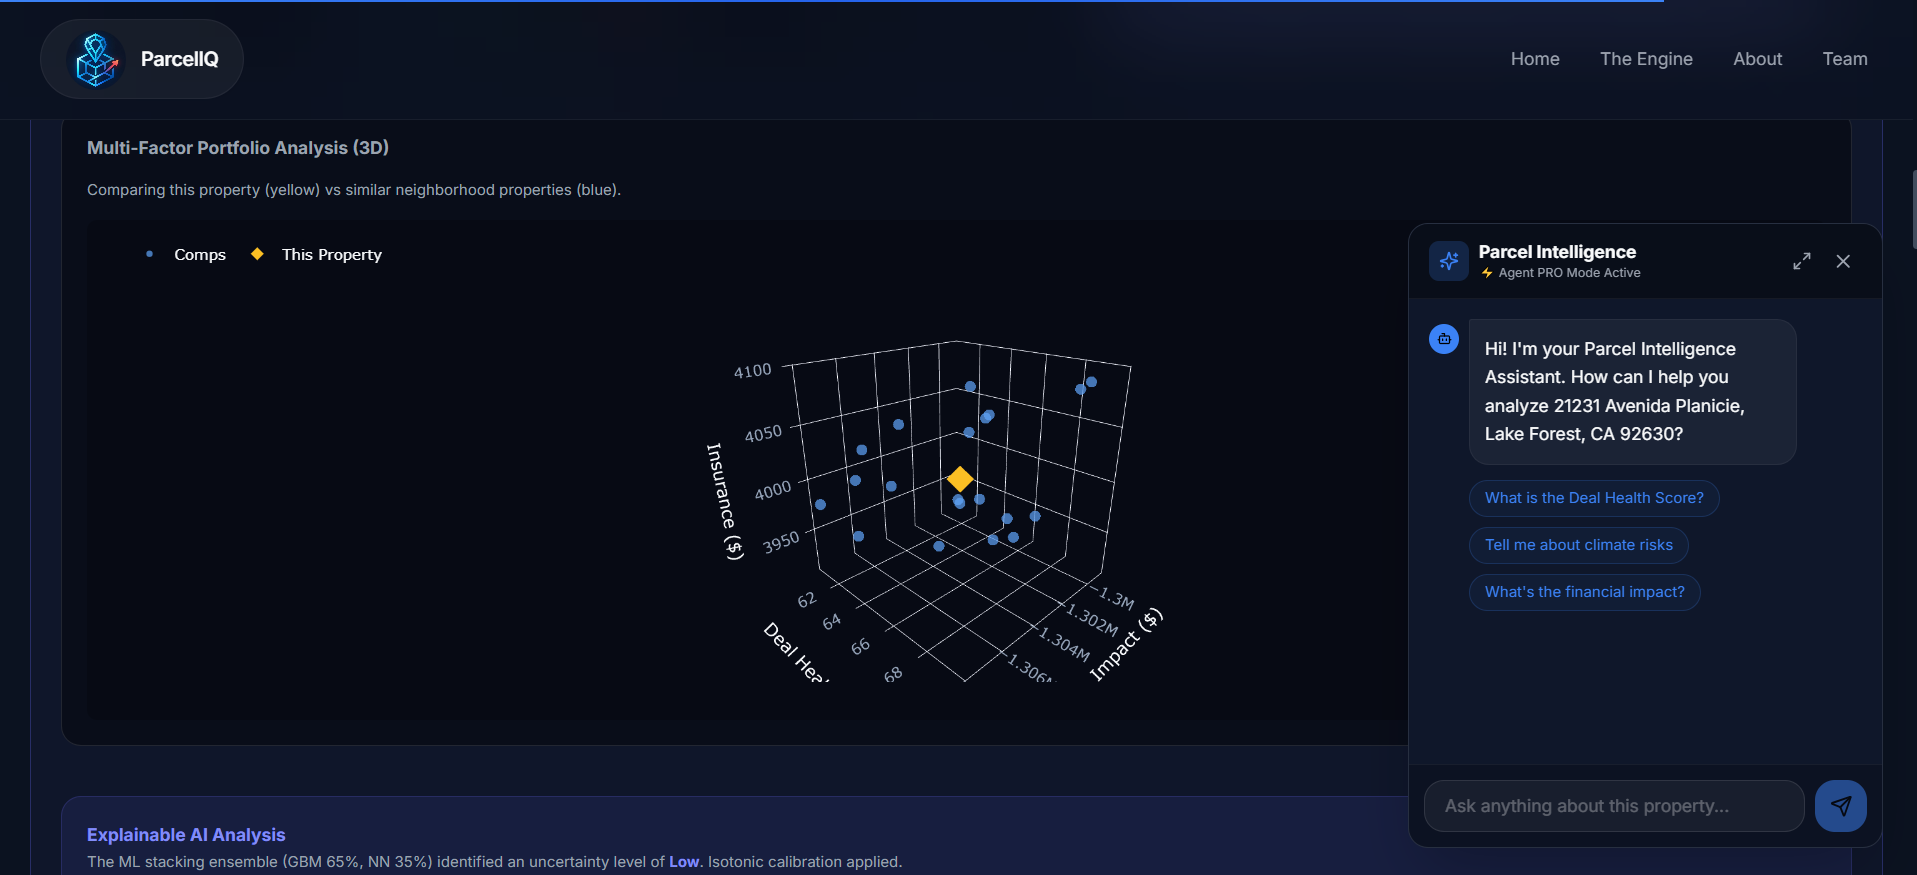
- Comparative neighborhood risk insights
- Interactive 2D visualizations for risk and financial metrics
ParcelIQ also includes an integrated AI Chat Assistant in an expandable pop-up window. Users can ask questions about the property, and the assistant references live dashboard data to provide clear explanations. It supports both Agent Mode (technical insights) and Regular Mode (simplified explanations), and it gracefully handles missing data by clearly stating limitations.
The platform generates a multi-page downloadable PDF that consolidates spatial maps, dashboard metrics, AI risk summaries, financial projections, and actionable recommendations into a structured property intelligence report.
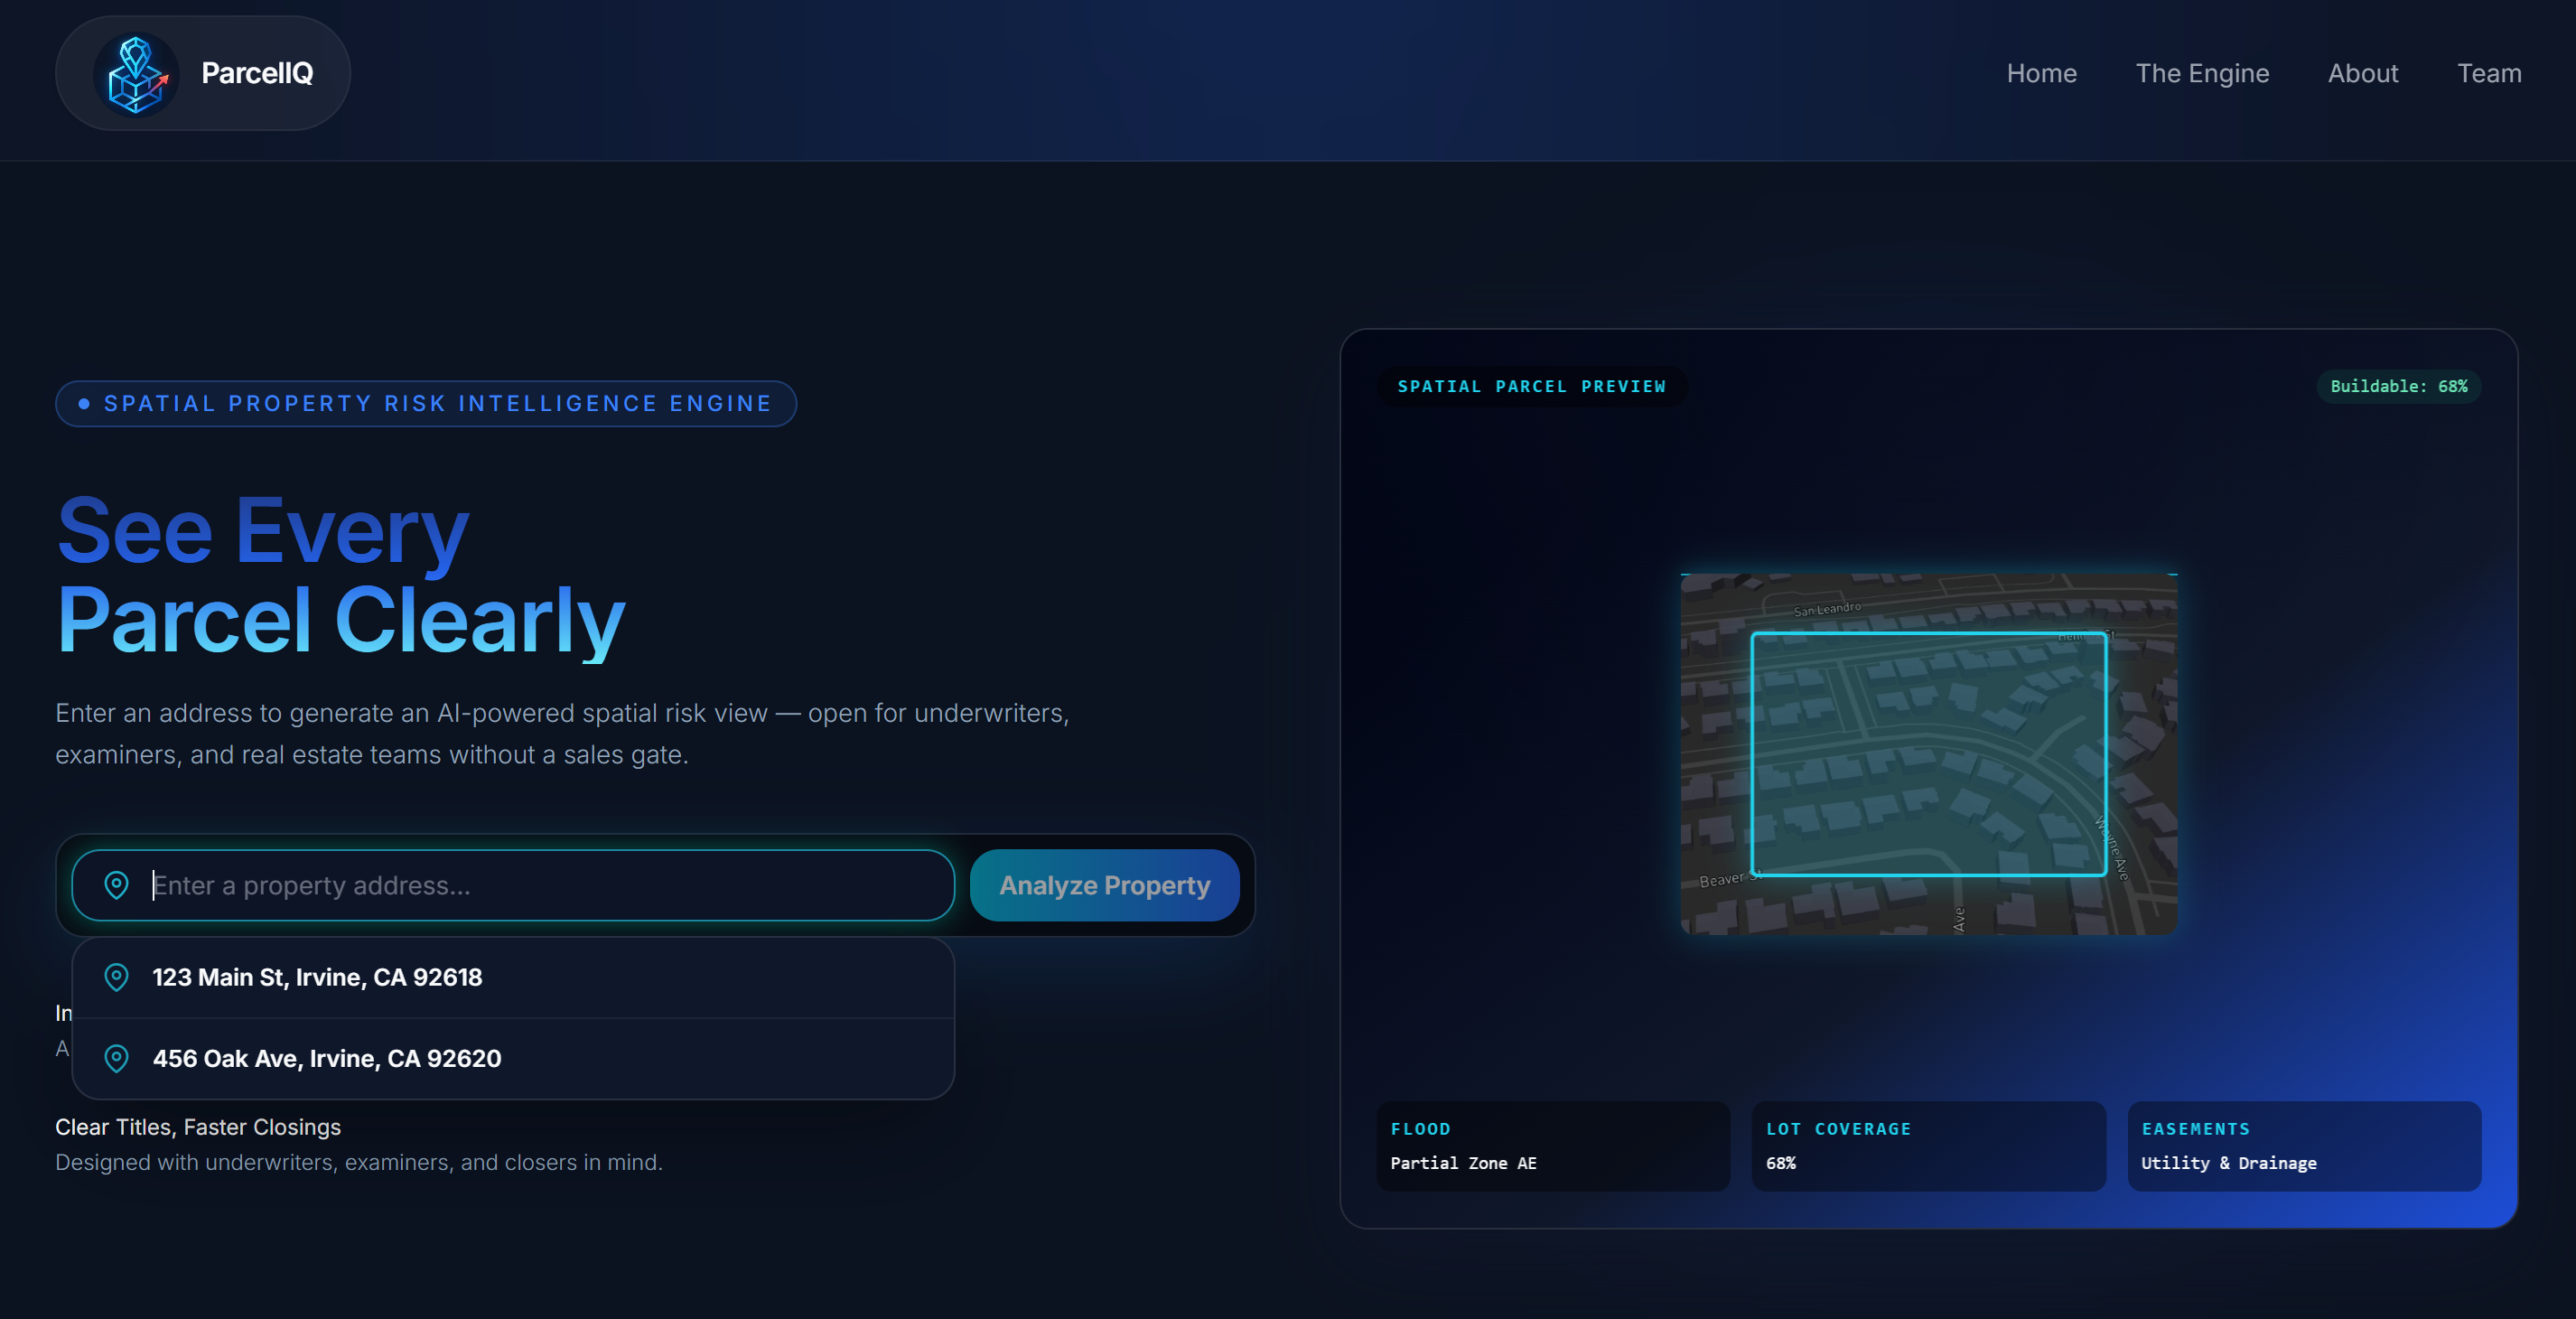
The public site includes an address search, spatial parcel preview, product overview, insights section, outcomes metrics, security section, and a Meet the Team — all designed to explain the product and invite users to analyze an address.
How we built it
Frontend: React (Vite) with Tailwind CSS and Framer Motion. The landing page includes address autocomplete, a spatial parcel preview (map image + “parcel being analyzed” overlay), product tabs, insights flip cards, outcomes grid with CountUp metrics, security & compliance cards, and a team section with hover-reveal overlays.
The dashboard integrates:
- A 3D Mapbox GL JS viewer with extruded buildings
- Toggleable spatial risk layers and heatmaps
- Contextual floating overlays anchored to parcel zones
- A synchronized financial and risk data sidebar
- An expandable AI chat window
- Agent vs Regular Mode interface logic
Interactive charts display financial and risk metrics, and all components are synchronized through structured backend responses.
Backend:Flask (Python) with CORS. The API handles full property analysis: geocoding, parcel lookup, lot coverage detection (OpenCV), risk scoring (weighted factors with optional ML models), financial impact modeling, and AI-generated summaries via Groq. Configuration is loaded from a root .env file (Mapbox, Groq, etc.).
The backend returns structured JSON that powers:
- Map overlays
- Risk dashboard metrics
- AI chatbot context
- PDF report generation
Map: Mapbox GL JS powers the 3D spatial viewer, including parcel outlines, flood/wildfire/earthquake layers, heatmaps, and interactive overlays. Users can move around the property to see risk visualized directly in geographic context.
Challenges we ran into
- Backend startup: Cached ML models (joblib) were saved under a different NumPy version, causing load failures. We made model loading fault-tolerant so the app runs with weighted-only scoring when the cache is incompatible.
- Layout: Keeping Outcomes, Security, and Team sections readable without crowding. We used a single
max-w-7xlcontainer, consistentpy-12, and placed Meet the Team below Open Access so the flow is clear. - Map preview: Sizing the real map image in the spatial parcel preview so it filled the card without covering the header or the Flood/Lot Coverage/Easements row—we tuned max-width, max-height, and padding.
Accomplishments that we're proud of
- A seamless flow from address entry to interactive spatial intelligence.
- Context-aware overlays that anchor financial consequences directly to physical parcel locations.
- A financial modeling layer that translates risk into projected monetary impact.
- An integrated AI assistant that references live property data.
- A downloadable PDF that consolidates spatial visuals, financial metrics, and AI summaries.
- A cohesive landing page that feels product-ready rather than a prototype.
What we learned
We learned how to wire geocoding, parcel data, and risk scoring into one analyze pipeline, and how to present it with a clear narrative (hero → product → insights → outcomes → security → team). We also refined UI details—flip cards, hover states, and spacing—so the public page feels like a product, not a prototype.
What's next for ParcelIQ
- Real parcel and flood data (e.g. county assessor, FEMA NFHL) instead of mock data.
- Richer AI summaries (streaming, citations) and more explainable risk factors.
- User accounts, saved analyses, and optional integrations with title and underwriting tools.


Log in or sign up for Devpost to join the conversation.