-
-
PaRaNoRmAl DiStRiBuTiOn
-

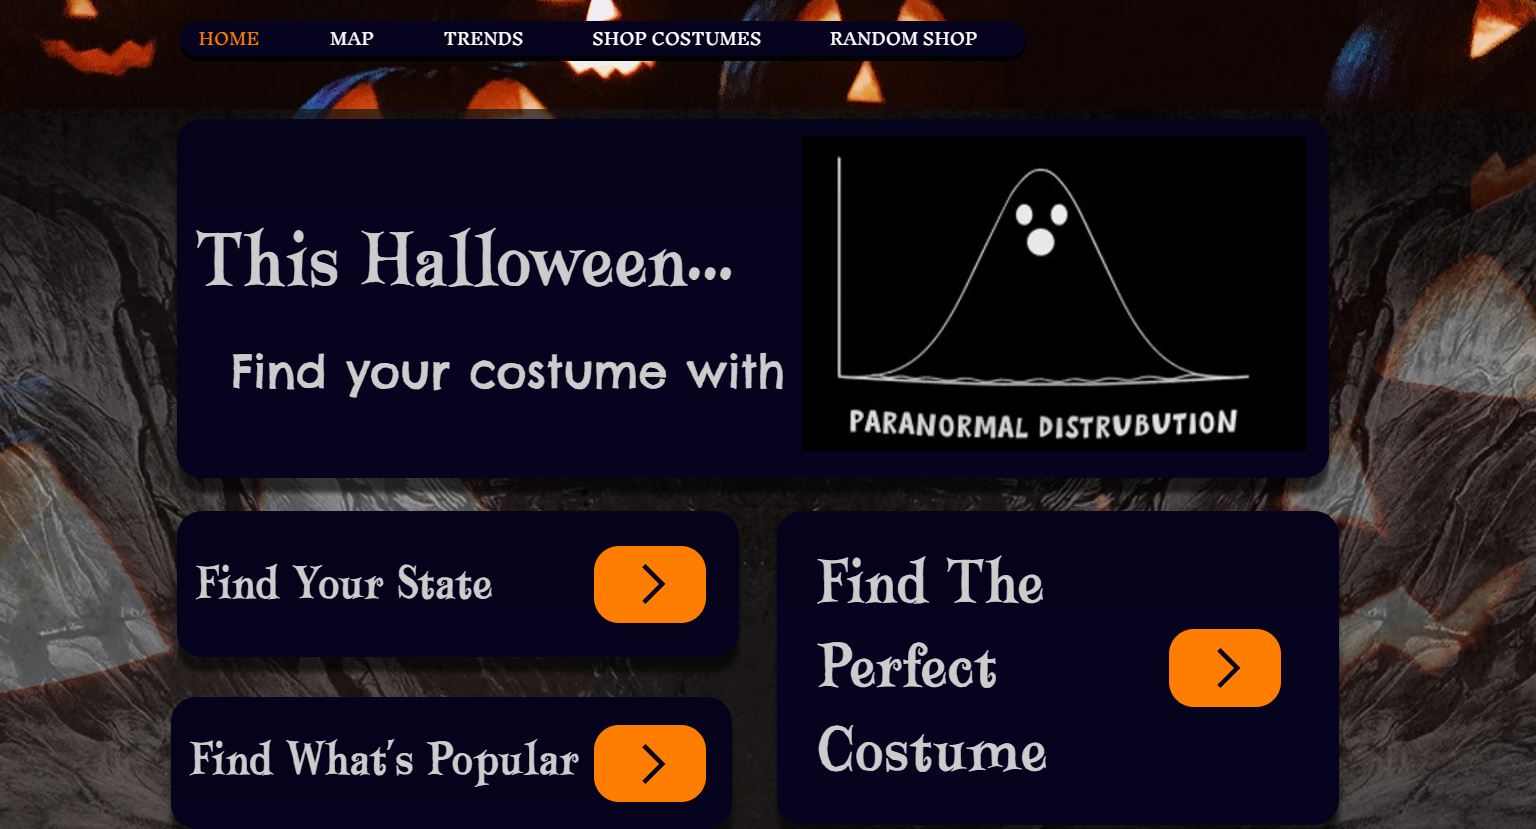
Front page of Paranormal Distribution
-

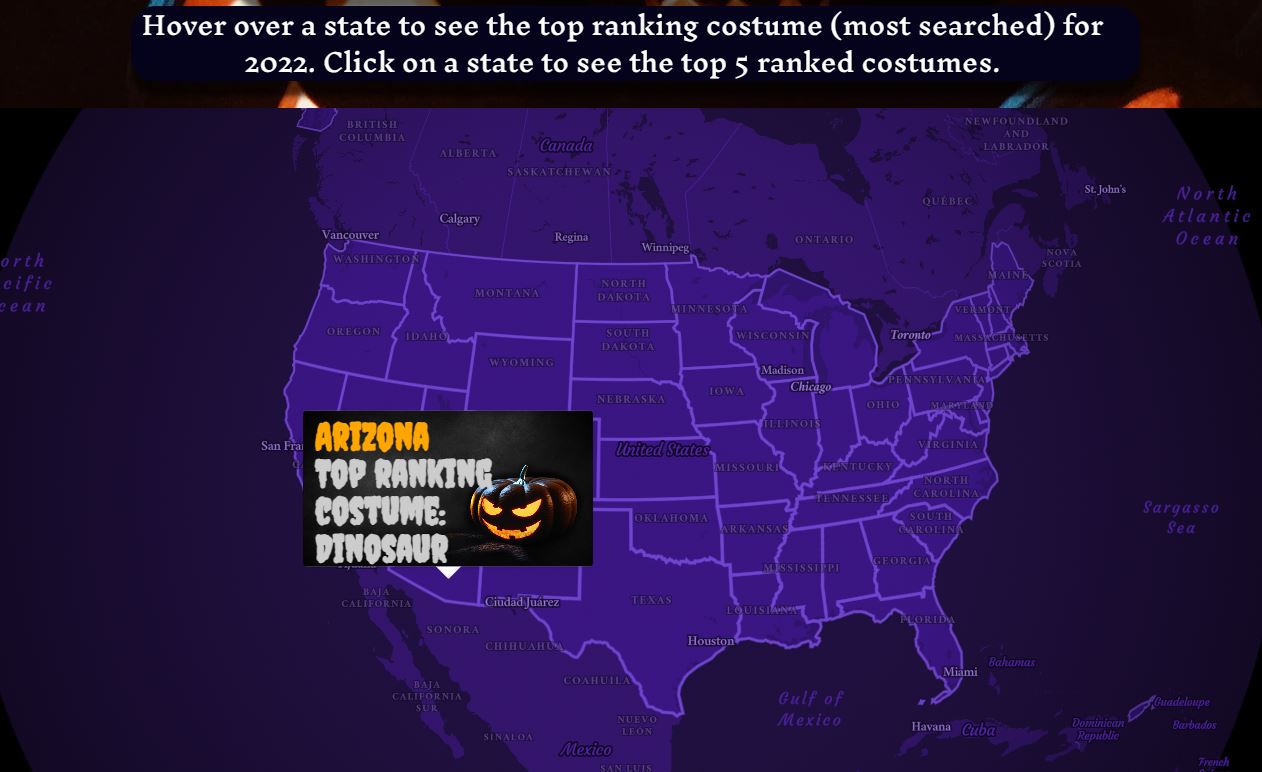
Map visualization that displays the costume rankings for each US state
-

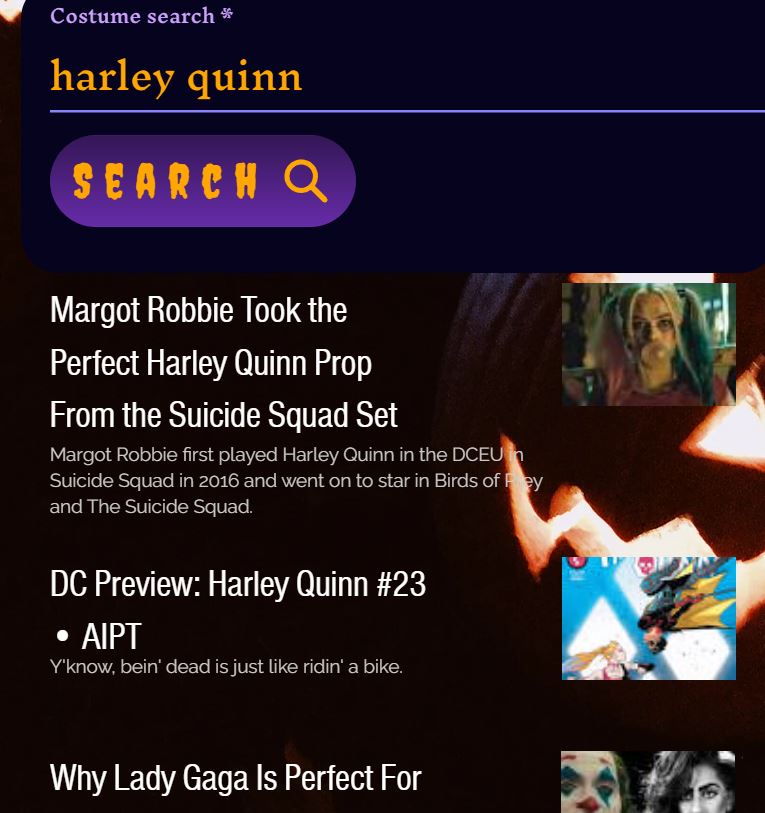
Top news headlines can be fetched for the inputted costume
-
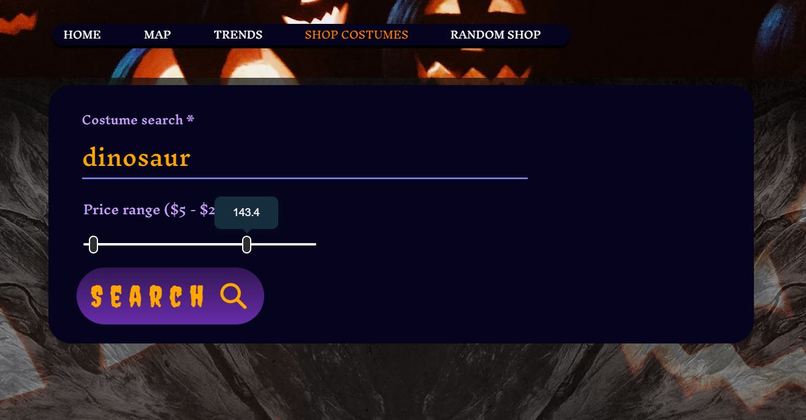
The user can input a costume type and desired price range to search for
-

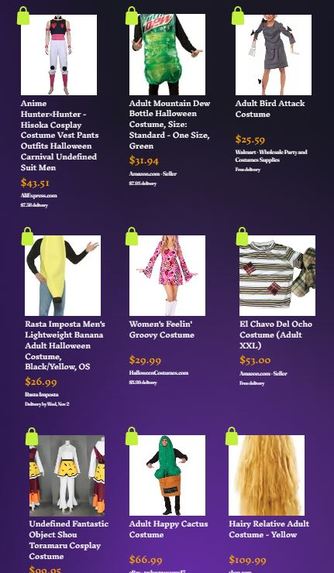
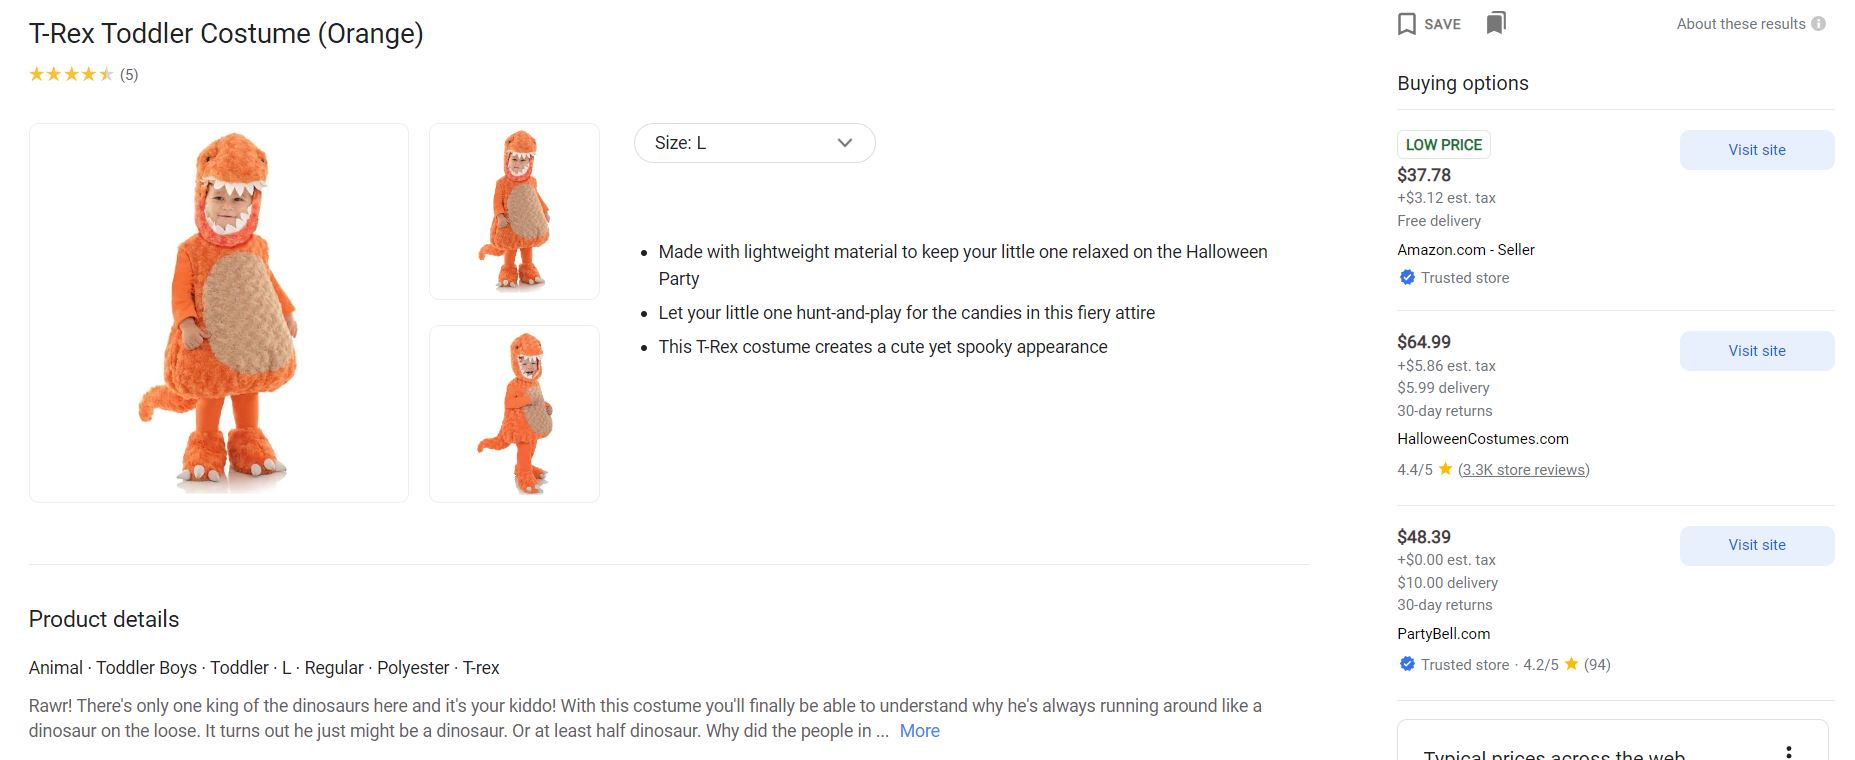
The top shopping results for the queried costume and price range
-

The Google product page linked for each costume listing
-
Random generation of top shopping results
-
 GIF
GIF
JavaScripting custom functionality and data visualization


Inspiration
Reach into the murky depths of your memory and recall 2016...NASA’s Juno spacecraft began orbiting, the Olympics in Rio de Janeiro, Brazil was hosted, and The UK shocked the world upon its departure of the EU... a year of creativity, potential, and the resourcefulness. Wait, recall a little further to around this time of the year... Halloween. Though, seems like your mind is suddenly jolted remembering not all was such an original occurrence -- everyone was dressed as Harley Quinn. Indeed, if you dig deep into the internet archives, you realize that she was the number one trending costume nationally (followed by the Joker at number two and the generic “superhero” at number three) according to search queries. You perhaps know someone (or were that someone) who dressed up as Harley for a party, only to find out you're unintentionally matching with your friends. Isn't there a way to avoid this collective awkwardness? If you wish that you had data beforehand to help you look into the crystal ball of costume turnout, then this application, Paranormal Distribution, is the perfect tool.
What it does
Paranormal Distribution features a range of data-inspired tools and functionalities, such as map visualizations, ranked lists, news lookup, and data scraping, that enable the user to select a fang-tastic costume.
On the front page of the website, the user is greeted with a welcome message and a menu that allows streamlined navigation from page to page. The 10 most popular costumes in the United States, determined based on the volume and distribution of this year’s search queries, are displayed.
The user can navigate to the MAPS section, which displays a visualized ranking of costumes by state. They can hover over any state in the US, and it will reveal a popup containing its most-searched costume. They can then click on any state in the US to see the top 5 costumes for that state in that year. The dataset has been made publicly available by Google, and it was cleaned and processed for this map visualization.
In the TRENDS section, the top trending costumes of the past week in the US can be seen. It is updated live, powered by Google Trends and Search Engine. The interest over time graph for a given costume can be seen here as well. Another useful functionality provided for the user is the ability to search up a few of the top news headlines, updated in real-time, relating to their costume right in the website. It also pulls from real-time data through the use of a SERP (Search Engine Results Page) API, which allows the scaping and analysis of real-time data, and Google News Engine.
Next, after learning about the uniqueness, the user can go to the SHOP COSTUMES tab. They can input a costume type: "witch," for example. They can also specify a desired price range using the range slider and hit search. The website returns to the user top shopping results for that kind of costume, factoring in the minimum and maximum price range. Each listing includes titles, prices, merchants, delivery fees and times, and the product's image. Clicking on the shopping bag icon in the top left corner takes them to the actual Google product page in another window, ready for the user to add to their witch-list or proceed with payment.
The user can also click on the RANDOM SHOP tab, which generates a random collection of costumes from what’s trending on Google shopping.
How we built it
This app was built using Velo by Wix, which allowed us to add custom functionality and interactions using its APIs. We wrote a large amount of code to access 3rd-party web services. Custom JavaScript and CSS also ensures that the user can have an enjoyable experience; the UI/UX required much deliberation. Other technologies used were JSON and GeoJSON.
Challenges we ran into
For one particular SERP API, fetching JSON requests from their endpoint did not seem agreeable to Wix; this is likely due to some issue with resource-sharing configuration. Nonetheless, this was a minor problem, as we were able to replace the URL endpoint for one that we could successfully make a GET request to.
Accomplishments that we're proud of
This was our first time using Wix By Velo, and we worked with several developer tools offered by their services and API.
What we learned
We learned how to present data in an aggregated, organized, and readable fashion.
What's next for Paranormal Distribution
We hope to expand Paranormal Distribution to other countries, scraping data from even more sources. We may also add an in-website wishlist, where the user can log in and save their favorite costumes.


Log in or sign up for Devpost to join the conversation.