Inspiration
Parallax started with a problem we kept coming back to: a researcher can spend days running an experiment, collect hundreds of microscope images, and end up with a graph that looks completely convincing. But the graph doesn't show the blurry images, uneven lighting, weird wells, or the one replicate that might be driving the result.
The final number can look clean even when the evidence behind it isn't.
This isn't really a problem of researchers being careless. Modern biological experiments just produce a lot of data. A high-content experiment can have thousands of images across different treatments, controls, doses, plate positions, and replicates, which is way more than someone can realistically inspect one by one.
There are also problems that aren't obvious from the final graph. Poor focus can affect quantitative microscopy, and where a sample sits on a multiwell plate can influence the measurement. A result can pass normal quality checks and still have issues hiding underneath it.
We didn't want to build another tool that just counted cells and gave you a graph. We wanted Parallax to question the result itself and show why it should or shouldn't be trusted.
That's where the name came from too. Something can look convincing from one perspective and very different when you look at it another way.
What Parallax Does
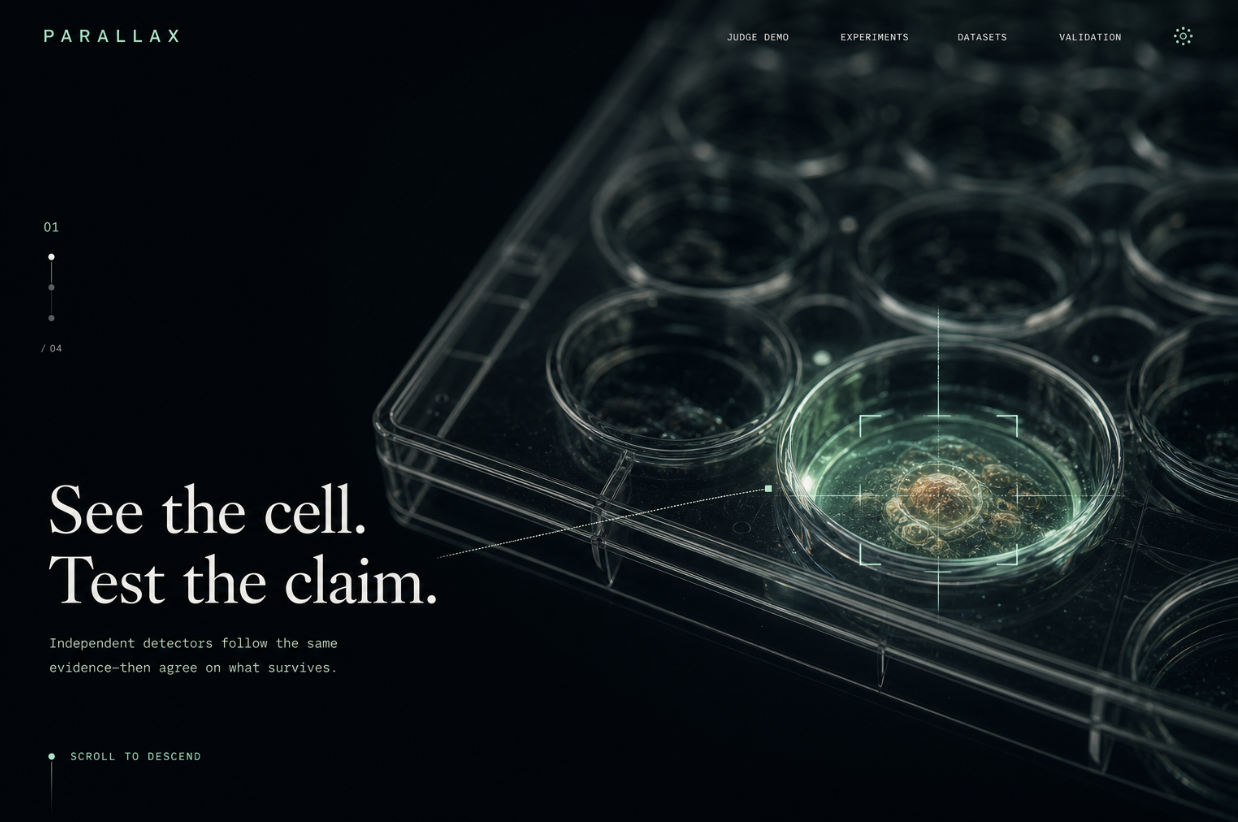
Parallax is a local AI platform for analyzing microscopy data and checking how well an experimental result actually holds up.
You can upload a microscopy video and Parallax will:
- Sample and timestamp the recording
- Check focus and illumination
- Identify the likely microscopy modality
- Measure visual field coverage
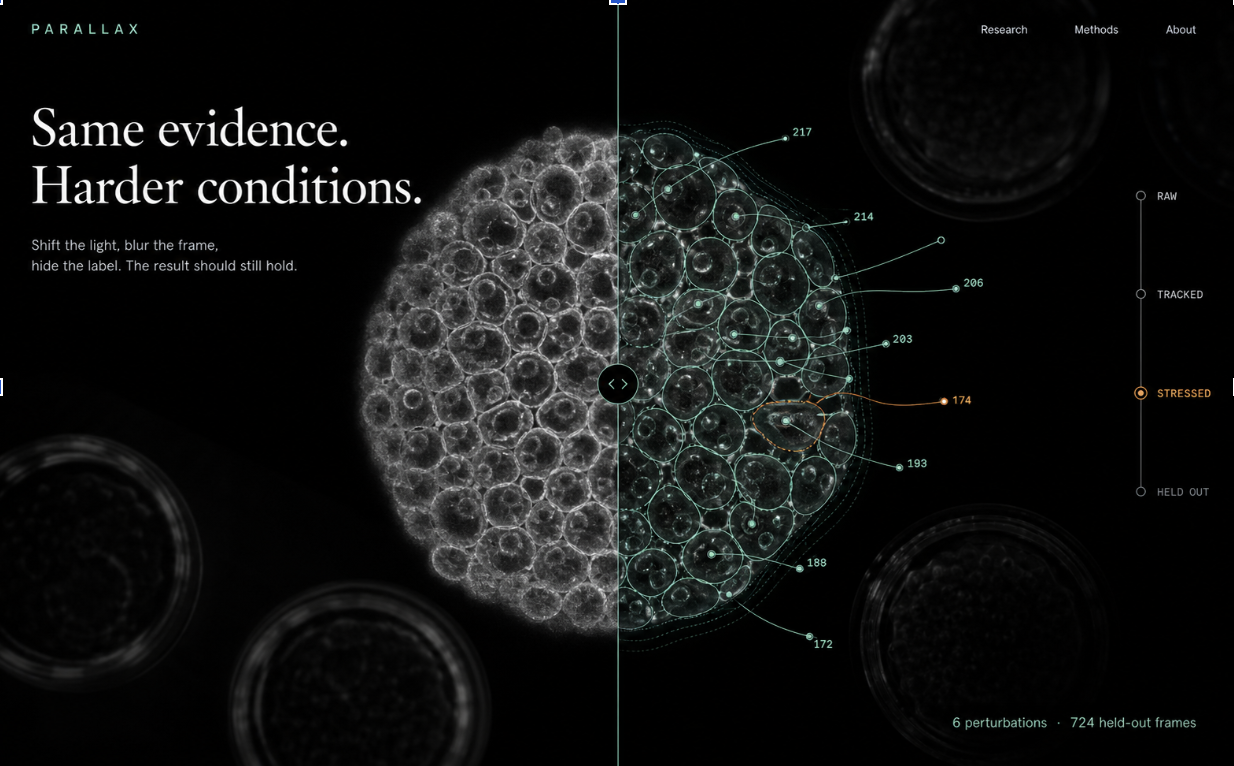
- Segment supported fluorescent structures
- Track visual regions when the consistency checks allow it
- Generate annotated frames, masks, and video overlays
- Withhold biological counts when the data isn't reliable enough to support them
You can also upload a full multiwell experiment with microscope images, a plate map, treatments and controls, doses and replicates, and an optional independent plate-reader measurement.
Parallax connects everything using the well IDs and calculates the apparent treatment effect:
Effect (%) = ((mean treatment - mean control) / mean control) × 100
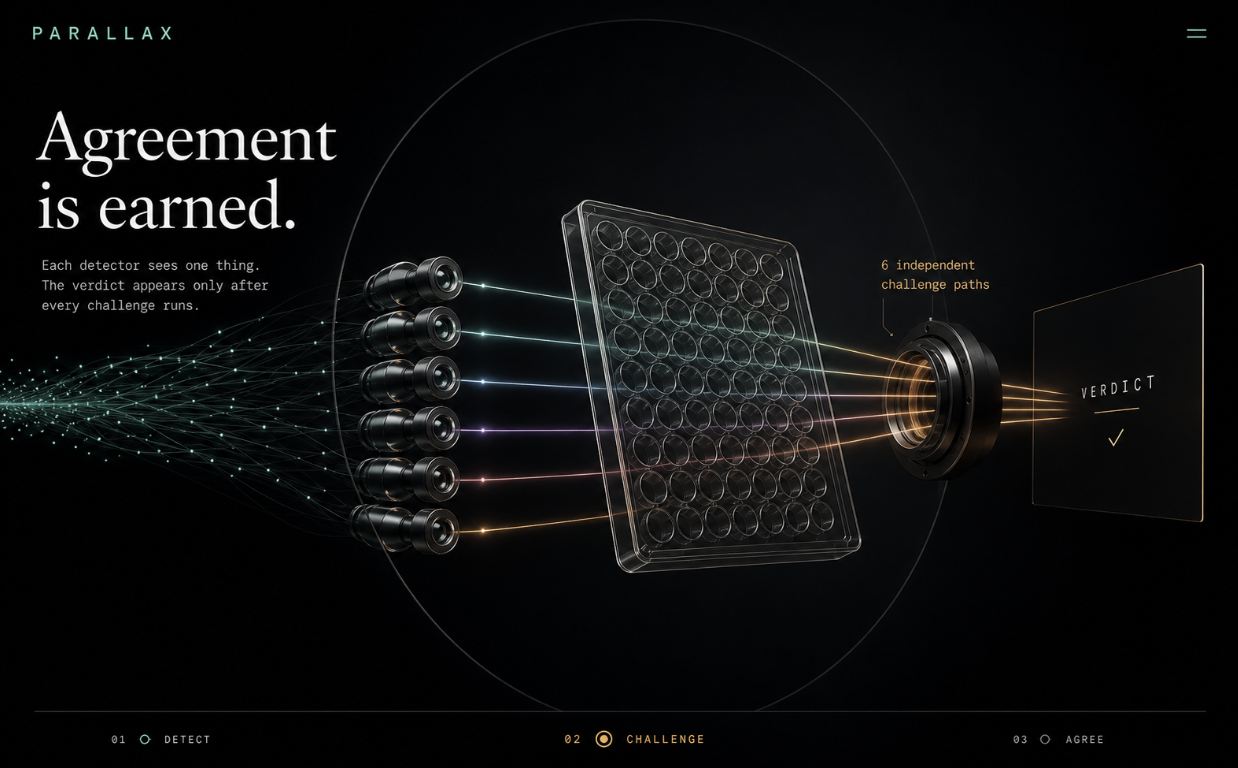
Then it basically tries to break its own result.
It recalculates the effect after removing low-quality wells. It removes replicates one at a time to see if a single sample is controlling the conclusion. It checks whether the treatment and control groups are in comparable plate positions, shuffles treatment labels to see how unusual the observed difference actually is, and, when another instrument was used, checks whether both measurements agree on the direction of the effect.
From there, Parallax can classify the result as:
- Robust within the experiment
- Quality-sensitive
- Replicate-sensitive
- Position-confounded
- Modality-discordant
- Underpowered
- Inconclusive
Everything is also traceable. Instead of just getting a final label or percentage, you can go back to the frames, wells, masks, warnings, exclusions, and calculations that produced it.
How We Built It
Parallax runs locally because we didn't want researchers to have to upload private experimental data to a cloud service just to analyze it.
The backend uses Flask, SQLite, OpenCV, SciPy, and PyTorch, and the frontend is built with React and Vite. It runs on CPU and can use Apple MPS acceleration when it's available.
For the vision side, we decided not to use one large model for everything. We built several small models where each one has a specific job:
- 7,550-parameter fluorescence segmentation model
- 9,923-parameter phase-focus model
- 9,923-parameter illumination-quality model
- 24,118-parameter modality and out-of-distribution router
- 60,545-parameter fluorescence-focus model
- Deterministic phase-texture coverage method
Each model is kept in a versioned registry with its parameter count, training source, license, checksum, benchmark results, calibration thresholds, and the imaging types it supports.
While building the training and evaluation pipeline, we used microscopy resources including the Broad Bioimage Benchmark Collection and LIVECell. LIVECell has more than 1.6 million expert-annotated cells across eight cell types, and it gave us a much better sense of how different cell shape, contrast, and density can look across experiments.
We also built Ask Parallax, a private local assistant running Qwen3 0.6B through Ollama.
It uses SQLite full-text search to retrieve evidence from the experiment you're looking at, so you can ask questions about a result and get an explanation tied back to a specific frame or well.
We also added checks around the assistant because we found that a small language model could give a really convincing explanation while getting one detail wrong. Before an answer is shown, Parallax checks things like numbers, well IDs, frame references, and whether the analysis it's talking about was actually performed. If Ollama isn't available, it can still generate a deterministic summary from the stored experiment.
Challenges We Faced
Probably the biggest challenge was realizing how easy it is to make something that looks scientific without actually being scientifically reliable.
At one point, we tested an early version of Parallax on a dense cell-growth video. It drew hundreds of bounding boxes and showed a huge increase in the detected cell count. At first it looked great. There were boxes on the cells, timestamps, percentages, and a really clear upward trend.
Then we actually went through the frames.
The cells had become so dense that individual-cell counting wasn't reliable anymore. Large connected structures were getting broken into a bunch of smaller regions, so the number looked precise even though it wasn't really measuring what we thought it was measuring.
That ended up changing a pretty big part of the project.
We stopped assuming that every detected region was a cell. Parallax now treats coverage, counting, tracking, and acquisition quality as separate problems. If counting doesn't pass the reliability checks, it doesn't report a cell count. It can still show regions and field coverage, but it labels them as exploratory instead of pretending they're confirmed cells.
Another problem was dealing with completely different kinds of microscope videos. They can vary in magnification, contrast, staining, frame rate, compression, lighting, cell type, and experimental timing.
Some are actual continuous recordings. Others are just a few images taken hours apart and exported as a short video. If we treated both the same way, we'd end up creating fake tracks between cells that were never continuously observed.
Parallax now detects those sparse growth sequences and avoids assigning identities across distant experimental timepoints.
For unfamiliar videos, the released experts still run on the sampled frames. If there isn't a validated segmentation model for that input, Parallax falls back to the things it can still support, like focus, illumination, timestamps, visual coverage, masks, and exploratory region proposals.
The chatbot caused its own problems too. During testing, we had cases where it said tracking had been attempted even though the stored analysis said it hadn't. We ended up adding numerical consistency checks, well and frame ID validation, prompt-injection defenses, evidence-linked citations, checks for supported and unsupported analyses, and a local fallback if Ollama isn't running.
What We Learned
One of the biggest things we learned while building this was that sometimes the right output is no output at all.
At first, if the model refused to give us a cell count, we treated that as something we needed to fix. Eventually we realized that forcing it to always return a number was actually the bigger problem.
For example, Parallax might say:
This recording supports an increase in visual coverage, but it does not support an absolute cell count.
That's still a useful result. It tells you what the data supports without pretending it can tell you more than it actually can.
We also learned that small models work really well when you give them narrow jobs that are easy to evaluate. One checks focus, another checks illumination, another figures out the likely imaging modality, and another handles fluorescence segmentation.
None of those models gets to decide whether the experiment "worked." That comes from putting their measurements together with the statistical checks.
The project also made us think about reproducibility differently. We originally focused a lot on image quality, but that turned out to be only one part of it. Replicates, plate layout, experimental timing, independent measurements, and even which results get reported can all affect how much confidence you should have in a conclusion.
What We're Proud Of
One of our favorite tests was with a published Incucyte cell-growth sequence.
The source video had seven display frames. Parallax caught that one of them was a duplicate and kept the six unique biological timepoints.
The coverage measurement it calculated from the images followed the published cell-growth trend with a Pearson correlation of about 0.984.
But it still wouldn't give us an absolute cell count.
Because those frames represented separate experimental timepoints, there wasn't enough information to support continuous tracking. That was actually exactly the behavior we wanted. Parallax still found the growth trend and showed the evidence behind it, but it didn't make a stronger claim than the data allowed.
What's Next
The next step is expanding the range of experiments Parallax can handle. We want to train and validate more specialists for different cell types, stains, microscopes, and acquisition conditions.
We'd also like to connect it directly to USB and professional microscope feeds.
Right now, you give Parallax an experiment after the data has already been collected. Eventually, we'd like it to work alongside the experiment itself. It could catch focus or lighting problems while they're happening, save important evidence frames, and start building the analysis before the experiment is even finished.
Parallax isn't supposed to replace researchers or decide whether a treatment works for them. The goal is to give them another way to inspect experiments that contain more evidence than one person could reasonably go through manually.
The question we want Parallax to keep asking is:
What could make this conclusion wrong, and does it survive anyway?
Research and Resources
Built With
- ai
- applesilicon
- bioinformatics
- computervision
- datavisualization
- flask
- imagesegmentation
- javascript
- localai
- machine-learning
- microscopy
- mps
- numpy
- ollama
- opencv
- python
- pytorch
- qwen
- react
- restapi
- scientificcomputing
- scipy
- sqlite
- statisticalanalysis
- vite

Log in or sign up for Devpost to join the conversation.