Inspiration
Economic news always shows you the end result, never the chain that got you there. A bank takes a loss, credit tightens, a café can't make payroll, a family cuts back on spending, and then the next shop down the street feels it too. Charts will show you unemployment went up, but they won't show you why, or who felt it first, or what would have happened if someone had stepped in earlier. We wanted a place where you could change one thing and just watch that chain move through a city, loan by loan, person by person, and then ask, honestly, what if we'd done something different?
What it does
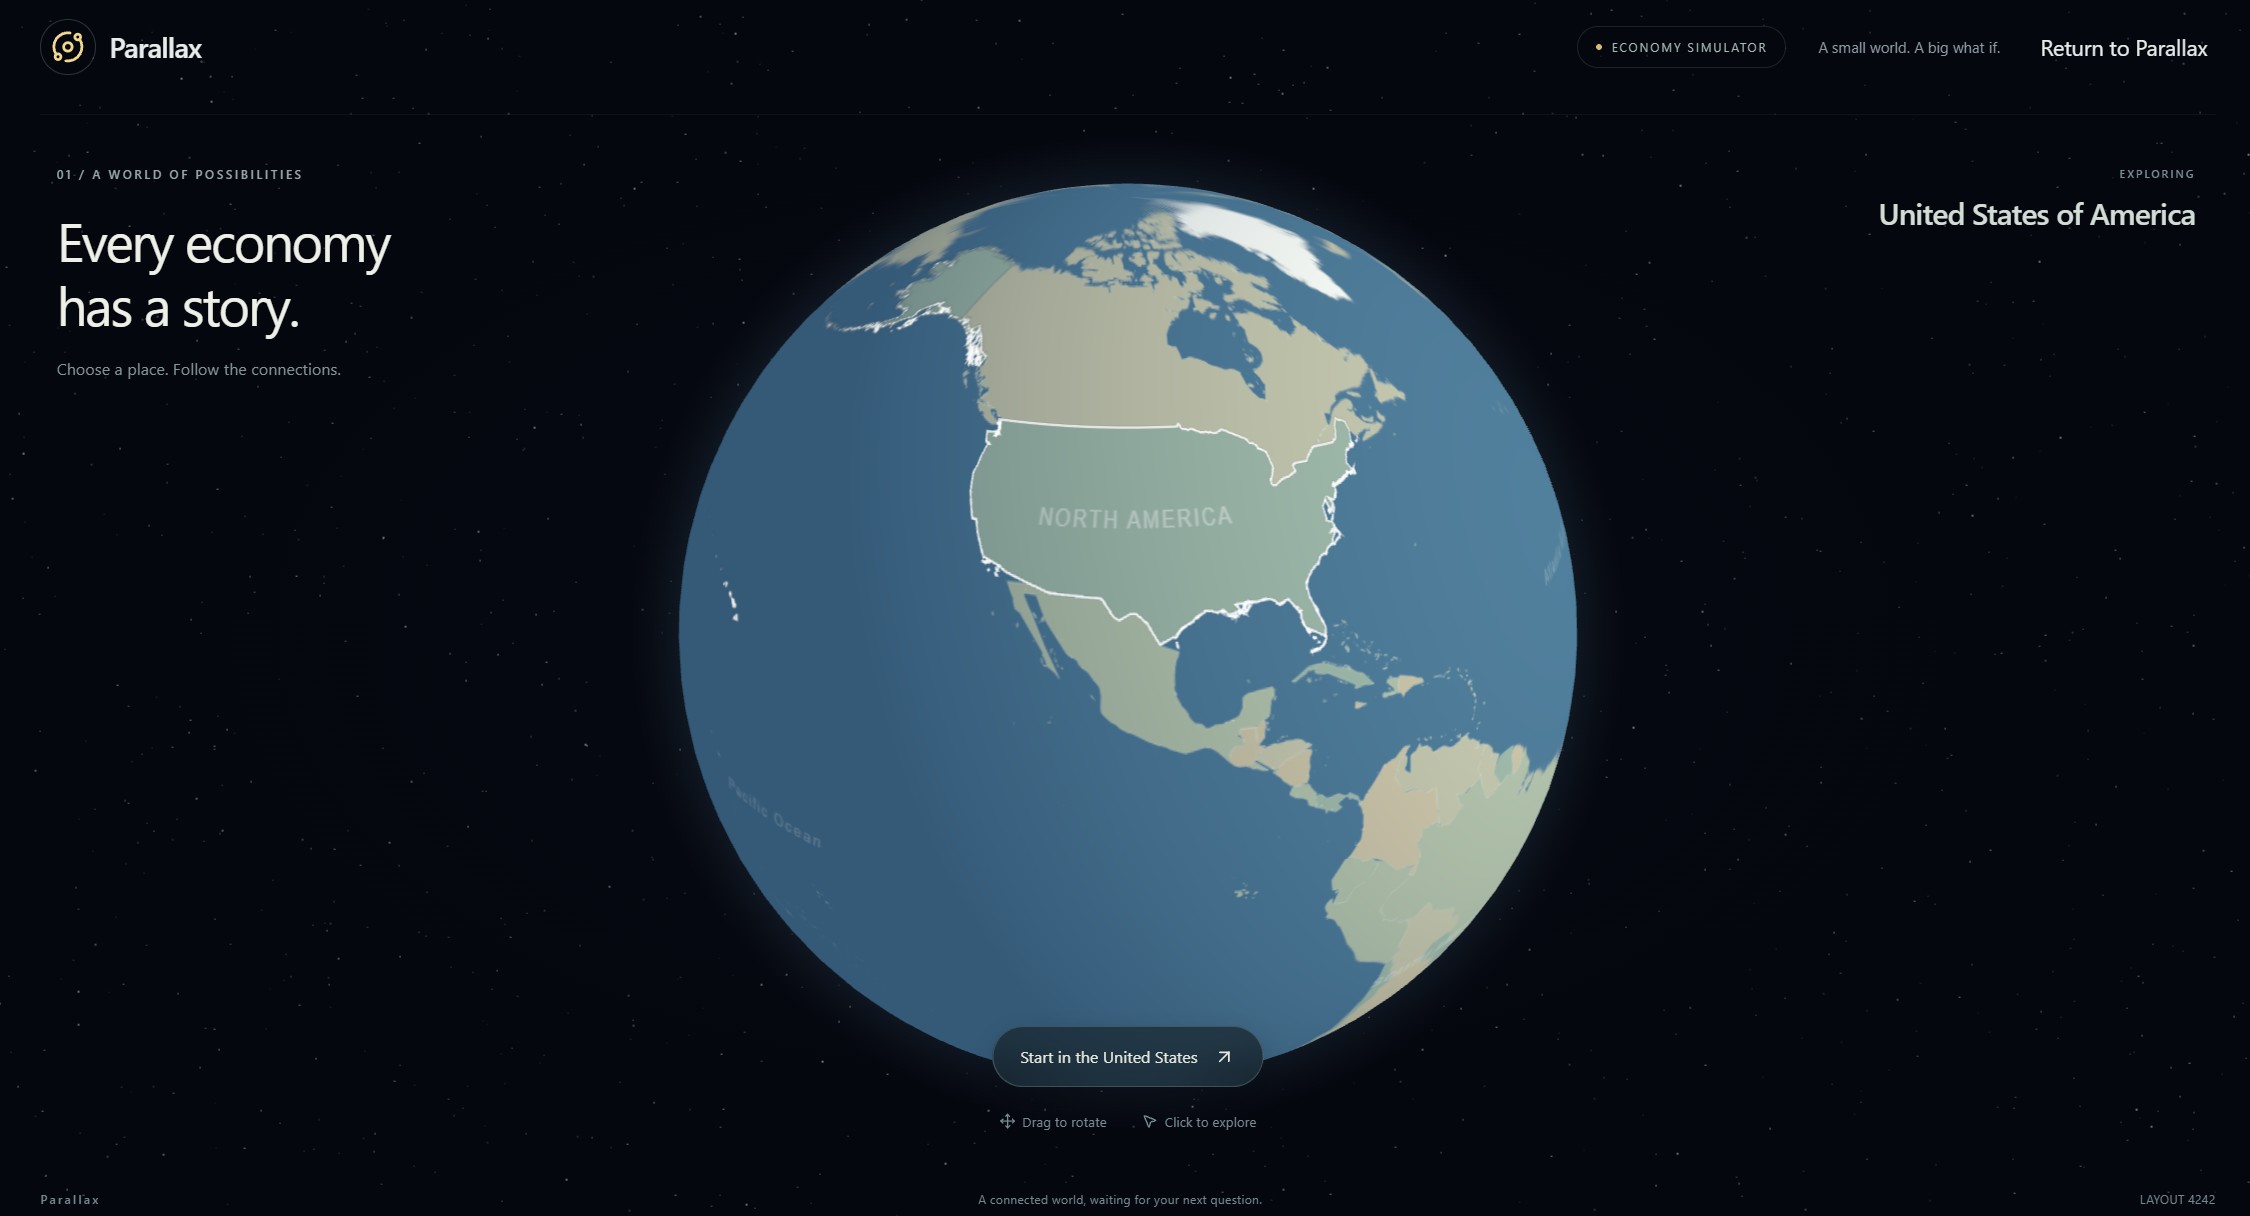
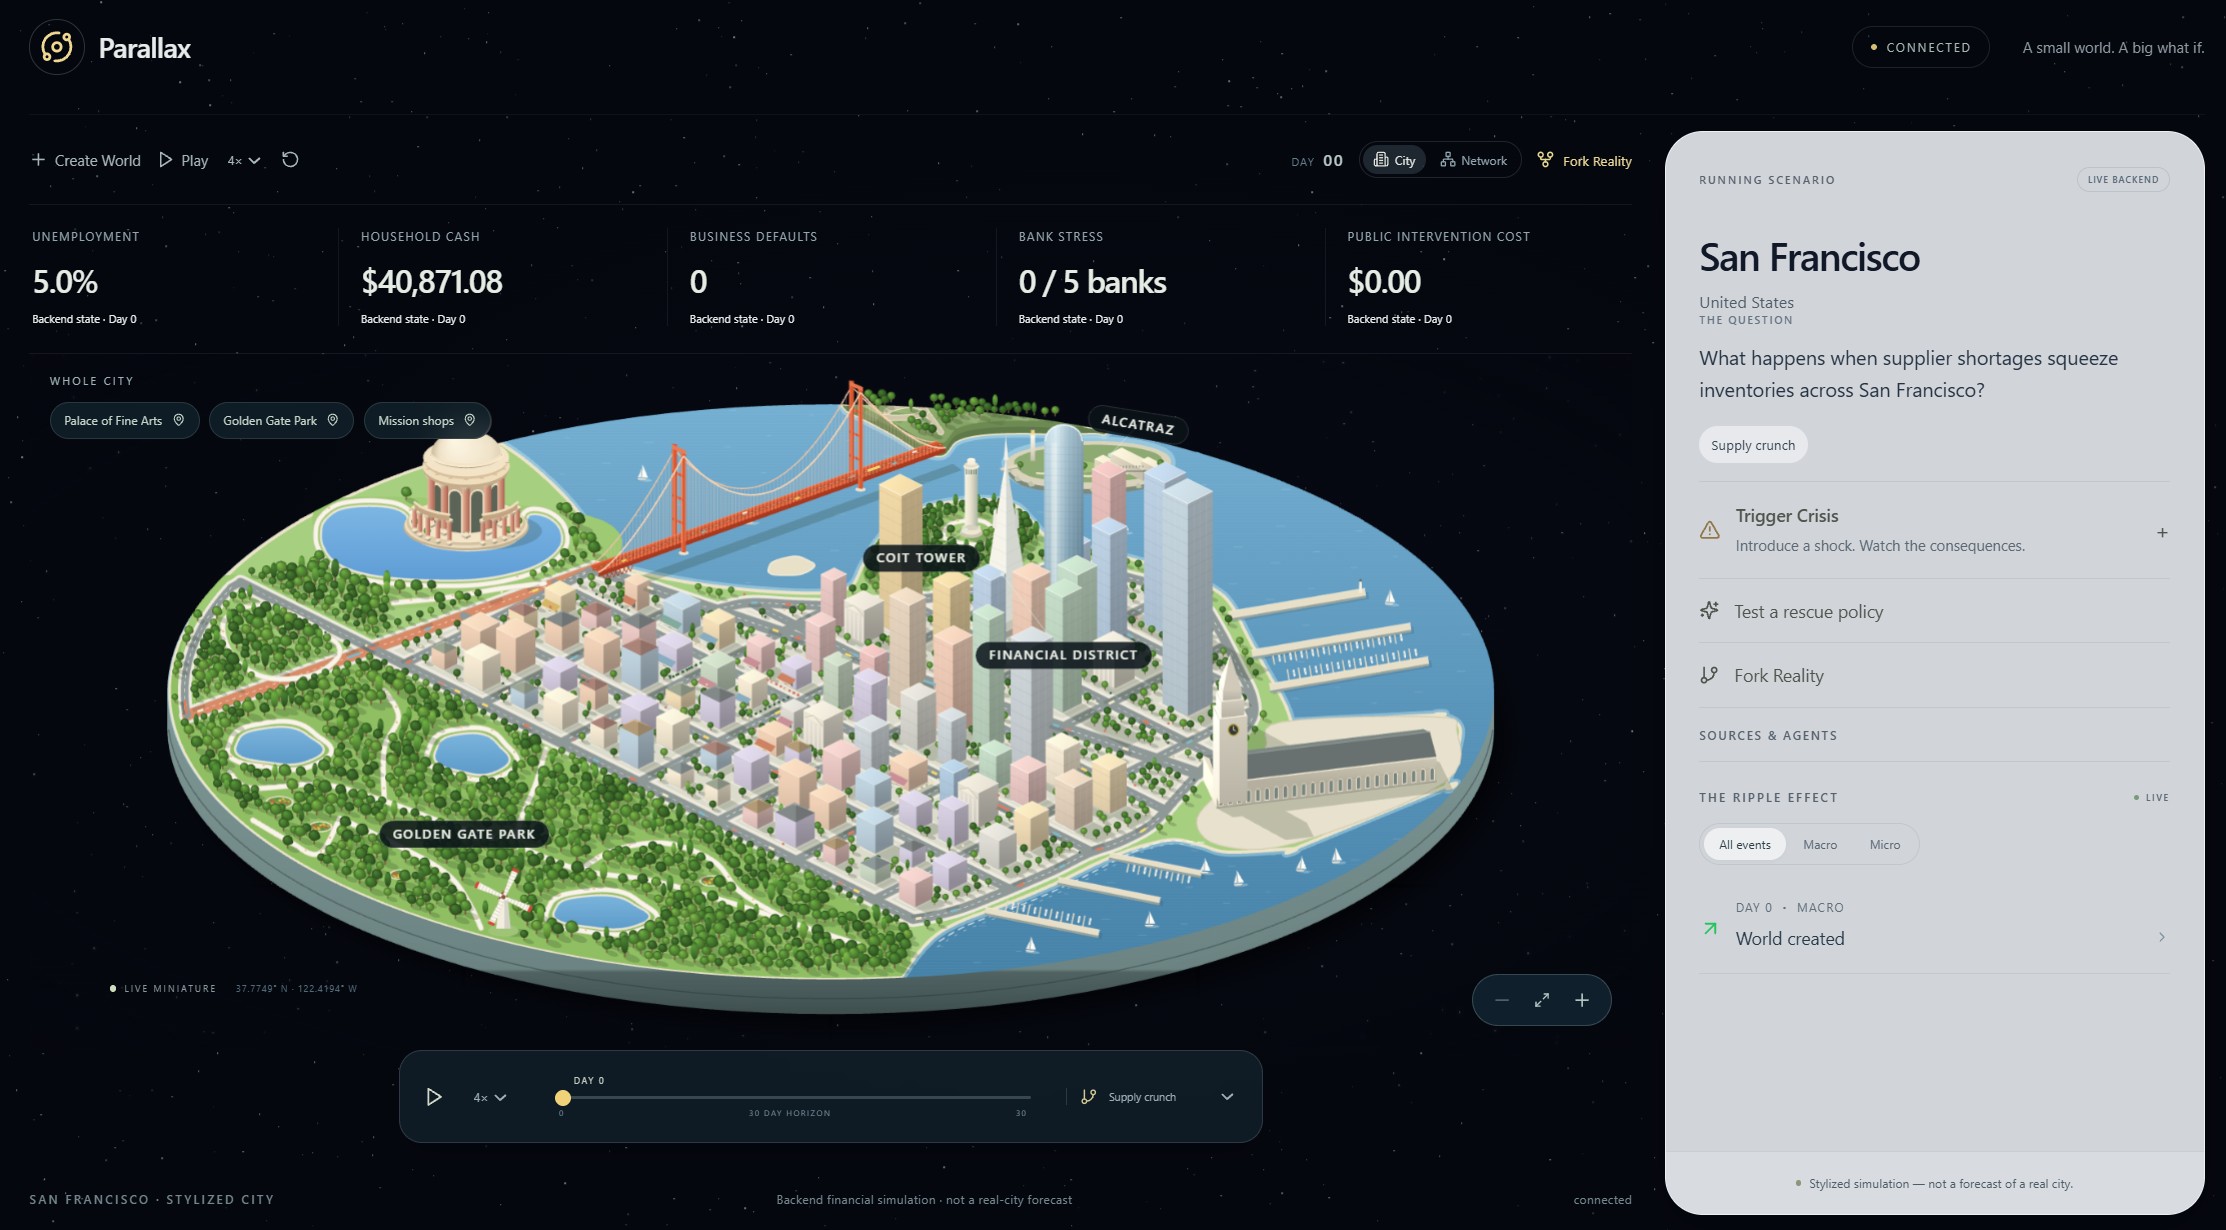
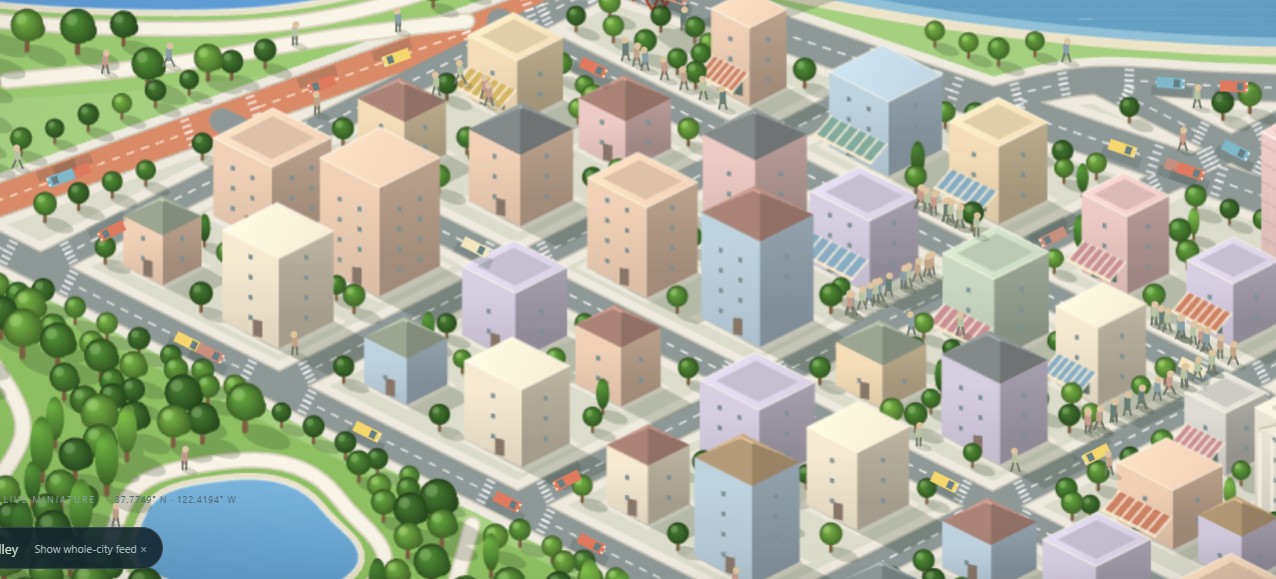
Parallax is a living miniature economy of San Francisco. You start on a 3D globe, zoom in, and you're suddenly looking down at a hand-built isometric diorama of the city, and you get to pick a question. What happens when a bank takes heavy losses? What happens when suppliers run short? What happens when nothing goes wrong at all?
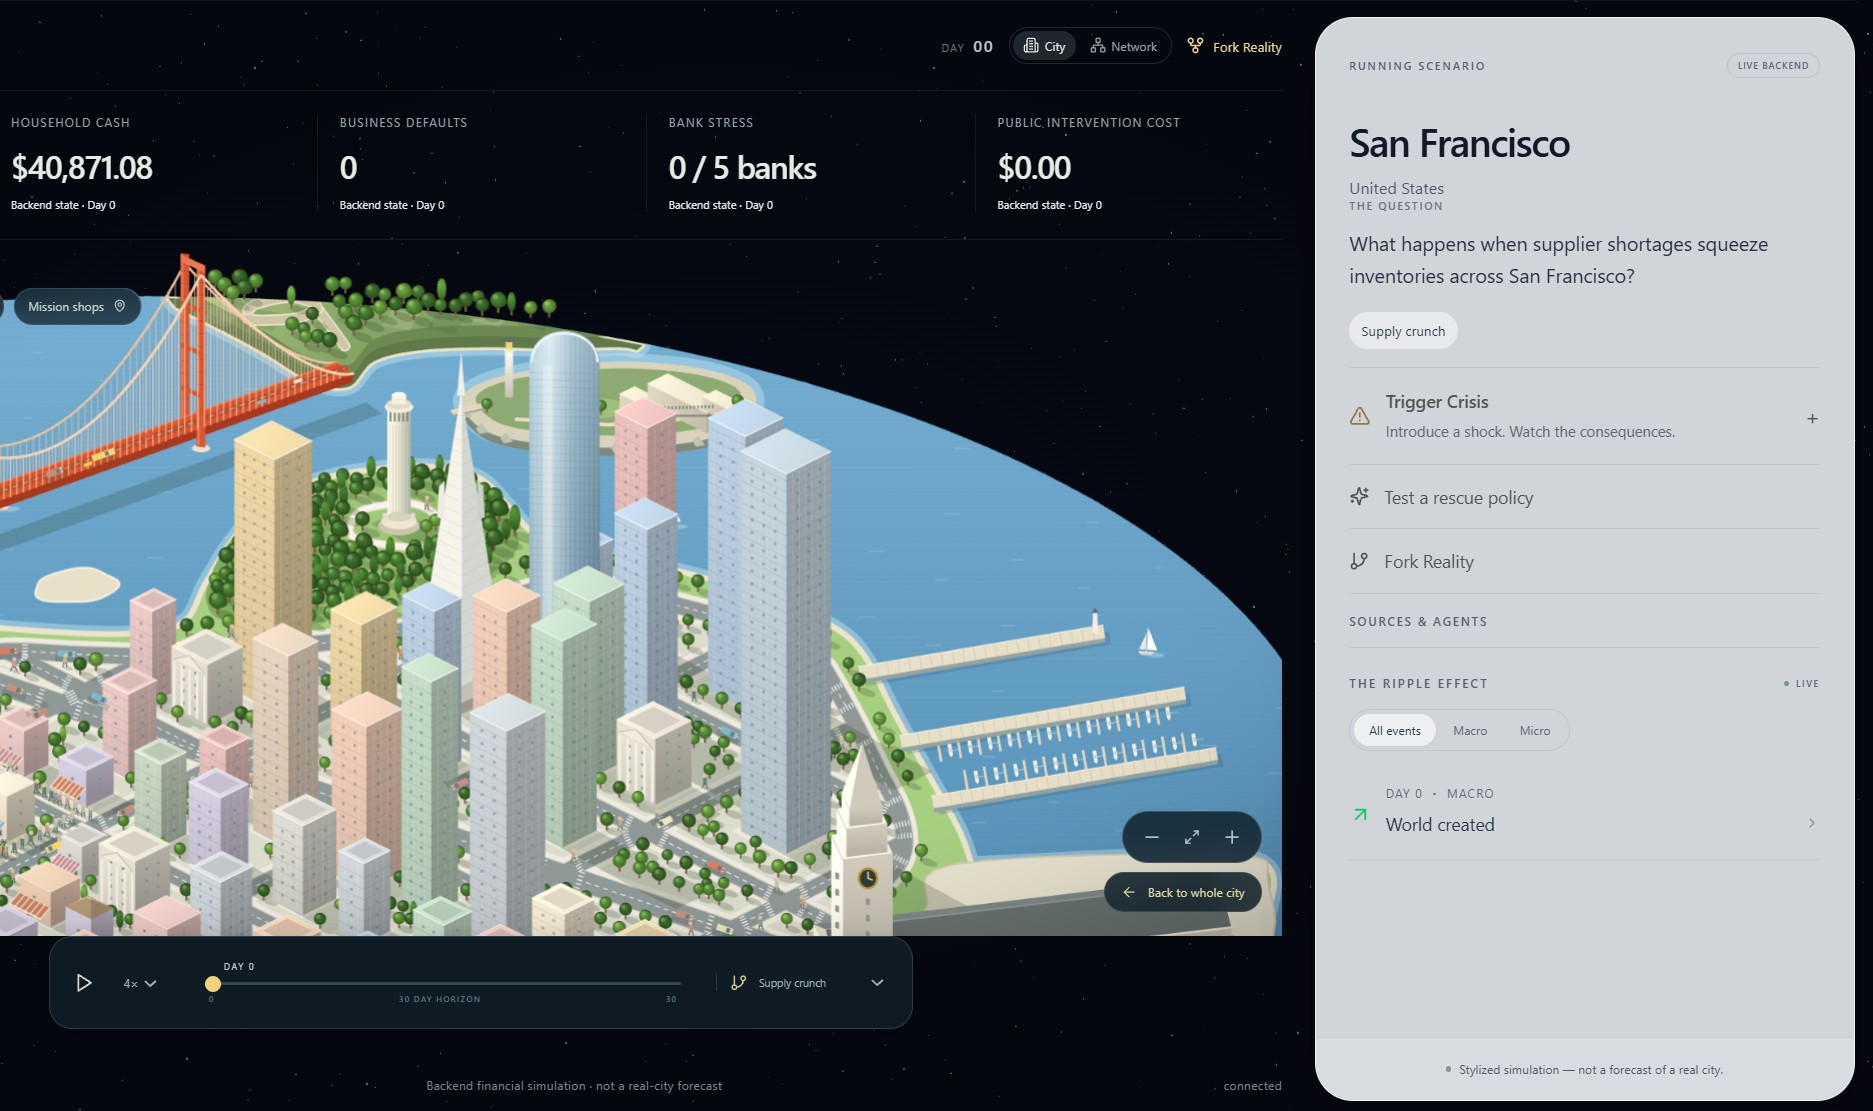
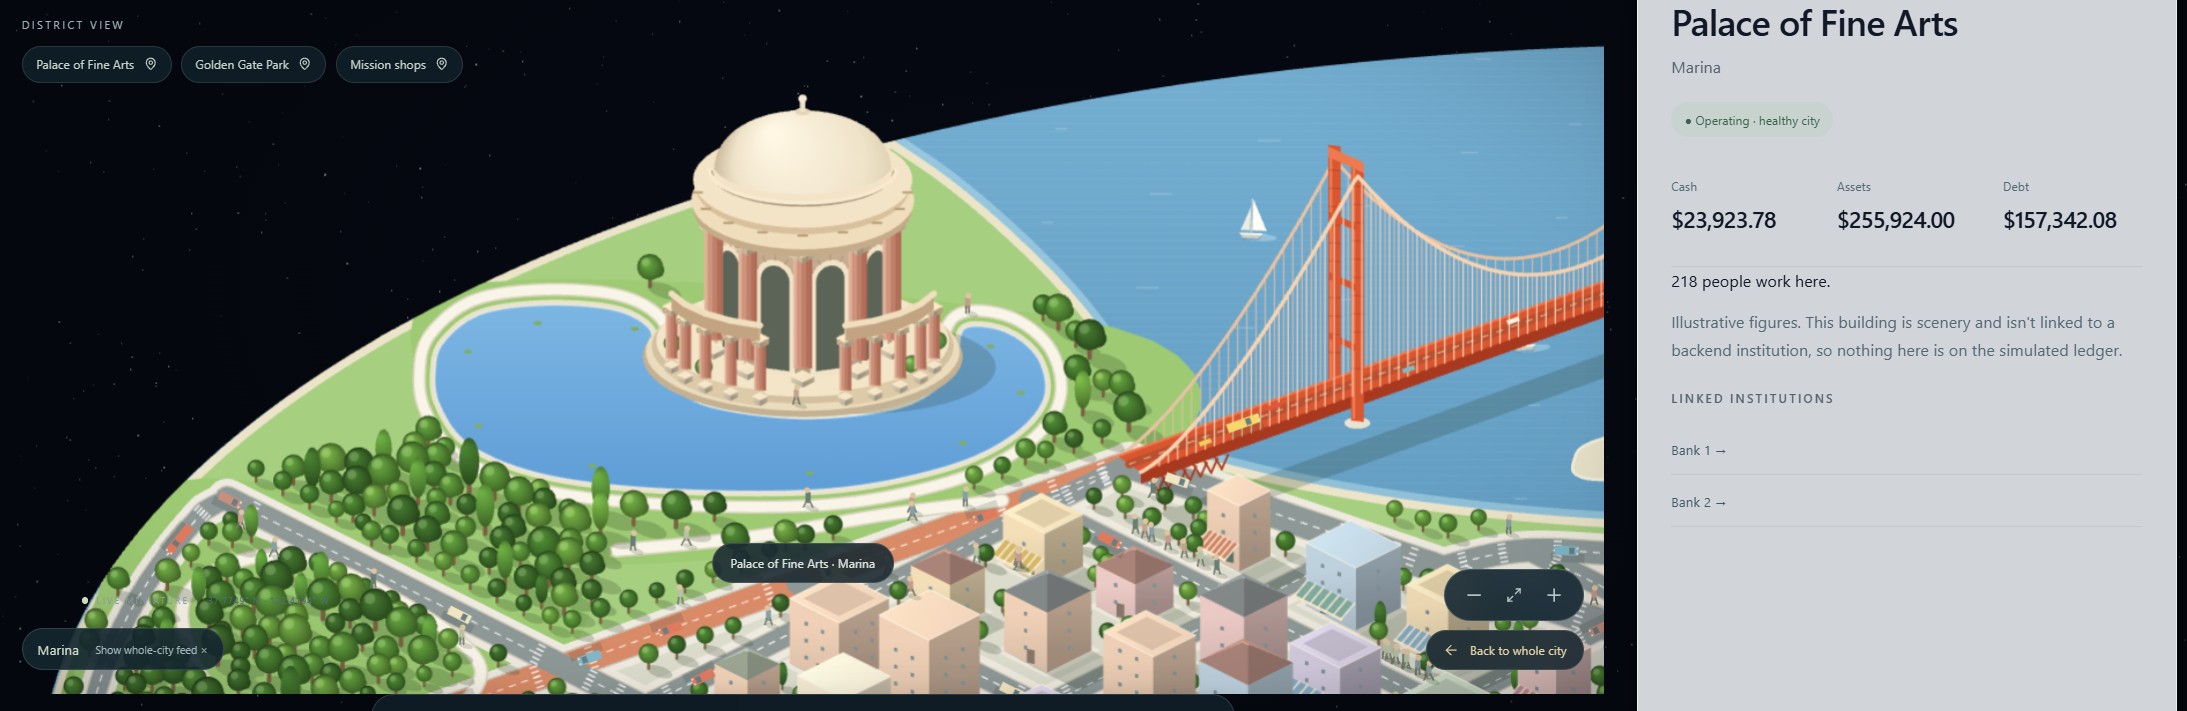
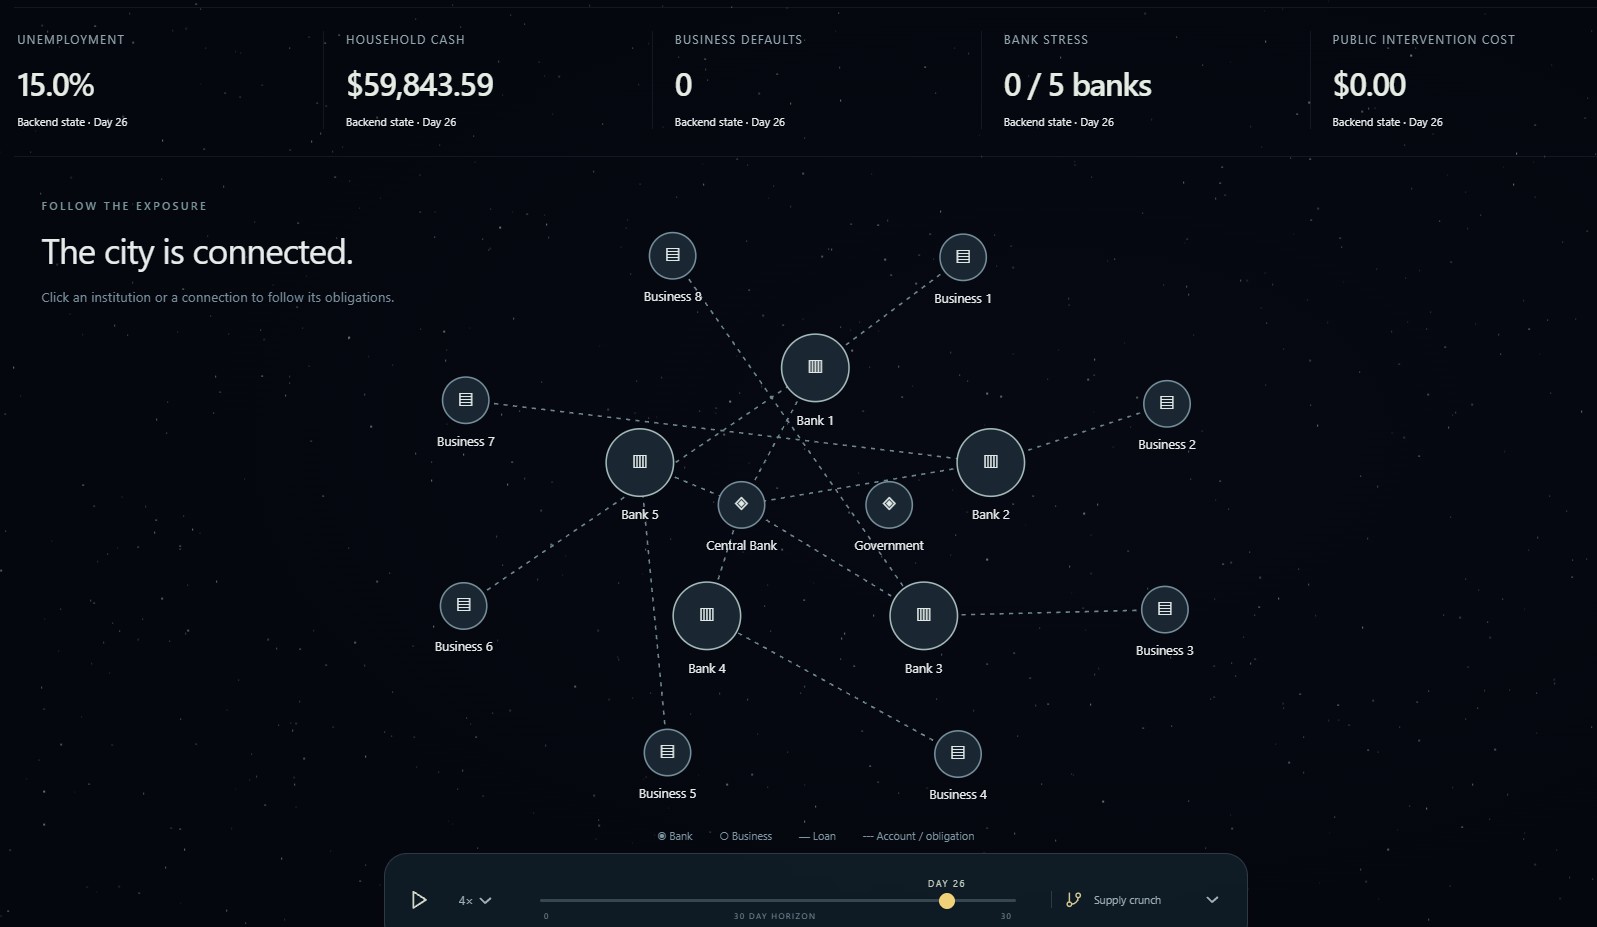
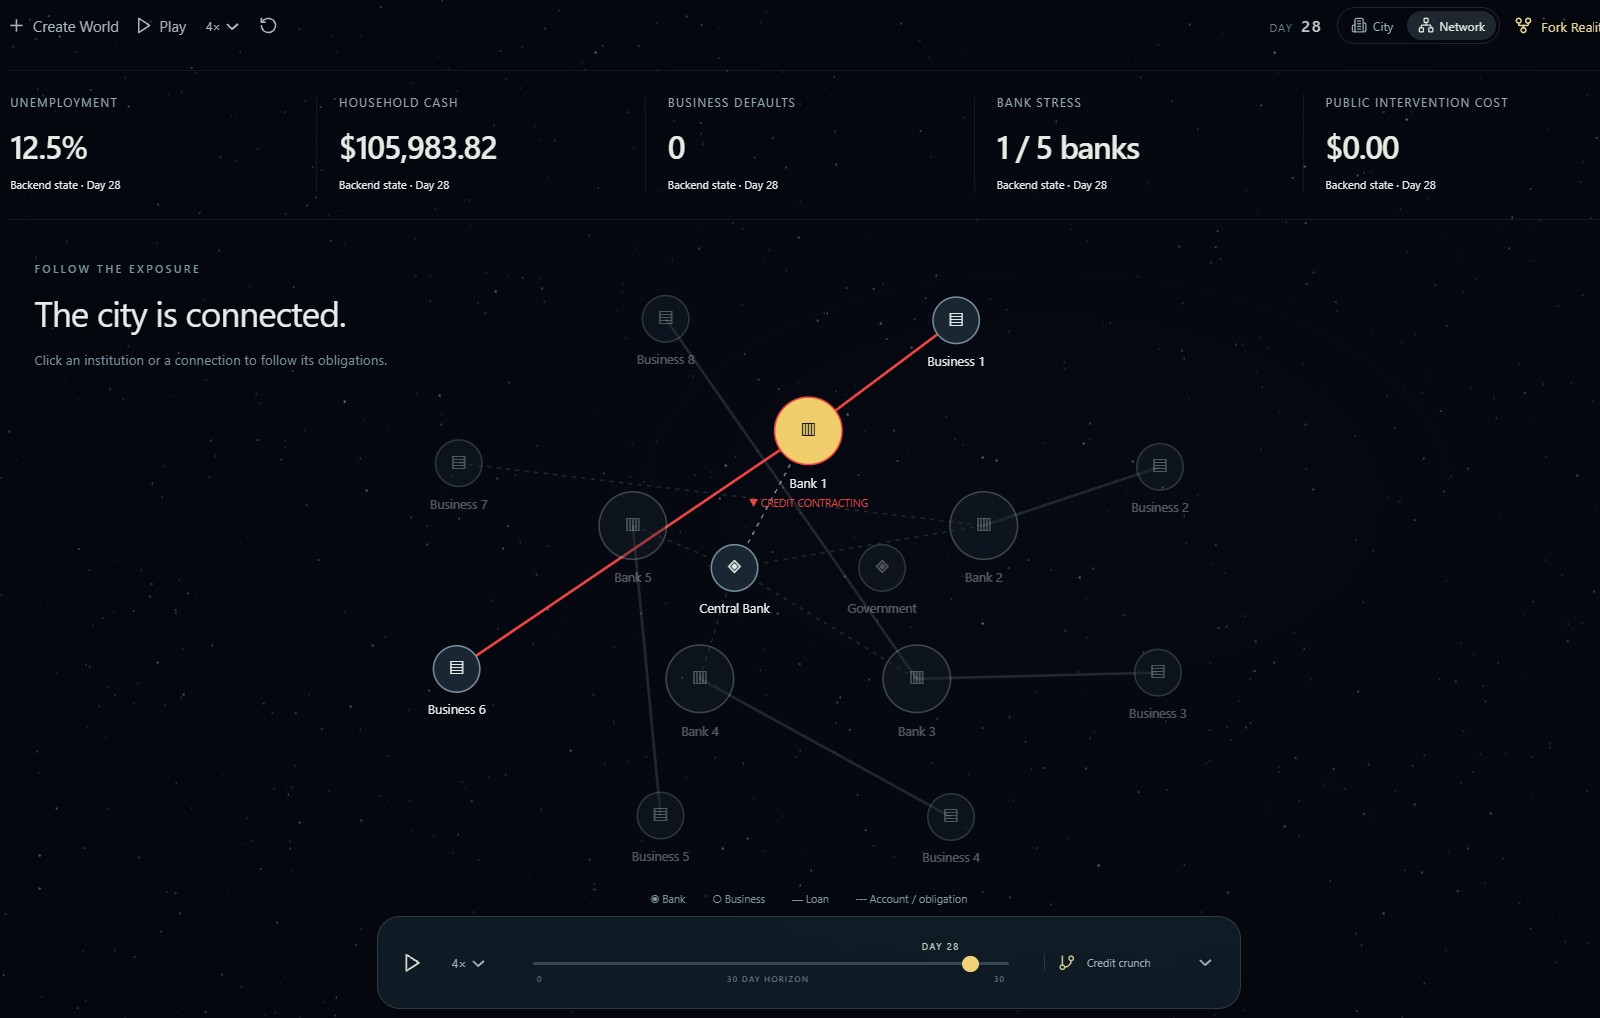
Behind that diorama is a real simulation, not just an animation. Forty households, eight businesses, five banks, a government and a central bank, all living in the same world. Every wage, purchase, loan and default settles on a double-entry ledger, and that ledger is audited after every simulated day, so every dollar can actually be traced. You can play the timeline and watch unemployment, household cash, business defaults and bank stress move live, while a ripple effect feed shows each event as it happens. You can hit a bank with asset losses and watch credit dry up, payroll fail, and layoffs spread, gradually, not all at once. You can click any building and see who's inside it, what they owe, who they owe it to, and what they've just paid. And you can switch to a network view and see that whole web at once, who owes whom, through loans, accounts and supplier contracts.
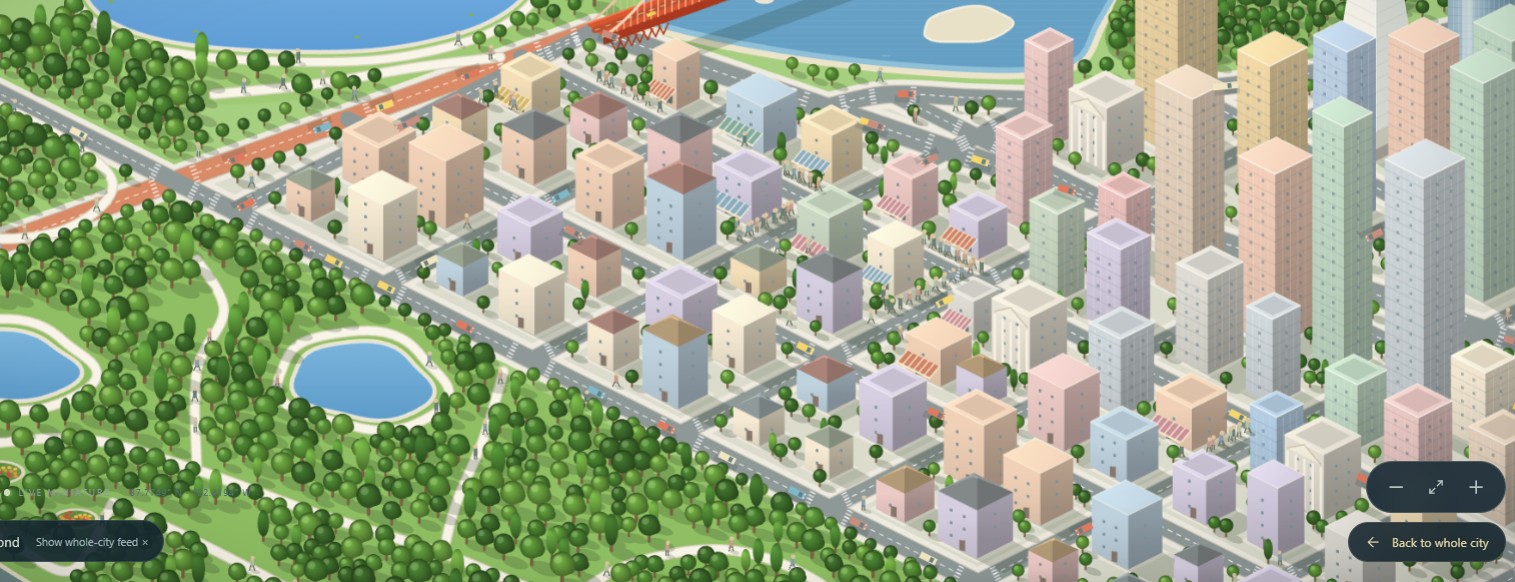
The part we're most proud of is the diorama itself. You start on a globe, zoom in, and you're suddenly looking down at a isometric San Francisco, drawn on canvas, not generated from a map tile. The Golden Gate Bridge, Transamerica Pyramid, Salesforce Tower, Ferry Building, Palace of Fine Arts and Golden Gate Park are all uniquely created, with labels that don't overlap and buildings that actually respond when you click them. It's not just a backdrop for charts, it's a city you can explore on its own. Click a building and you can see who's inside it, what they owe, and what they've just paid. Switch to network view and you can see who owes whom. And as the economy changes, the city changes with it, shops dim, queues grow, movers thin out, so you can see a crisis happening, not just read about it in a metric.
How we built it
The frontend is React and TypeScript on Vite, with Zustand for state. The globe uses three.js and three-globe, and the San Francisco diorama is drawn by hand on a 2D canvas in isometric projection, with the Golden Gate Bridge, Transamerica Pyramid, Salesforce Tower, Ferry Building, Palace of Fine Arts and Golden Gate Park all in there, because we wanted it to feel like a place, not just a dashboard.
The backend is Python, FastAPI and SQLite. One simulated day is one tick, and every random draw is seeded by the world seed and the day, so the same seed always replays the same history, which is what keeps every Fork Reality branch fair. The agents work in a bounded loop: observe, test, revise. The policy assistant runs on NVIDIA Nemotron through Nebius AI Studio, a probabilistic model with AI inference. A credit agent handles bank underwriting, and a procurement agent negotiates supplier contracts. We also wired in Apify for optional price and wage calibration, Fetch.ai uAgents and ASI:One for research, SpacetimeDB to mirror events to a shared feed, and x402 for a capped test-USDC research purchase on Base Sepolia. For testing, we used pytest for the engine, ledger, forks and agents, Vitest for the city geometry and UI logic, and Playwright for end-to-end runs.
Challenges we ran into
Keeping the money honest was the first hard problem. Every shock, loan write-off and intervention has to balance, so we audit the whole ledger after every day, every fork and every intervention. A lot of bugs showed up as an audit failure long before they ever reached the screen, which was frustrating at the time, but it meant we could actually trust the numbers when they did show up.
Plausible unemployment was the second. At first, unemployment only moved when a whole business defaulted, so it was either zero or a cliff, nothing in between. We ended up adding a small baseline and gradual, capped layoffs at stressed firms, at most one worker per business per day, and at most five percent of the workforce per day. Layoffs are probabilistic at cohort level, with one seeded draw per cohort, so they're reproducible and tested, not hard-coded, and crises finally unfold instead of just collapsing.
Then there was the moment Fork Reality showed us one flat line, and we thought we'd lost data. We hadn't. The branches really were identical, because we'd forked after the defaults had already happened, so there was nothing left to diverge. That taught us something important, and we redesigned the charts with distinct line styles, markers, a hover tooltip and an "identical on this day" note, so equal values read as equal, not broken.
Performance bit us too. Pressing Play froze the app for about a second, and profiling found the backend deep-copying a one megabyte world state on every request. Removing the redundant copies made playback smooth again. And making a stylized city feel real took several rounds on its own, bridge cables, pier slips, label placement and click targets, all before the diorama matched our reference and every building actually responded to clicks.
Accomplishments that we're proud of
We'd say we're proud of a simulation where every dollar can be traced, from a bank shock through payroll to a household's spending, on a ledger that's audited every day. Also proud of Fork Reality, three exactly comparable futures from one snapshot, with a hash proving they share a source. We're proud of an AI policy assistant that has to test its ideas on forked copies before it recommends anything, and shows its work while it does it. And honestly, we're just proud of the city itself, an interactive, quirky San Francisco model that's fun to explore even if you never trigger a crisis at all.
What we learned
Seeded randomness turned out to be a feature, not a compromise. Probabilistic changes at cohort level, with one seeded draw per cohort and day, made forks comparable, bugs reproducible and tests reliable. We also learned that a simulation can be correct and still feel wrong. The hardest part wasn't getting the math to balance, it was tuning stress so crises unfold gradually instead of collapsing everything at once. We learned that "no difference" is a real result, and it needs to be designed for and explained, not hidden. And we learned that agents work best inside tight limits, a fixed toolset, a budget cap, an experiment limit and a ranking rule they can't argue with.
What's next for Parallax
Next, we want more cities, using the same city generator and real reference data, so this isn't just a San Francisco demo. We want gentler, better-calibrated scenarios, so a credit crunch stays plausible across every seed, not just the default one. We want hiring and recovery, so unemployment can fall as well as rise. We want richer policies in Fork Reality, rate changes, targeted credit and supplier guarantees, all compared side by side. And we want a procurement-first response to supply shocks, where the agent finds a new supplier instead of just reaching for money.
Built With
- apify
- base-sepolia
- fastapi
- fdic-bankfind
- fetch.ai
- nebius
- nvidia-nemotron
- python
- react
- spacetimedb
- sqlite
- three.js
- typescript
- uagents
- us-census-bureau
- vite
- x402
- zustand

Log in or sign up for Devpost to join the conversation.