Inspiration
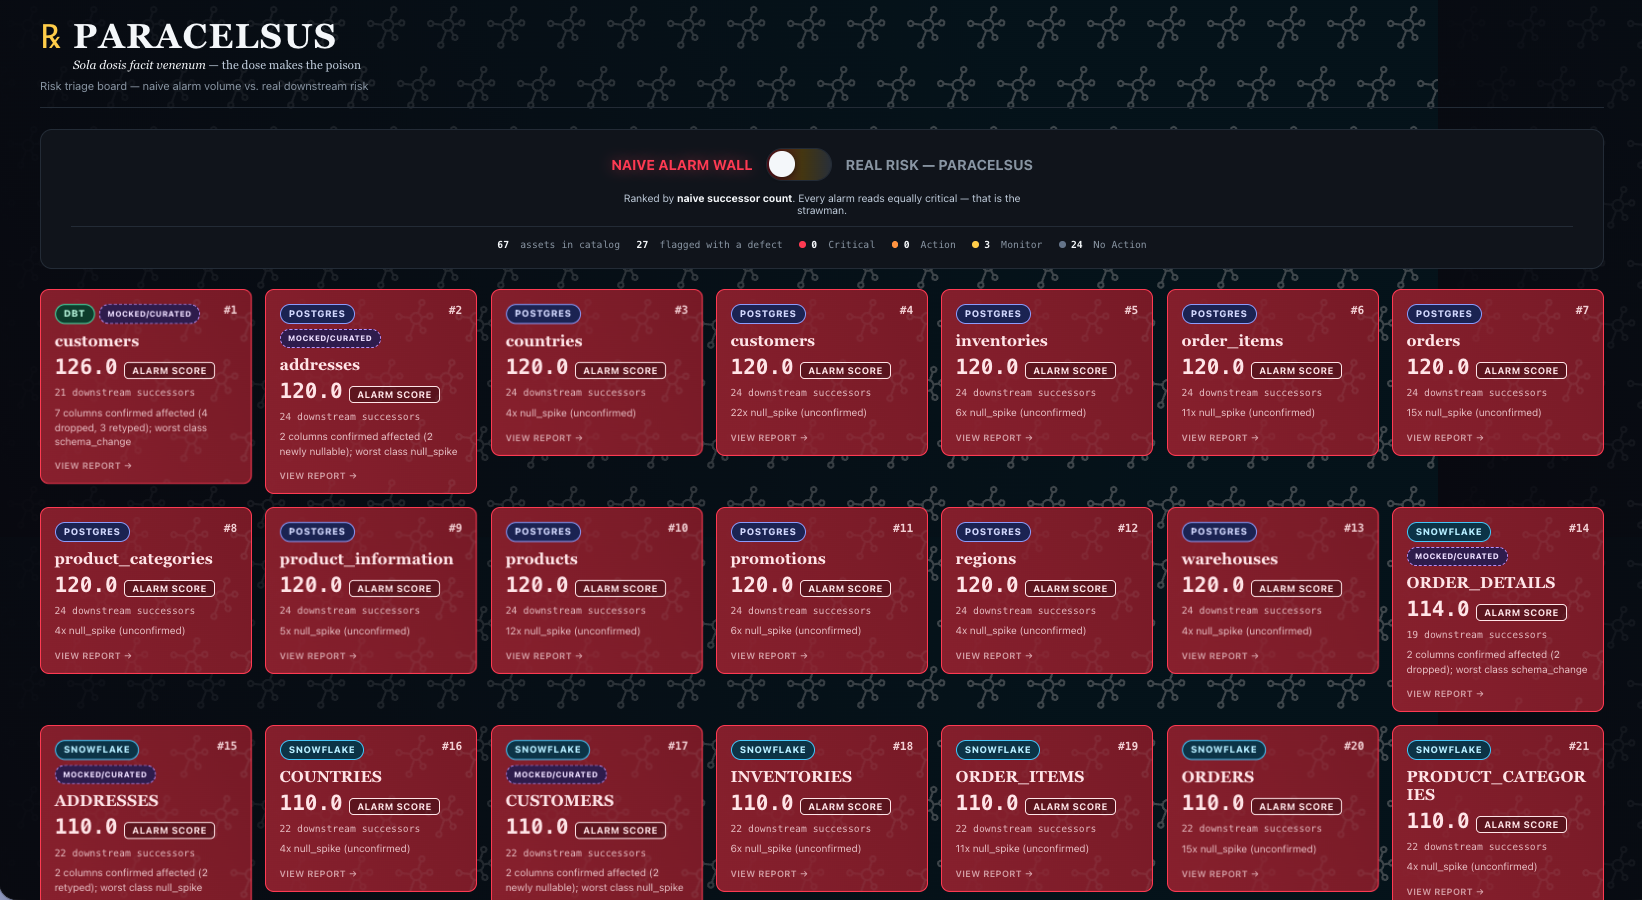
Point a data quality tool at a catalog and it finds hundreds of problems. It ranks them by severity times the number of things downstream — blast radius — so everything important-looking floats to the top, all of it marked critical, all of it equally loud. Teams stop reading. That is not a side effect of the design. It is the design.
The missing distinction is old and well understood outside software. A hazard is what something can do. A risk is what it will do to whoever is actually exposed, in the amount they are actually exposed to. Toxicology has separated the two since the sixteenth century.
Our team includes a board-certified toxicologist who assesses whether substances are safe for human beings, at what dose, and how far the underlying evidence can be trusted. The error every data quality tool makes is the one her field solved five hundred years ago: ranking by how broken something is, while ignoring who is actually exposed to it.
What it does
Paracelsus scores every finding the way a regulatory risk assessment scores an exposure:
Risk = Hazard × Exposure × Receptor sensitivity × Uncertainty
- Hazard — how bad this class of break is, scaled by dose: the share of the asset's columns the defect actually touches.
- Exposure — not how many assets sit downstream, but how much they are actually used. Each successor contributes according to its own query volume, decaying with each hop.
- Receptor sensitivity — what kind of consumer is on the other end, read from tags, domains and platform.
- Uncertainty — the counterintuitive one. Where evidence is missing, the score goes up. No column-level lineage adds 3. No usage data adds 3, because unused and unmeasured are not the same thing and we cannot tell them apart.
### The result, on DataHub's own showcase catalog
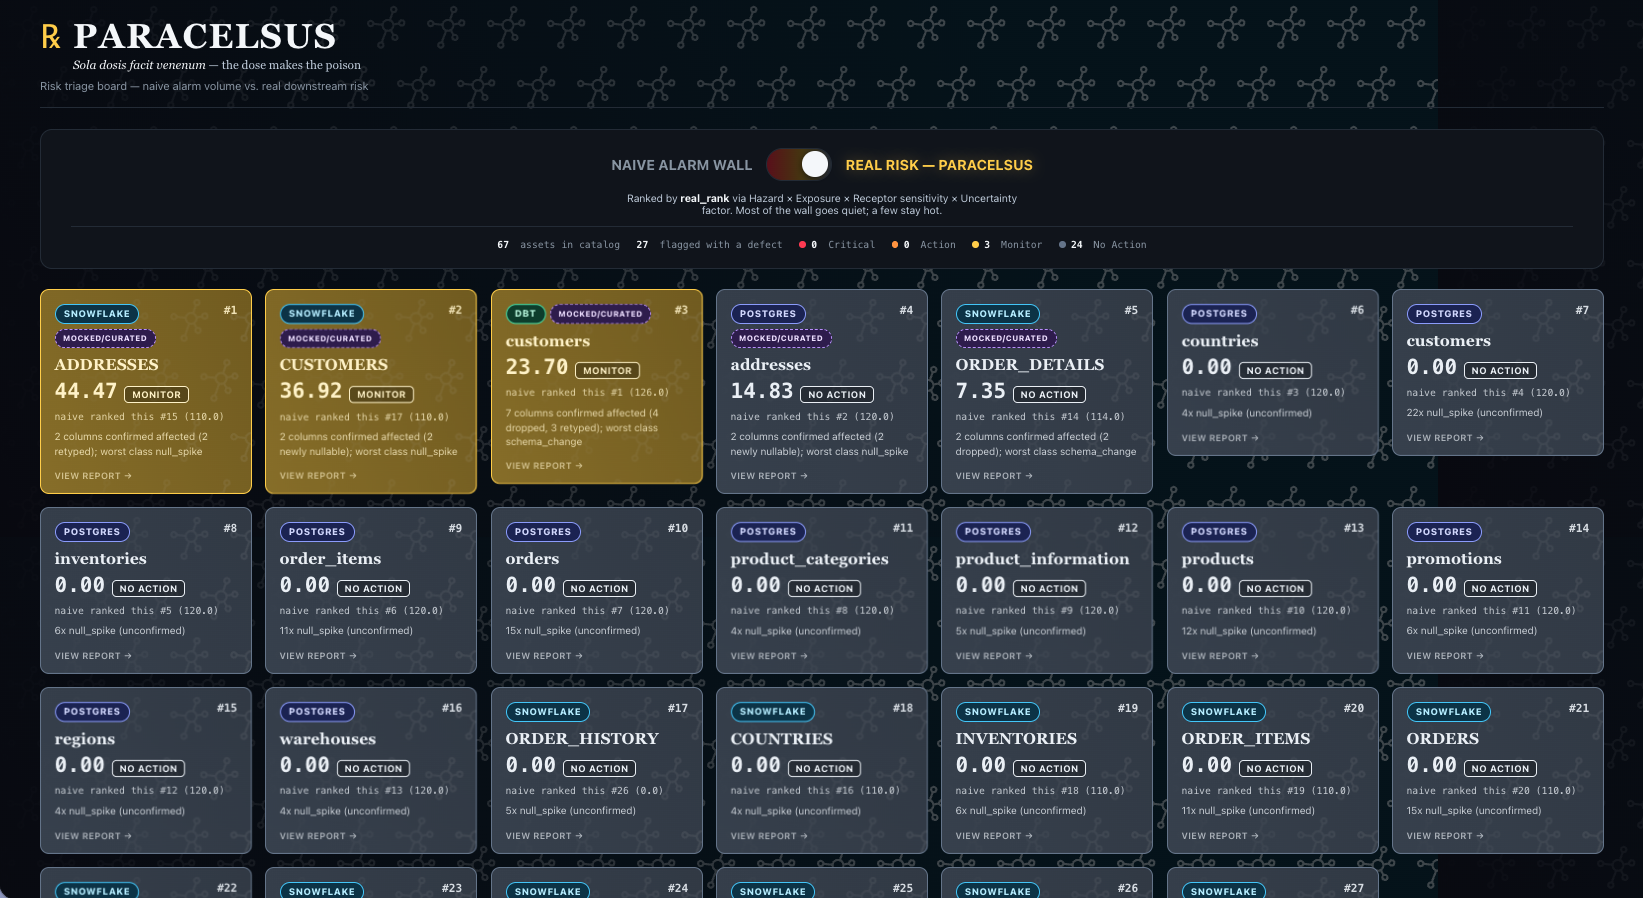
27 findings. Five have something genuinely wrong. Twenty-two score exactly zero — not "low", zero — because nothing has actually changed about them. They are static schema properties that a severity ranker reports as damage every single morning.
The argument lands in one row pair. Two tables named addresses, on two platforms, broken identically — two of nine columns each. Same hazard, same dose, same receptor.
| | naive rank | real rank | risk | band |
|---|---|---|---|---|
| snowflake ADDRESSES | #15 | #1 | 44.47 | Monitor |
| postgres addresses | #2 | #4 | 14.83 | No Action |
The postgres table is the one a blast-radius ranker puts second in the entire catalog, on 24 downstream assets. Its real exposure is 0.89, because the traffic sits five and six hops away and most of what is downstream has no usage data at all. Note which way uncertainty ran: we scored it double the uncertainty surcharge for that missing evidence — and it still does not need action, because nothing close to it is drinking from it.
The same defect class on snowflake CUSTOMERS, a table people actually query, scores 36.92 — Monitor. Same break, two and a half times the risk, decided entirely by who is downstream.
The right answer to a healthy catalog is silence. A severity ranker cannot produce that.
### What is real and what is staged
Real: the catalog, its lineage, its column-level lineage, its usage statistics, its tags and domains. Every exposure, receptor and uncertainty figure is computed from metadata that shipped with the catalog, unmodified.
Staged: the schema changes themselves. A static demonstration catalog contains no incidents — nothing has broken, nothing has drifted. Five changes were planted so there is something to triage, on assets chosen by a rule written down before any score was computed, and disclosed in the repository, on the board, and here.
What is staged is the defect. What separates the scores is not. The seed decides that something broke; the catalog decides whether it matters — and twice it decided against the assets we would have preferred.
How we built it
A deterministic Python engine does all the scoring. No number in the output comes from a language model.
The agent orchestrates real tool calls against DataHub through the MCP server and GraphQL — reading lineage with real hop distance, column-level lineage with confidence scores, usage statistics, tags, domains and schema — and it is deliberately forbidden from producing any figure. The model only puts the engine's numbers into sentences. A risk score a language model can influence is a risk score nobody can defend.
Then it writes the judgment back into the graph: six paracelsus.* structured properties per asset, a risk-band tag, and a readable assessment document naming every factor, its source, what to do, and what would change the verdict. Every write is read back and verified, because the API can report success on a write that silently did nothing.
The next person, and the next agent, inherit the judgment rather than the alarm.
The repository brings up its own DataHub, loads a real catalog, and runs end to end. There is no hosted instance to depend on and nothing to sign up for. A preflight check names anything missing instead of failing later with an unrelated error.
Challenges we ran into
usageFeatures is write-only in DataHub 1.7.0. It ingests fine and cannot be read back through any of the seven read paths we tried — OpenAPI v3, legacy REST, /entitiesV2, the OpenSearch index, the official SDK, or GraphQL's derived fields. We filed it as
datahub#19014. Our workaround re-emits the datapack's own query counts through datasetUsageStatistics, which is readable — the same real numbers, through a different aspect.
The pipeline used to poison itself. The detector overwrote its own schema baseline on every run, so a second run diffed the current state against itself, found nothing, and returned an empty board. Anyone running it twice — including a judge — would have seen an empty catalog and concluded the tool was broken. The baseline now ships as a committed fixture and the output is byte-identical across runs.
Docker Desktop's 16 GB VM disk limit silently kills the stack. Kafka dies with "no space left on device" while your host reports tens of gigabytes free, and the only visible symptom is an unrelated timeout against the API. Our preflight check now names it, and the setting to change, before anyone loses an hour to it.
The catalog had no incidents to triage. A static demonstration catalog is pristine by design — which is the correct answer, and a terrible demo. Rather than fabricate findings, we planted a disclosed incident set chosen by a rule fixed in writing before any score existed, and kept the honest separation between what we staged and what the catalog decided.
Accomplishments that we're proud of
It says no, with a reason. Twenty-two of twenty-seven findings score exactly zero, and each one carries a sentence a person can check. Building a tool that reports nothing needs attention today is harder than building one that turns everything red — not technically, but in the discipline it takes to trust the result and ship it.
The numbers reproduce. All five scores came out byte-identical on a second machine, from a clean clone, following the README with no manual steps.
We contributed back. The write-only usageFeatures behaviour is now a filed, reproducible issue against DataHub with the read paths documented.
We wrote down what we did not do. The staged incidents, the receptor axis that does not vary on this catalog, the four-hop lineage cutoff, and the fact that we have never run this against a second catalog — all stated in the repository rather than left to be discovered.
What we learned
Unmeasured is not unused. Every tool we looked at treats missing evidence as good news: no data, no problem. A safety assessor would never accept that. Turning that instinct into a number — where absent evidence raises the score — turned out to be the single most useful idea in the project, and the one nobody else in this space does.
Blast radius is a proxy that stopped correlating. An asset with twenty-four downstream tables can be almost harmless, and the tool that ranks it second in the catalog is not slightly wrong, it is answering a different question from the one the on-call engineer is asking.
A threshold that calibrates itself is a threshold nobody has to defend. We anchored the action threshold to a written reference case instead of fitting it to make the board look good, and left it alone when the result was less dramatic than we would have liked.
What's next for Paracelsus
Ownership as an uncertainty factor. DataHub knows who owns some assets and not others. An asset nobody owns is an asset nobody is accountable for — which, by this model's own logic, is missing evidence and should raise the score. We verified the data supports it and deliberately did not build it under time pressure. It is the strongest single idea we are leaving on the table.
Run it against a real catalog. The architecture is portable and
readme_own_catalog.md documents exactly what needs attention — re-anchoring the bands to your own reference case, skipping the usage-stats workaround, and two hard-coded numbers. What it needs now is a catalog with real drift and real ownership, where the receptor axis actually varies.
Scroll pagination for large catalogs. Dataset enumeration pages through GraphQL search, which is fine into the low hundreds and needs cursor pagination beyond that.


Log in or sign up for Devpost to join the conversation.