(Track 3)
Inspiration
Every week, thousands of scientific preprints are published. While large language models are increasingly used to digest and summarize research, standard prose summaries often obscure underlying methodology, gloss over nuances, and hallucinate causal links.
Science doesn't operate on narrative summaries—it runs on formal causal relationships, variables, and potential confounders. We built PaperLens to help researchers, students, and practitioners inspect scientific papers the way trained methodologists do: through interactive Directed Acyclic Graphs (DAGs).
What it does
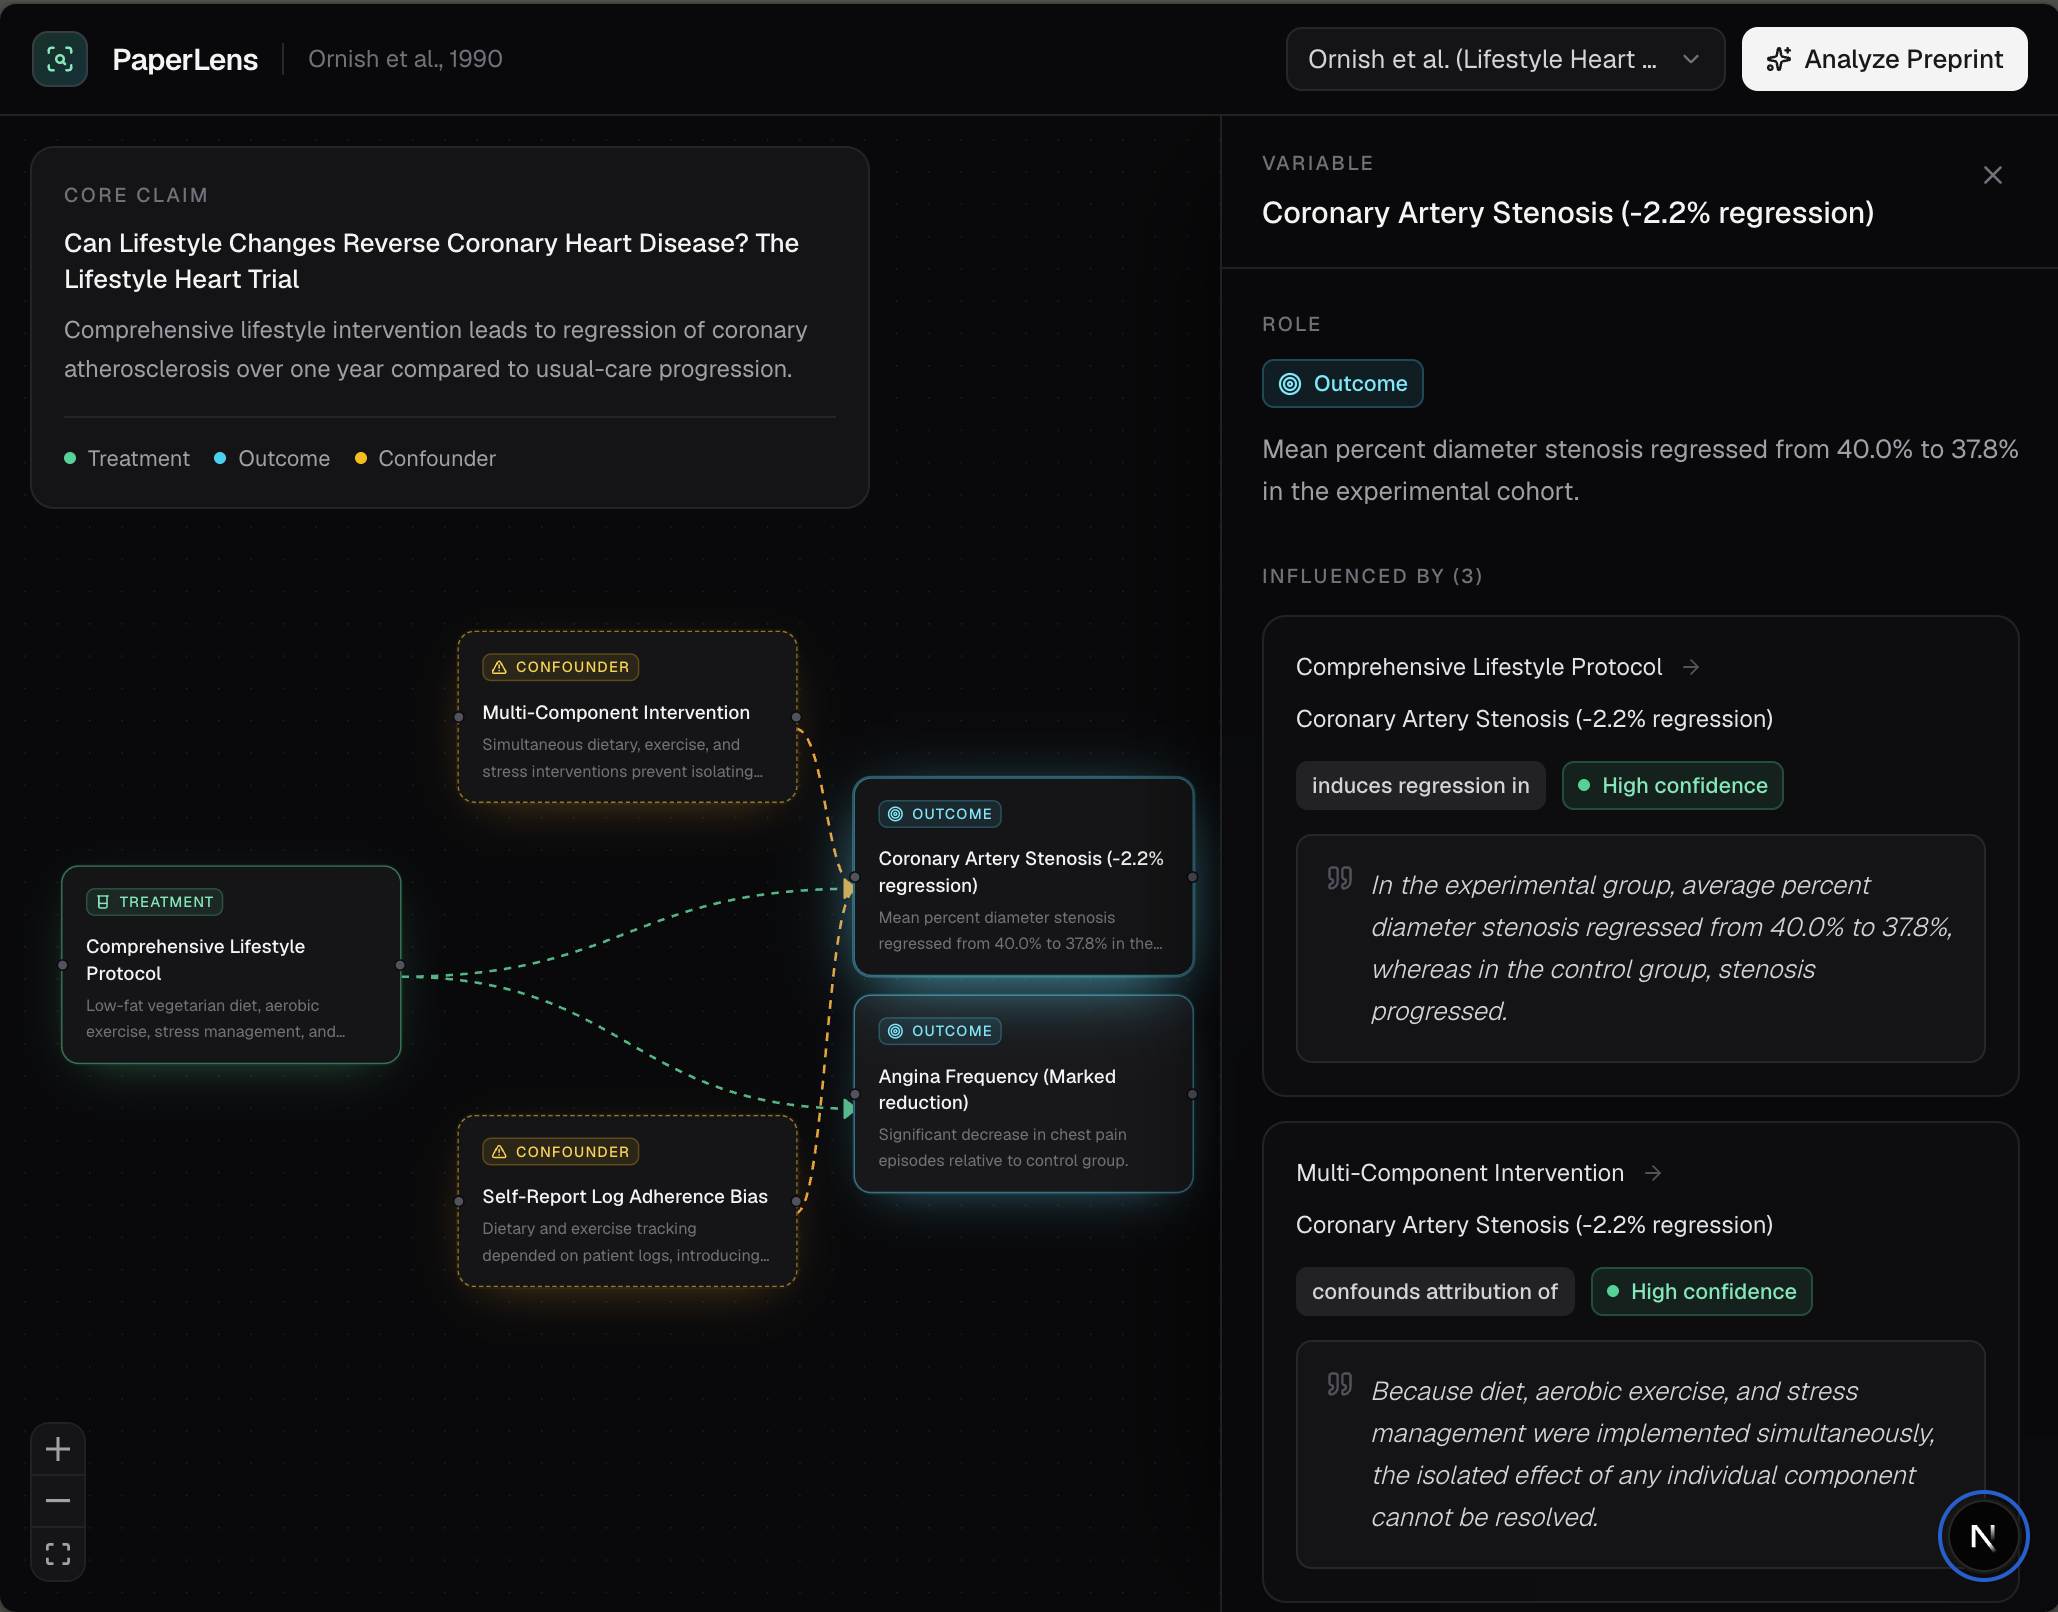
PaperLens ingests research papers or preprints and extracts their core empirical logic into an interactive visual graph:
- Treatment & Intervention Nodes (Green): Identifies independent variables manipulated or evaluated in the research.
- Outcome Nodes (Blue): Maps the primary empirical results and measured metrics.
- Confounder & Limitation Nodes (Amber): Surfaces sampling biases, unobserved variables, and limitations explicitly conceded by the authors.
- Evidence-Backed Edges: Every causal arrow links directly to verbatim quotes and section citations from the paper, categorized by confidence level (High, Moderate, Speculative).
Users can explore pre-analyzed benchmark studies across technology, healthcare, and economics, or paste raw preprint text to generate custom causal graphs on the fly.
How I built it
- Frontend & Graph Visualization: Built with Next.js (App Router), React, TypeScript, and Tailwind CSS. The interactive causal DAG is powered by
@xyflow/react(React Flow) with custom nodes, animated bezier edges, and responsive slide-over drawers. - Reasoning & Extraction Engine: Integrated with Anthropic's Claude models to perform structured extraction of causal variables, edge dependencies, and exact verbatim citations matching a strict JSON schema.
- Preprocessing: Built a text-parsing pipeline that extracts core empirical sections (Abstract, Methodology, Discussion, and Limitations) to optimize latency and token efficiency.
Challenges I ran into
- JSON Schema Strictness: Ensuring the LLM consistently returns node coordinates without overlap and maintains strict relational integrity across treatments, outcomes, and confounders.
- Canvas Viewport Dynamics: Balancing interactive graph layout with slide-over drawers so inspecting evidence doesn't obscure active node clusters.
- Causal Disambiguation: Prompt engineering to accurately distinguish between true causal claims and unaddressed confounding factors highlighted in the authors' discussion.
Accomplishments that I'm proud of
- Delivering a fully functional, highly responsive interactive graph canvas within 24 hours.
- Designing an intuitive color-coded grammar for causal inference that makes complex research understandable at a glance.
- Achieving fast, reliable structured outputs with direct verbatim grounding from the original text.
What I learned
- The nuances of causal modeling (DAGs) and how structural representations communicate information far more effectively than traditional text summaries.
- Advanced node layout, viewport control, and custom edge styling in React Flow.
What's next for PaperLens
- Multi-Paper Synthesis: Rendering comparative graphs across conflicting studies to pinpoint where researchers disagree on causal mechanisms.
- Automated PDF Parsing & arXiv Integration: Direct one-click import from arXiv, bioRxiv, and PubMed URLs.
- Sensitivity Analysis: Simulating how unobserved confounders would affect the strength of observed causal claims.
Built With
- anthropic-api
- artificial-intelligence
- causal
- claude
- data-visualization
- llm
- next.js
- react
- react-flow
- tailwind-css
- typescript

Log in or sign up for Devpost to join the conversation.