-
-
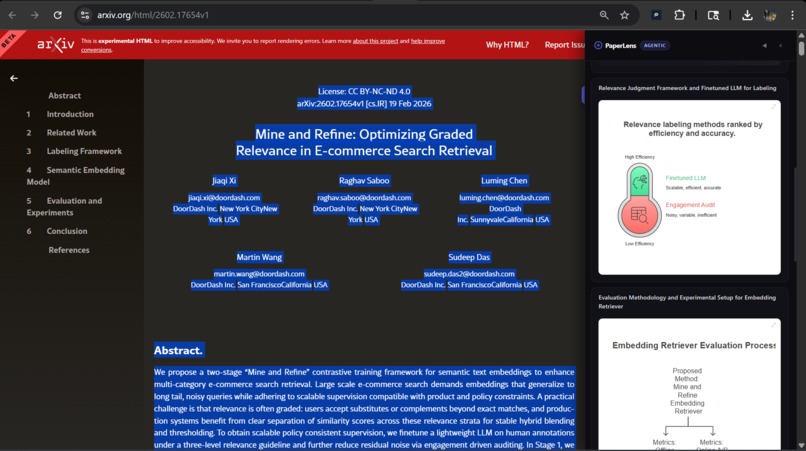
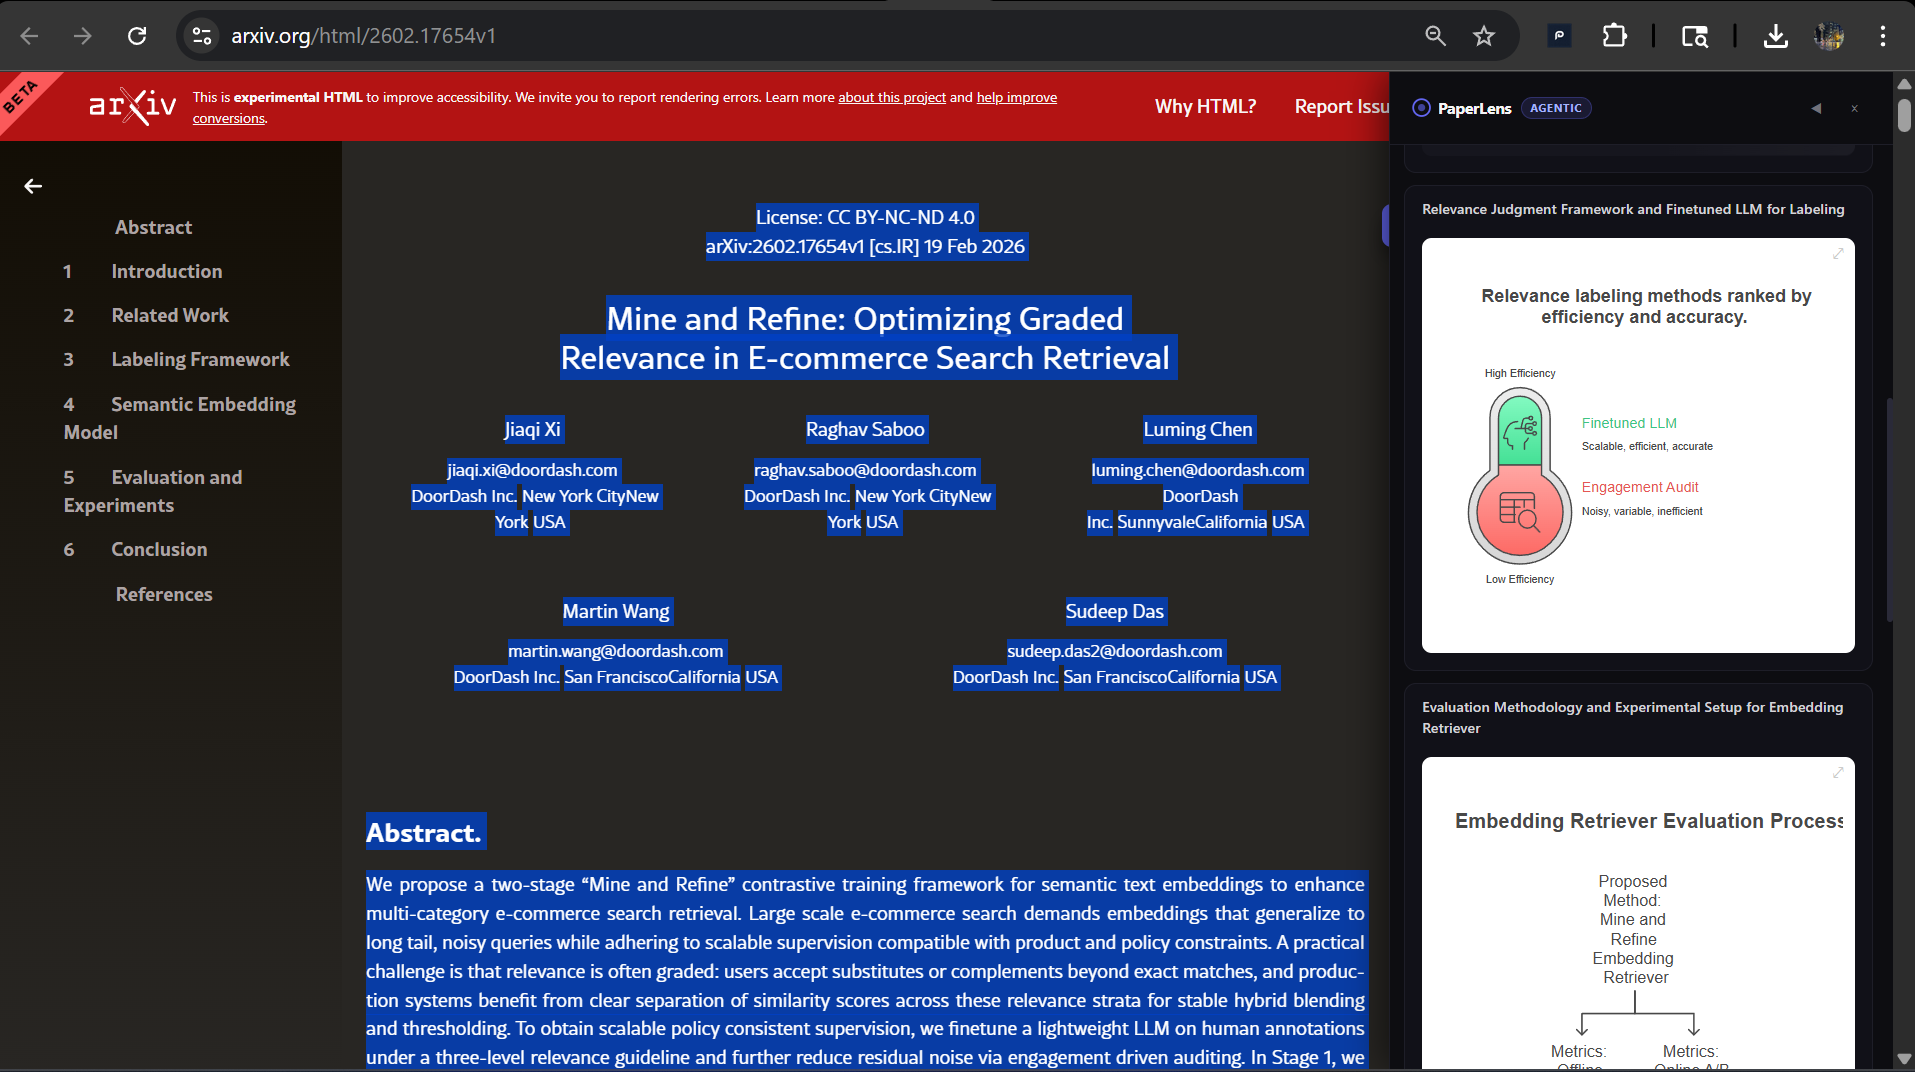
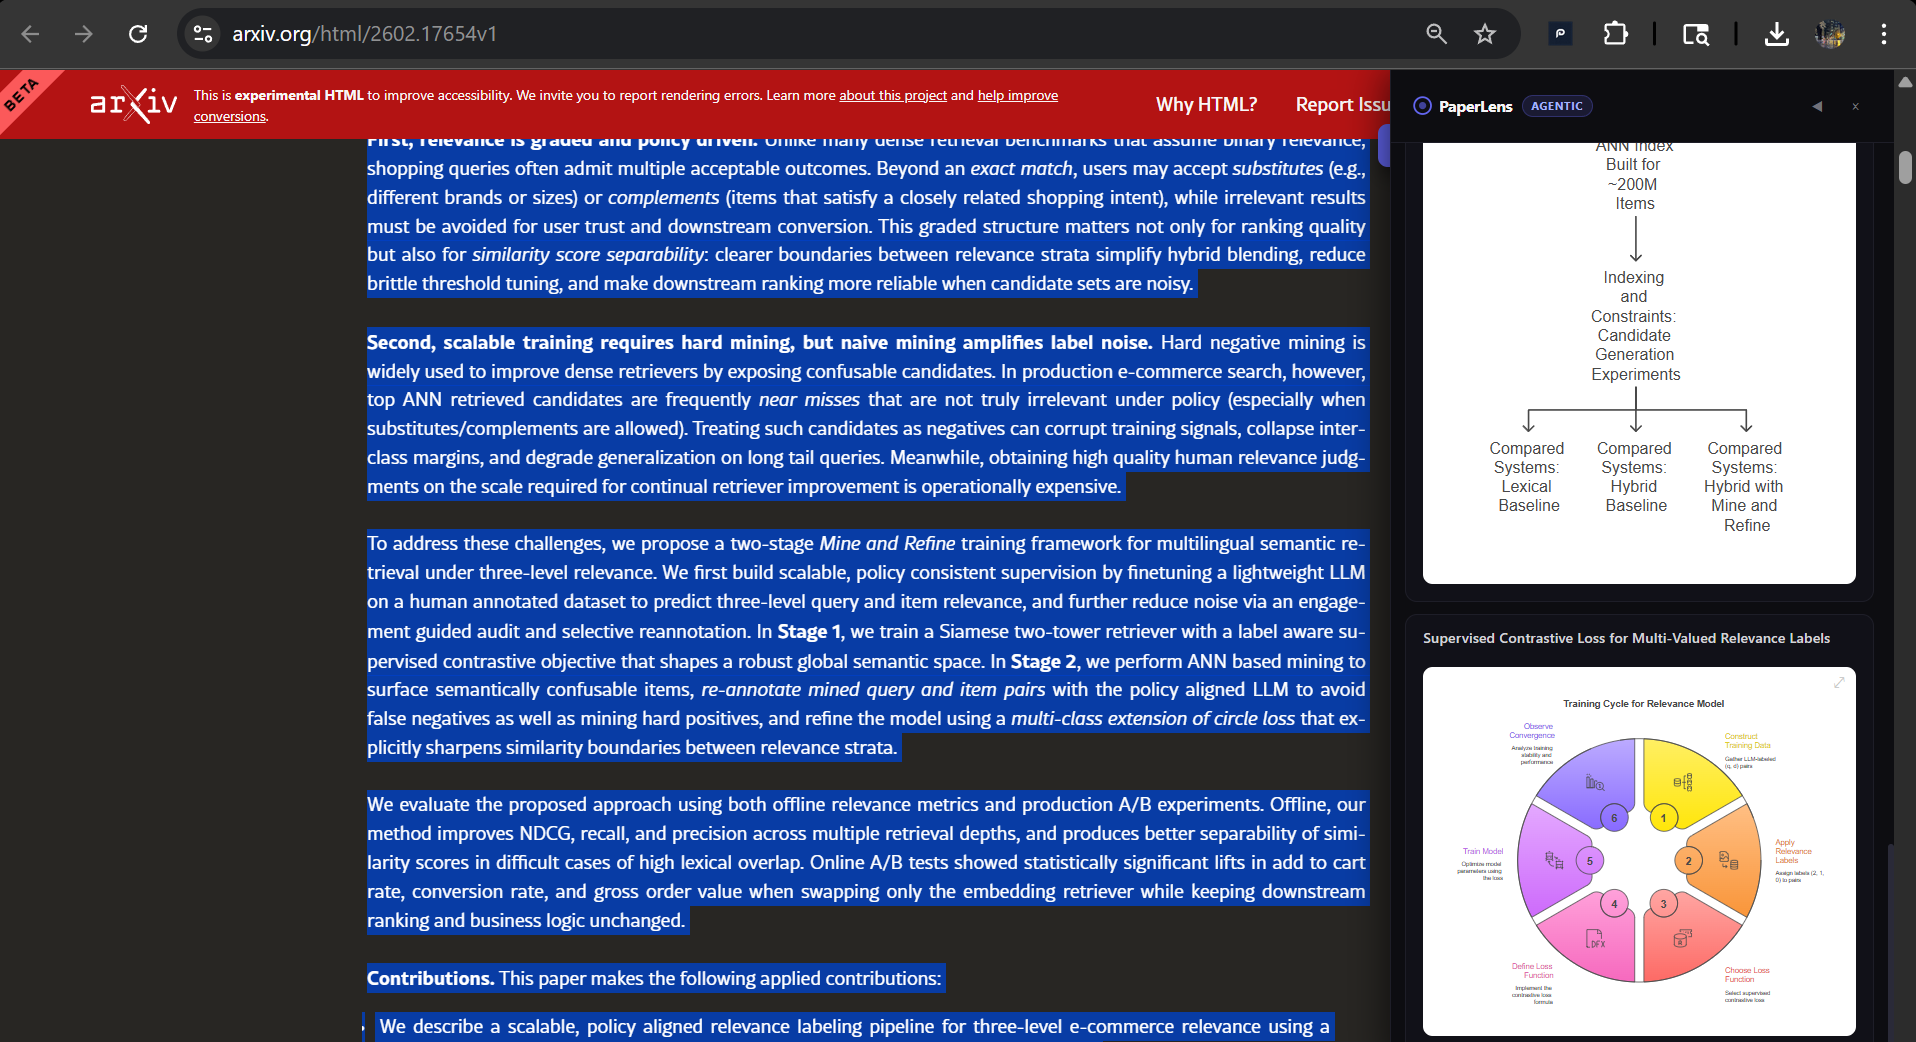
works on any research repository like arxiv (full text 1)
-

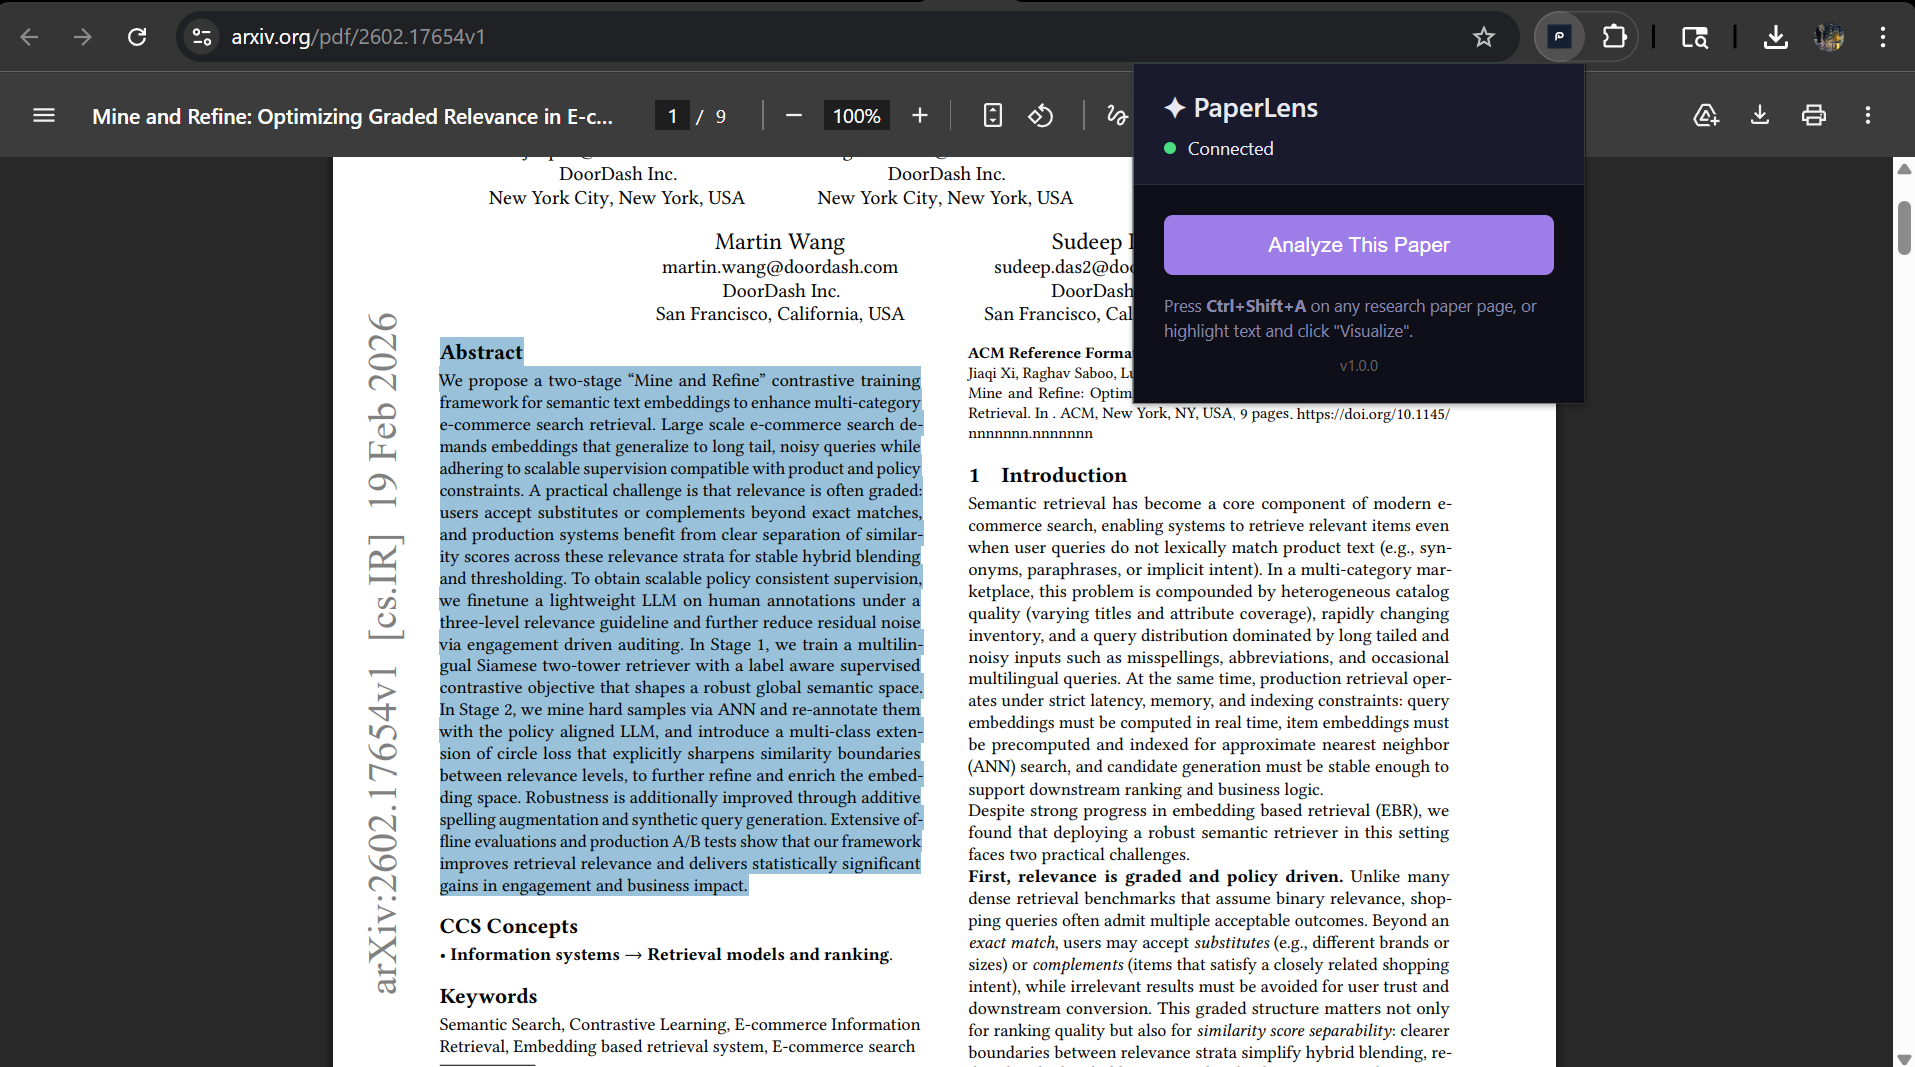
arxiv full text 2
-
arxiv (partial section)
-

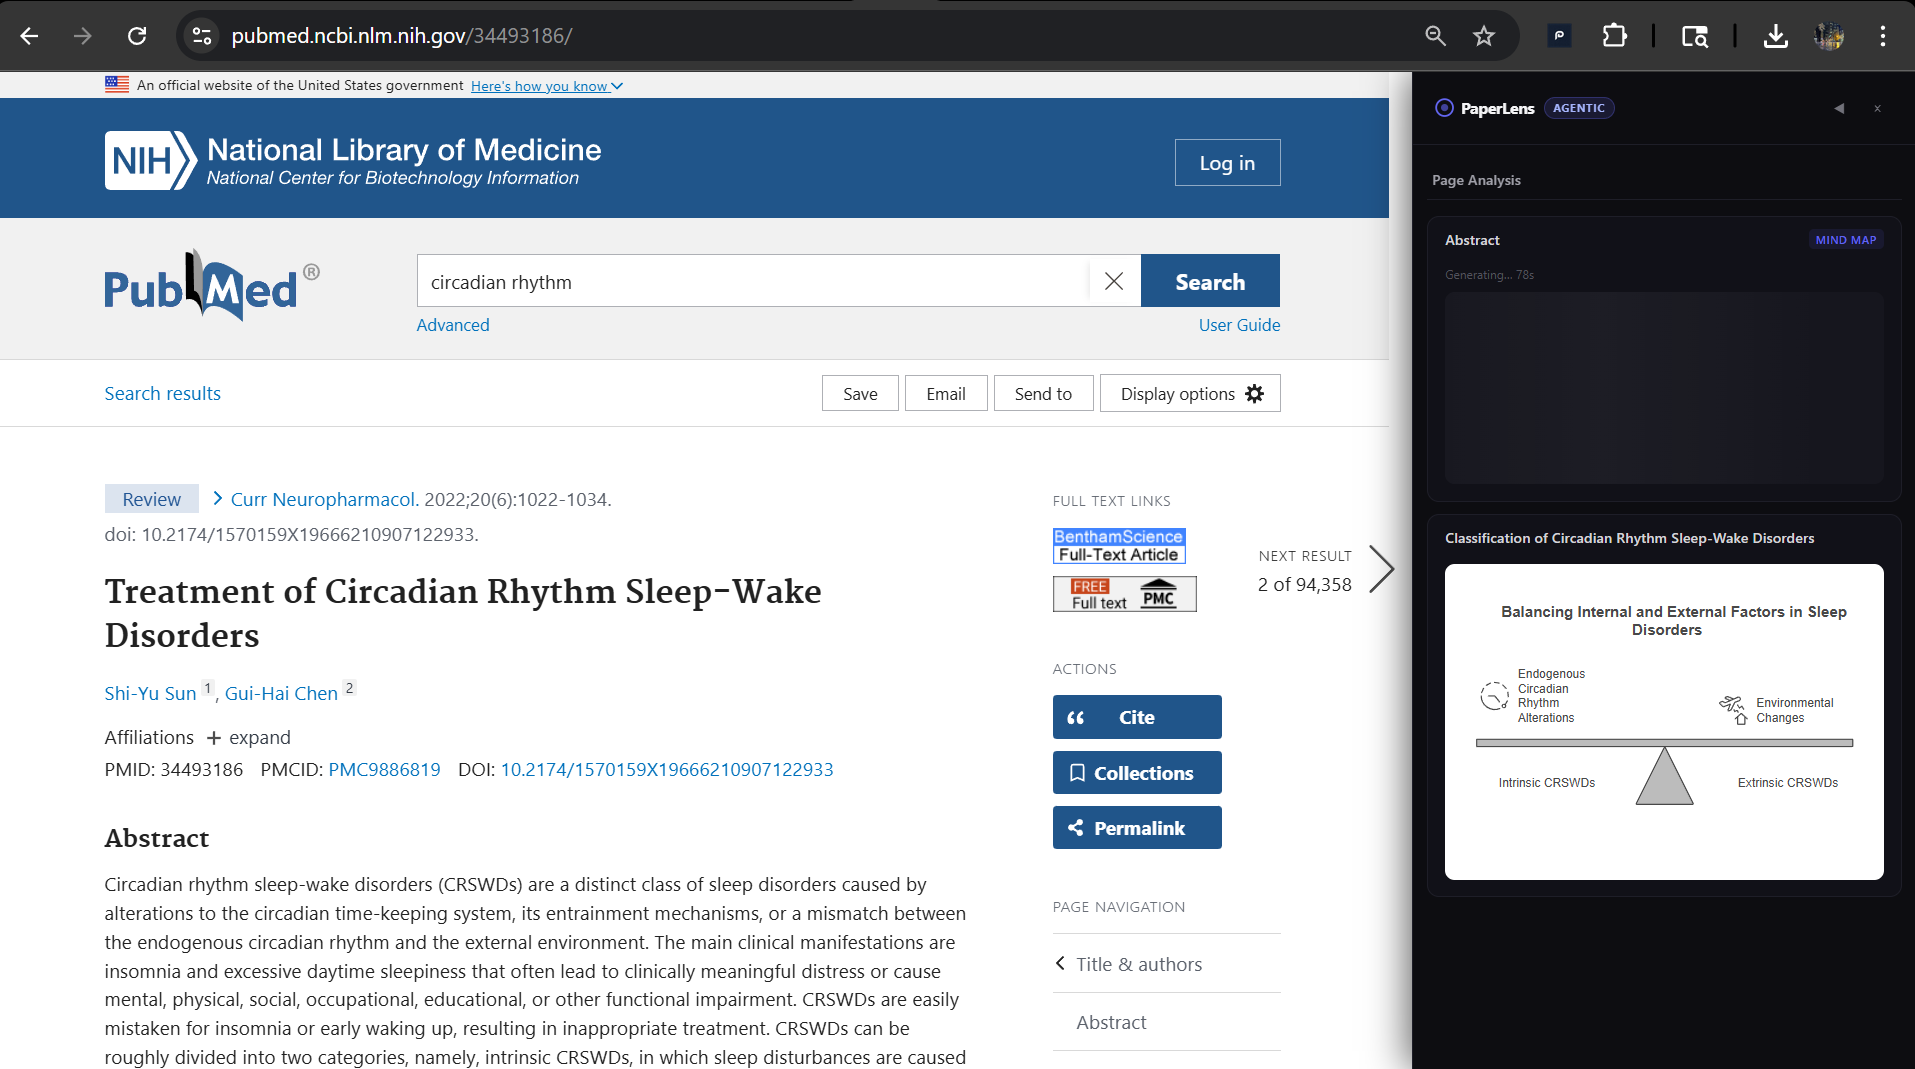
generating visuals on full paper from pubmed
-
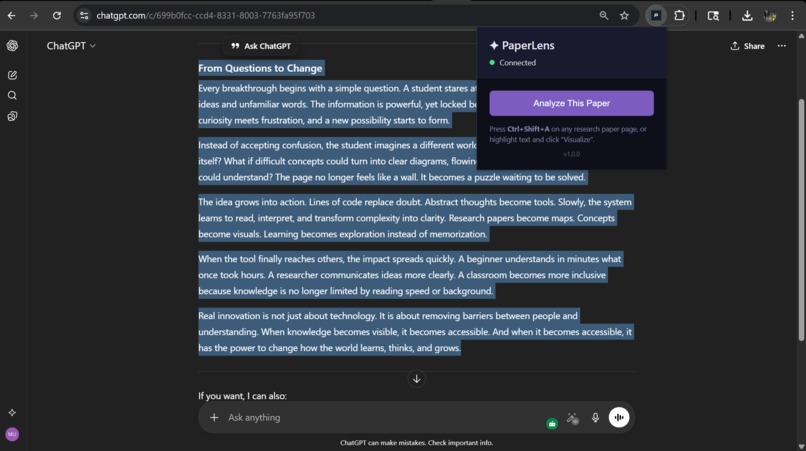
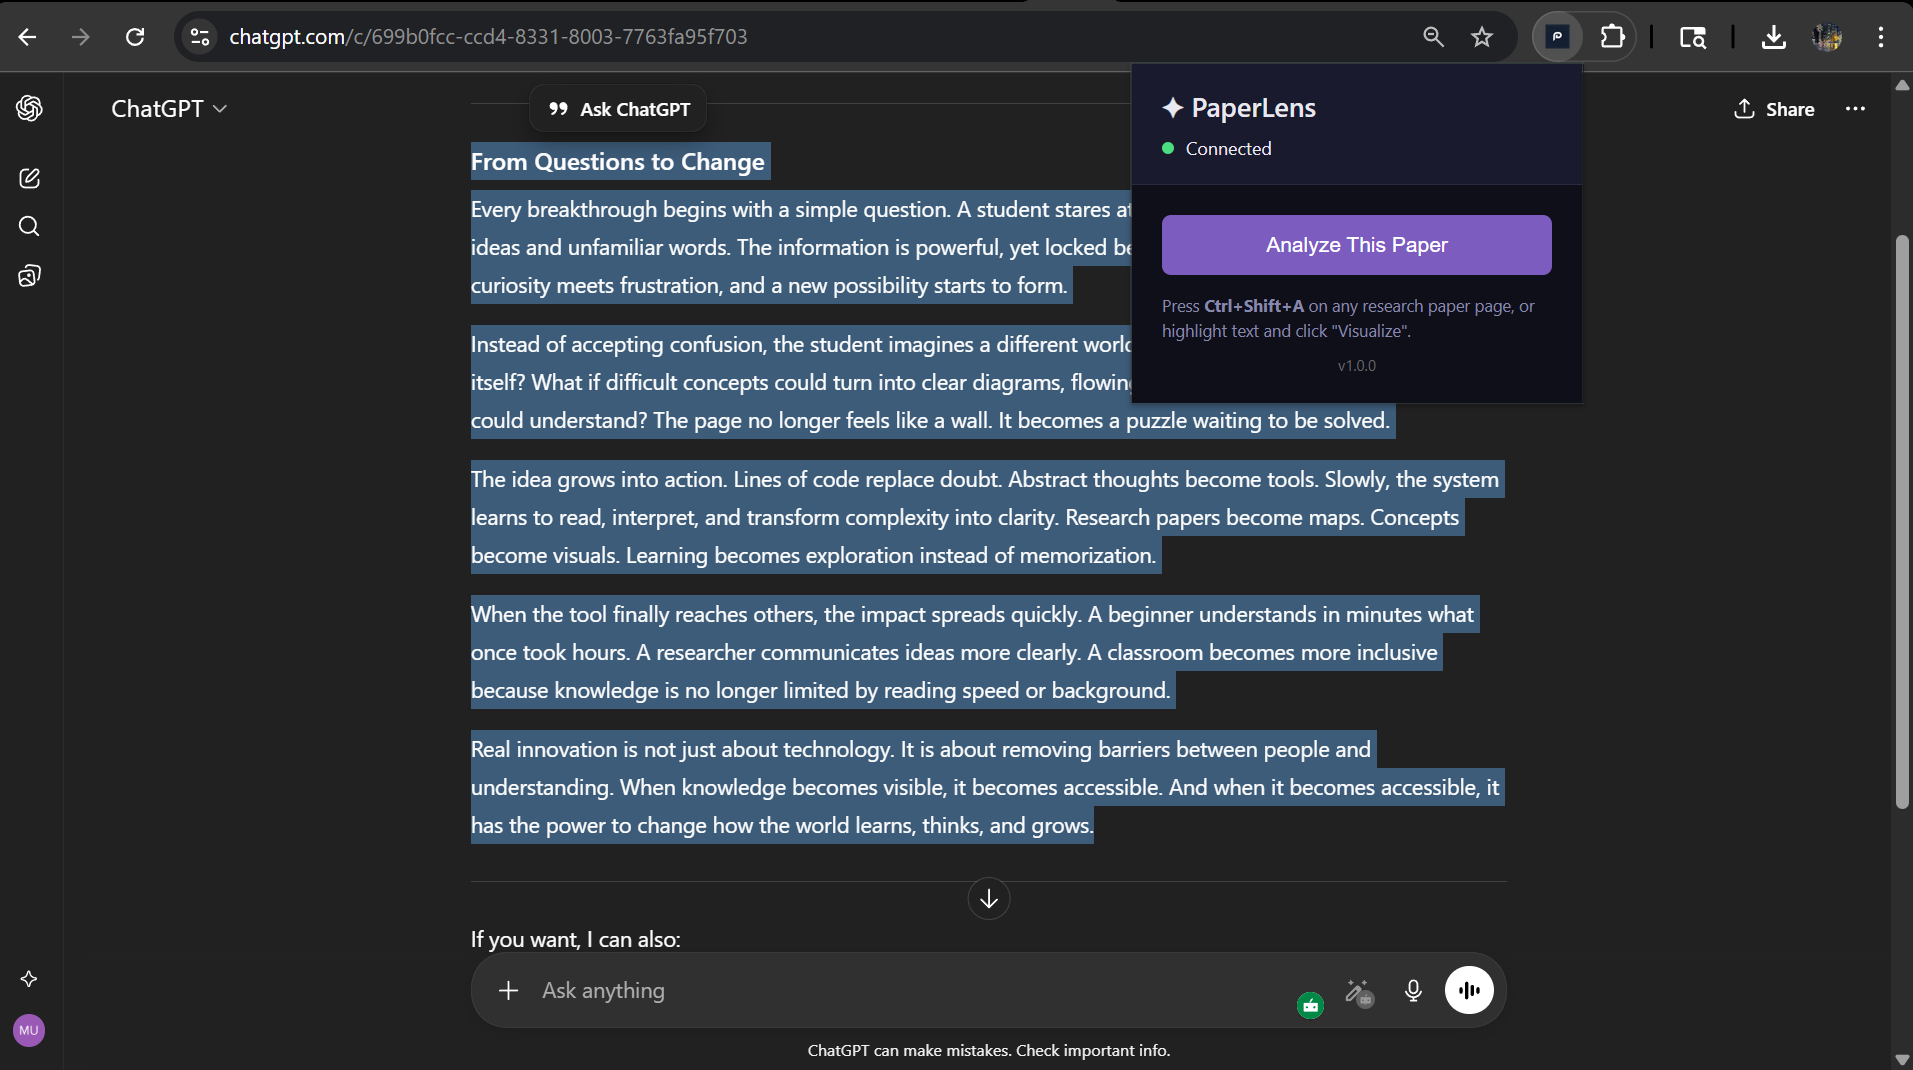
works on chatgpt
-
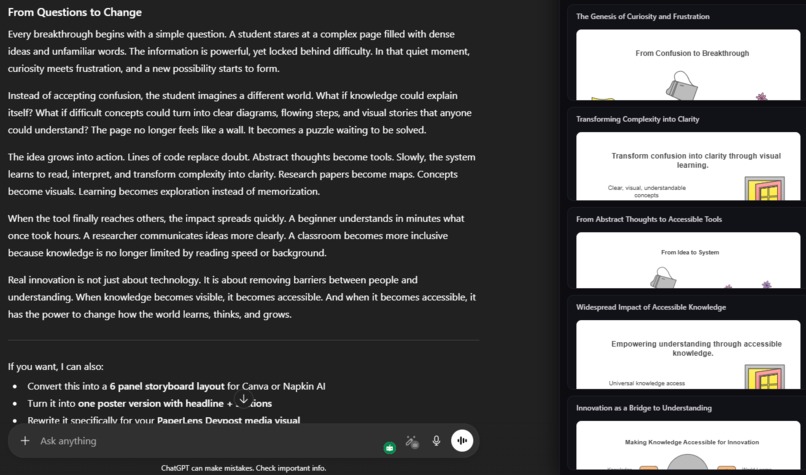
works on gemini
-

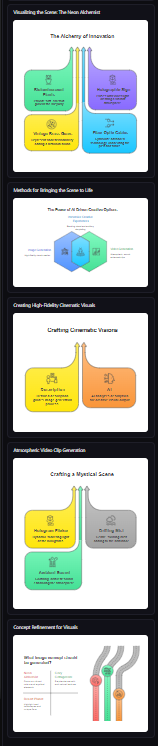
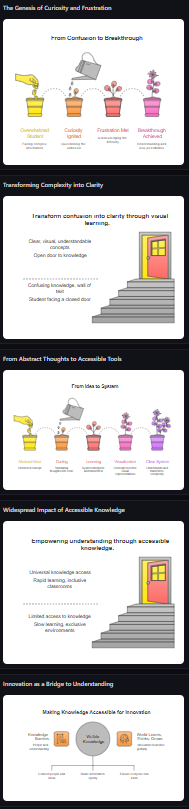
visuals created from random text heavy research paper
-
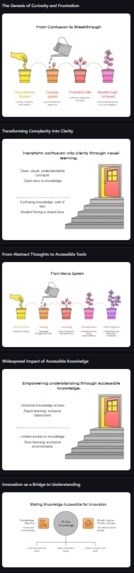
visuals created from random text heavy research paper 1

Inspiration
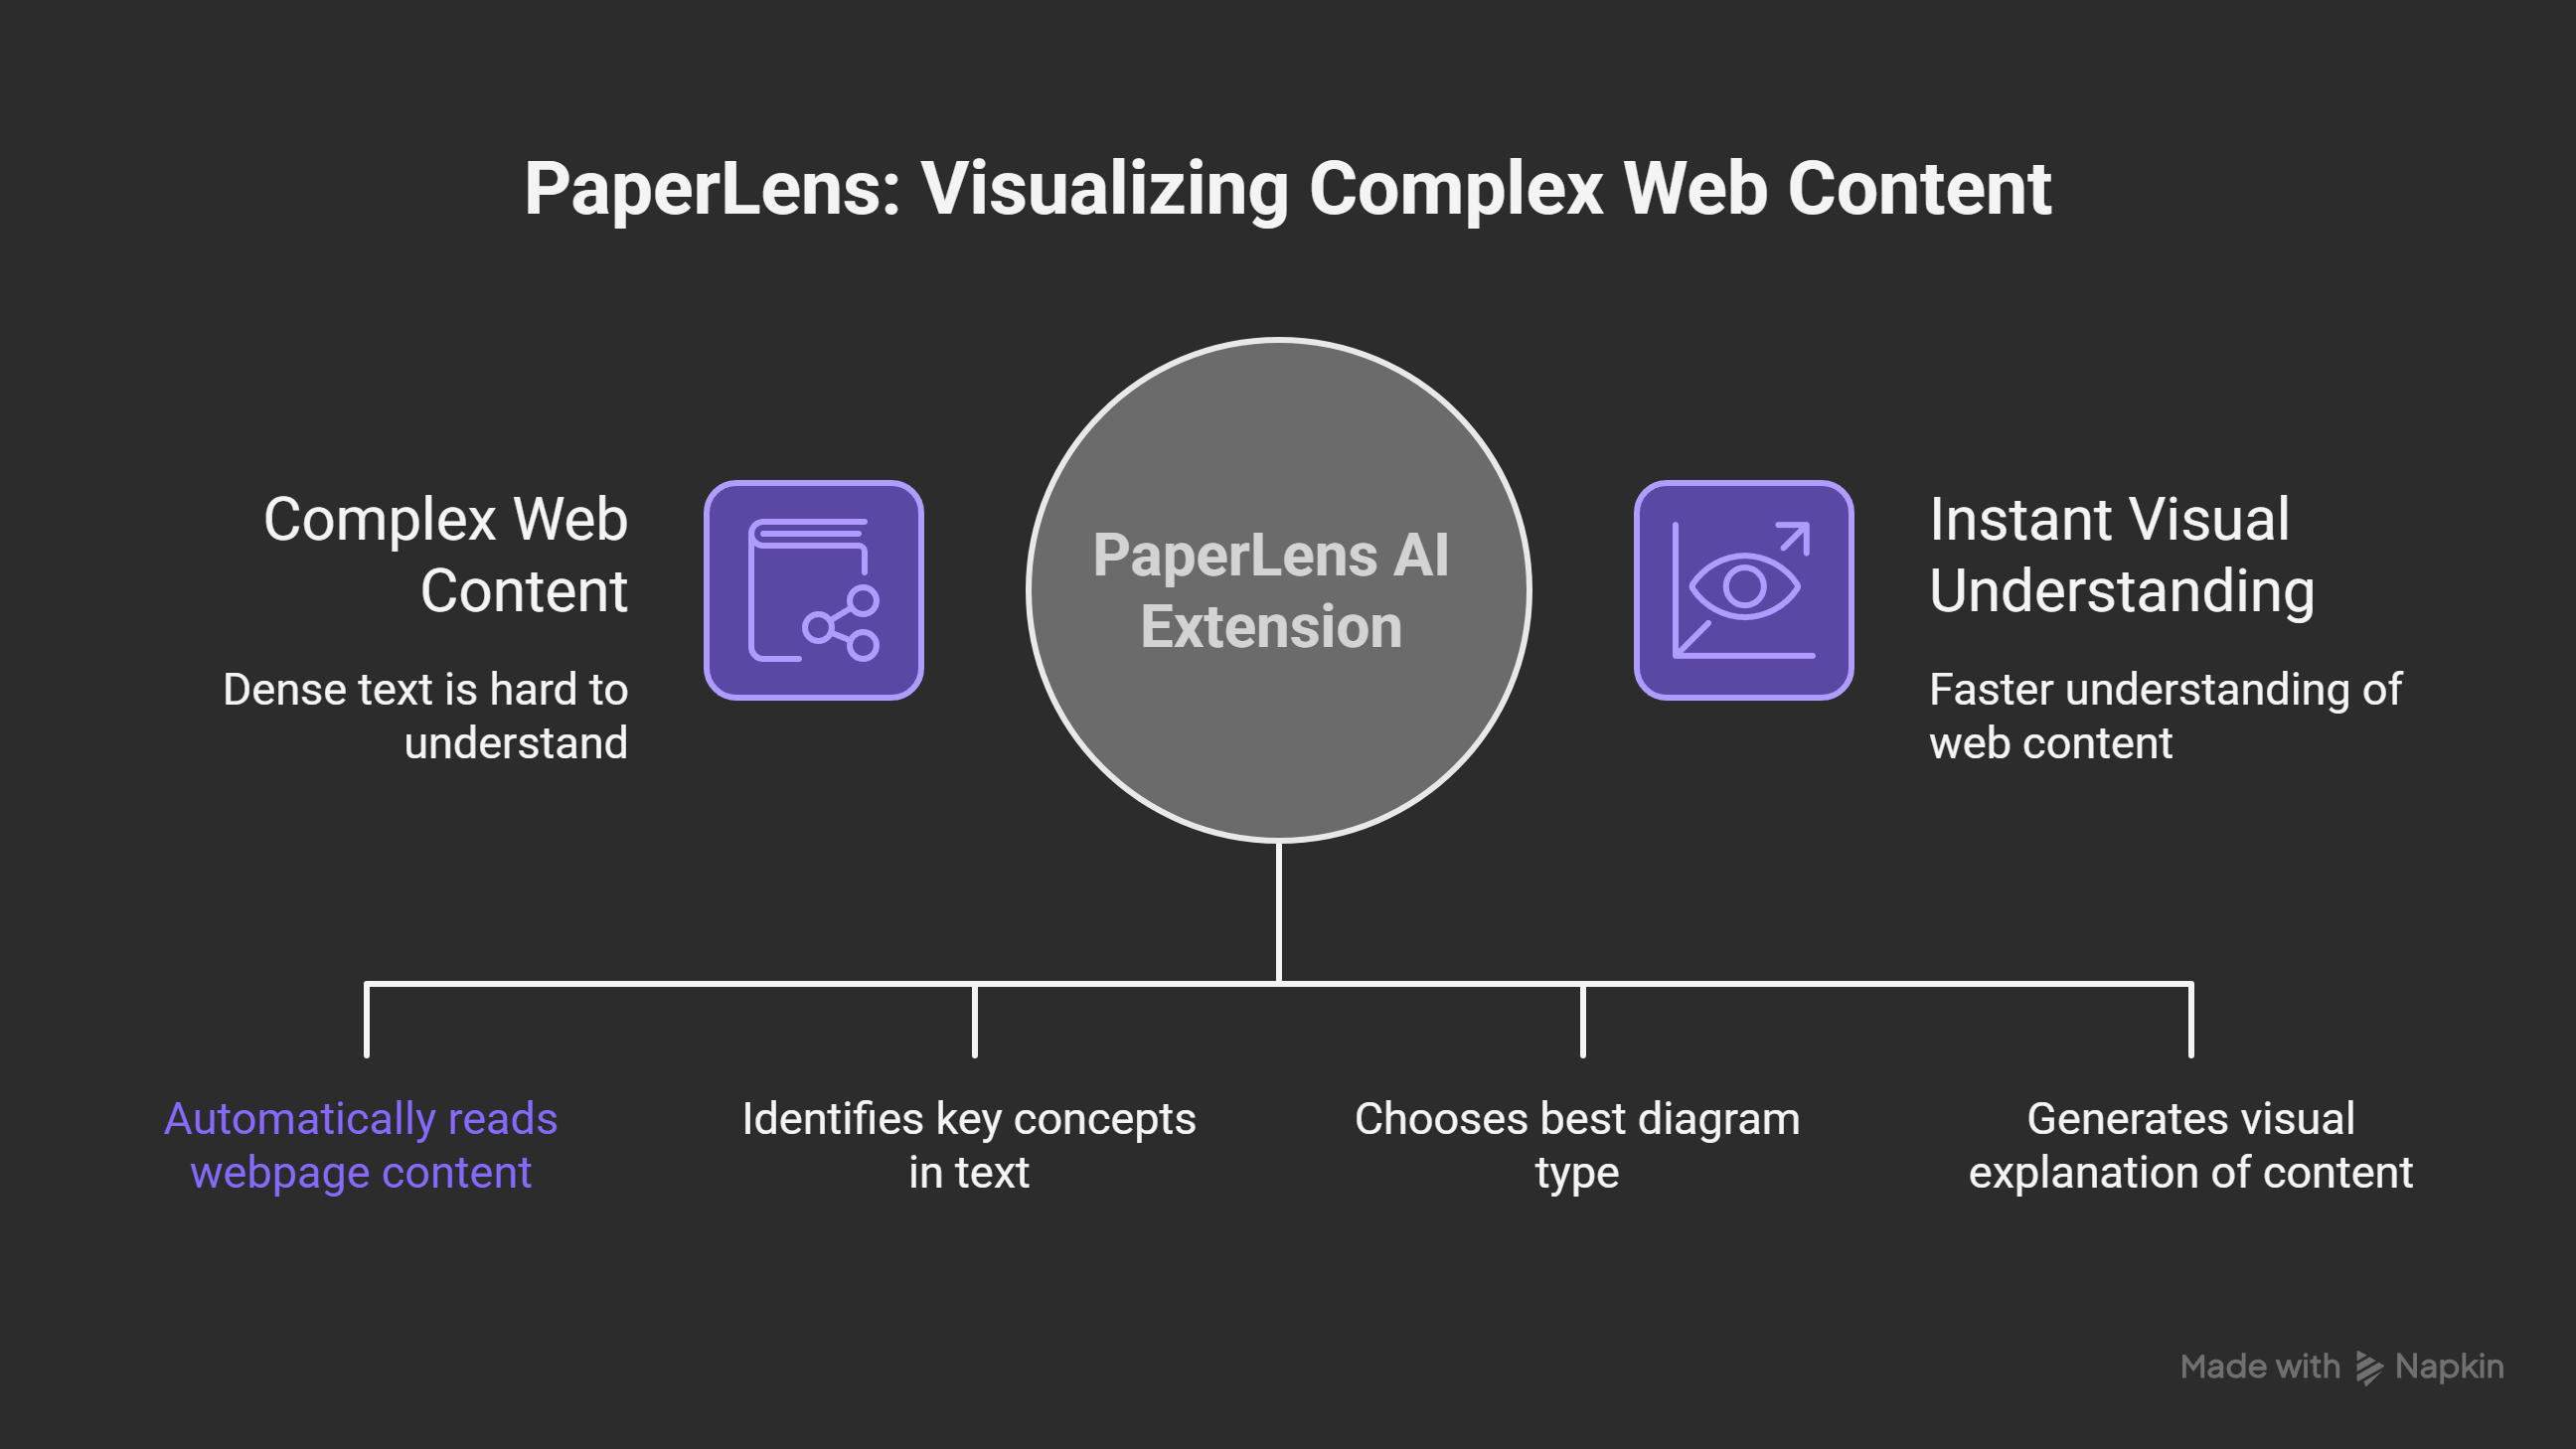
Research papers, technical documentation, and complex articles are often dense walls of text that can be difficult to parse and understand. We've all experienced the frustration of reading through lengthy academic papers or technical articles, trying to grasp complex concepts, processes, and relationships.
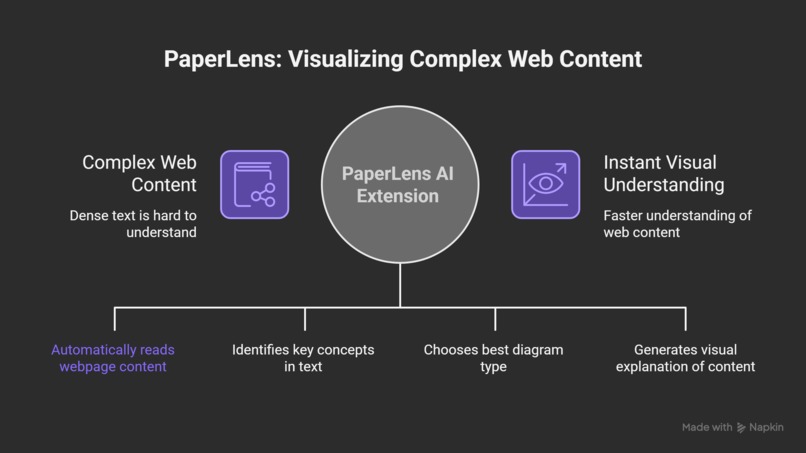
The inspiration for PaperLens came from a simple question: What if AI could automatically identify the most important concepts in any webpage and visualize them as clear, intuitive diagrams? We envisioned a tool that would act as a "lens" through which complex content becomes immediately comprehensible—transforming dense text into flowcharts, mind maps, timelines, and comparison diagrams.
The name "PaperLens" reflects this idea: like a microscope lens reveals hidden structures, PaperLens reveals the structure within text. It doesn't replace reading—it enhances it, providing visual diagrams that complement the written word.
What it does
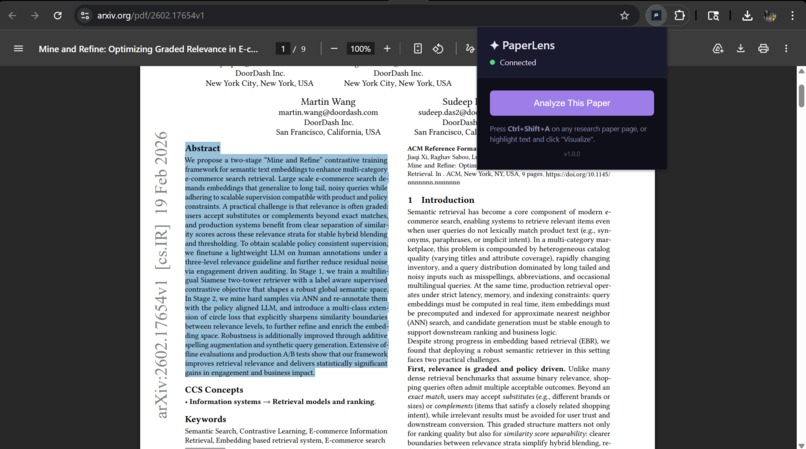
PaperLens is a Chrome browser extension that works on any webpage—research papers, blog posts, documentation, Wikipedia articles, and more. With a single click (or keyboard shortcut Ctrl+Shift+A), it:
- Scrapes the page content intelligently, extracting structured sections while filtering out navigation, headers, and boilerplate
- Analyzes the content using AI agents (OpenAI GPT-4o-mini or Google Gemini) to identify visualizable concepts
- Plans which sections are worth visualizing and what diagram types would be most effective (flowcharts, mindmaps, timelines, comparisons)
- Segments complex content into meaningful chunks optimized for visualization
- Generates beautiful SVG diagrams using Napkin AI's visualization API
- Displays the results in an elegant sidebar overlay, allowing users to explore visualizations alongside the original content
How we built it
PaperLens is built as a full-stack application with clear separation of concerns:
Frontend (Browser Extension)
- Manifest V3 Chrome extension architecture
- Content scripts (
scraper.js,content.js) that extract structured content from any webpage - Background service worker (
background.js) for API communication - Sidebar UI (
napkin-handler.js) that displays visualizations in an overlay panel - Popup interface (
popup.html) for user controls and status
Backend (Express.js API Server)
- RESTful API with Express.js running on Node.js
- Server-Sent Events (SSE) for real-time streaming of visualization results
- Rate limiting middleware to prevent API abuse
- Multi-provider AI support (OpenAI and Google Gemini) with automatic fallback
- Napkin AI integration for diagram generation
AI Agent System
- Planner (
agent/planner.js): Uses AI to analyze page structure and create visualization plans - Evaluator (
agent/evaluator.js): Filters content quality before visualization - Segmenter (
agent/segmenter.js): Intelligently segments text into optimal chunks - Decider (
agent/decider.js): Pre-processes content (handles tables, code, math, long text) - Executor (
agent/executor.js): Orchestrates parallel visualization generation with concurrency limits
Key Technologies
- Node.js + Express.js for the backend API
- Chrome Extension APIs (Manifest V3) for browser integration
- OpenAI API (
gpt-4o-mini) or Google Gemini API (gemini-2.5-flash) for content analysis - Napkin AI API for diagram generation
- Server-Sent Events for real-time progress updates
- Vanilla JavaScript (no frameworks) for lightweight extension code
Challenges we ran into
Content Quality Filtering: One of the biggest challenges was ensuring that only meaningful, visualizable content gets processed. We built a multi-stage evaluation system where the Planner, Evaluator, and Segmenter all work together to filter out noise (navigation elements, citations, boilerplate text) while preserving valuable content.
Rate Limiting: Both the AI APIs (OpenAI/Gemini) and Napkin AI have rate limits. We implemented:
- Concurrency limiting (max 2-3 parallel requests)
- Retry logic with exponential backoff
- Graceful error handling and user feedback
- Rate limit detection and appropriate error messages
Content Segmentation: Long sections needed to be intelligently split into optimal chunks (2000 character limit for Napkin). We developed an AI-powered segmenter that creates meaningful, self-contained segments rather than arbitrary text splits.
Universal Web Scraping: Making the scraper work on any webpage (not just specific domains) required:
- Generic heading detection and section extraction
- Navigation/footer filtering heuristics
- Handling various HTML structures (articles, divs, semantic HTML)
- PDF detection and graceful handling
Real-time Streaming: Implementing Server-Sent Events (SSE) for live progress updates required careful handling of:
- Connection management
- Error propagation through the stream
- Partial results display
- Browser compatibility
Mathematical Content: Handling LaTeX math notation and equations required special preprocessing to ensure they're properly visualized.
Accomplishments that we're proud of
AI-First Architecture: We built a truly agentic system where AI makes intelligent decisions at every stage—from content evaluation to segmentation to visualization type selection. The system doesn't rely on hardcoded rules but uses AI judgment.
Universal Compatibility: PaperLens works on virtually any webpage, not just research papers. It successfully handles blog posts, documentation, Wikipedia articles, and more.
Multi-Provider AI Support: The system seamlessly supports both OpenAI and Google Gemini, with automatic fallback and easy configuration switching.
Intelligent Content Filtering: Our multi-stage evaluation pipeline successfully filters out 90%+ of non-visualizable content while preserving valuable concepts.
Real-time User Experience: The SSE streaming provides immediate feedback, showing users which sections are being processed and displaying results as they're generated.
Robust Error Handling: Comprehensive error handling for rate limits, API failures, timeouts, and edge cases ensures a smooth user experience even when things go wrong.
Clean Architecture: The codebase is well-organized with clear separation between agents, routes, and utilities, making it maintainable and extensible.
What we learned
AI Agent Orchestration: Building a multi-agent system taught us how to design AI workflows where each agent has a specific role and they work together harmoniously. We learned the importance of clear prompts, structured outputs (JSON), and error handling at each stage.
Browser Extension Development: We gained deep experience with Manifest V3, content scripts, service workers, and the Chrome Extension APIs. Understanding the security model and communication patterns between extension components was crucial.
API Integration Patterns: Working with multiple external APIs (OpenAI, Gemini, Napkin) taught us about:
- Rate limiting strategies
- Polling vs. webhooks
- Error handling and retry logic
- API versioning and compatibility
Real-time Communication: Implementing SSE for streaming results gave us hands-on experience with event-driven architectures and managing long-lived HTTP connections.
Content Processing: We learned sophisticated techniques for text extraction, segmentation, and preprocessing—handling edge cases like tables, code blocks, mathematical notation, and various HTML structures.
User Experience Design: Balancing automation with user control, providing clear feedback during long-running operations, and designing intuitive interfaces for complex workflows.
What's next for PaperLens
Enhanced Visualization Types: Support for more diagram types (Gantt charts, network diagrams, entity-relationship diagrams) and custom visualization styles.
Collaborative Features: Allow users to share visualizations, annotate diagrams, and collaborate on understanding complex papers.
Export Options: Export visualizations as PNG, PDF, or editable formats (SVG, Mermaid code).
Offline Mode: Cache visualizations locally and support offline viewing of previously generated diagrams.
Custom AI Prompts: Allow users to customize how the AI analyzes and visualizes content for specific domains or use cases.
Batch Processing: Process multiple papers at once and create a library of visualizations.
Integration with Reference Managers: Connect with Zotero, Mendeley, or other research tools to automatically visualize papers in libraries.
Performance Optimization: Implement caching strategies, reduce API calls through smarter batching, and optimize the scraping pipeline.
Mobile Support: Develop a mobile companion app or Progressive Web App (PWA) version.
Community Features: Build a gallery of user-generated visualizations and allow the community to vote on the best visualizations for popular papers.

Log in or sign up for Devpost to join the conversation.