-
-
Turn Science into Experiments
Inspiration
I have always been fascinated by scientific papers. They contain years of work, difficult ideas, carefully constructed models, and discoveries that can change how we understand the world.
But something has always bothered me: after all that work, the result is usually compressed into a static document.
A paper may describe a dynamic biological system, a physical process, or a mathematical model—but the reader still sees fixed equations, screenshots, and plots. Even when the underlying system is alive with movement and interaction, the publication itself remains frozen.
An equation such as
$$ \dot{x}_1 = \frac{\beta}{1+x_3^n} - \gamma x_1 $$
contains behavior. It can oscillate, stabilize, diverge, or react dramatically to a changed parameter. Yet most readers never get to experience that behavior directly.
This creates a gap between reading research and understanding research. Students may recognize the symbols without developing intuition. Educators must rebuild demonstrations manually. Reviewers have to trace equations, parameters, figures, and supplementary material across many pages. Researchers often spend time reconstructing models before they can even begin exploring them.
I built PaperAlive because I wanted scientific work to feel more tangible.
My goal was not to create attractive animations loosely inspired by a paper. I wanted something much stricter: a system that could transform supported scientific papers into interactive experiments while keeping every equation, parameter, control, curve, and result connected to its original evidence.
The paper should remain the source of truth. The experiment should make that truth explorable.
That idea became PaperAlive: research you can touch—and audit.
What it does
PaperAlive is a Codex-native scientific compiler that turns supported scientific papers into evidence-linked, scientifically verified interactive experiments.
It is deliberately not a free-form visualization generator. A convincing animation is easy to create; a trustworthy scientific representation is much harder.
PaperAlive follows a compiler-style pipeline:
- Extract evidence from a text-based PDF, Markdown document, LaTeX source, or supported data supplement.
- Evaluate compatibility before attempting to create an experiment.
- Resolve equations, symbols, parameters, units, initial conditions, domains, and source locations.
- Compile the evidence into PAER, the typed PaperAlive Experiment Representation.
- Run structural, semantic, dimensional, provenance, numerical, convergence, and invariant checks.
- Execute an independent Python reference calculation.
- Compare the result against a predeclared paper result or scientific invariant when one is available.
- Select a trusted visualization template from an allowlisted renderer registry.
- Build a self-contained offline Experiment Studio.
- Start a local server and return an immediately usable URL.
If a paper does not contain enough information for a defensible model, PaperAlive does not guess. It returns a compatibility report explaining exactly what is missing.
Possible outcomes include:
SUPPORTED_AUTOMATICSUPPORTED_WITH_REVIEWILLUSTRATIVE_ONLYUNSUPPORTED
Missing parameters, undefined symbols, incompatible units, absent initial conditions, unresolved evidence, unsupported mathematics, or unstable numerical results are hard failures—not details to be silently invented.
A concrete demonstration: the repressilator
The main PaperAlive demonstration uses the open-access paper “Data-driven model discovery and model selection for noisy biological systems” by Wu, McDermott, and MacLean.
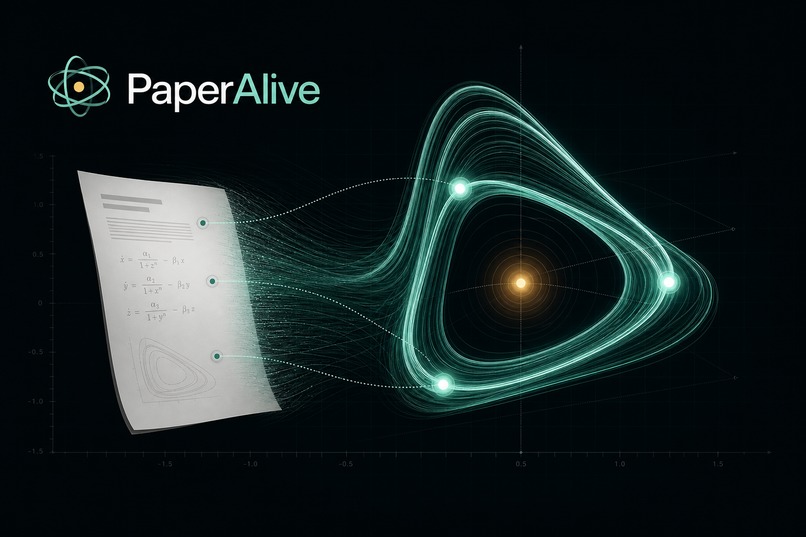
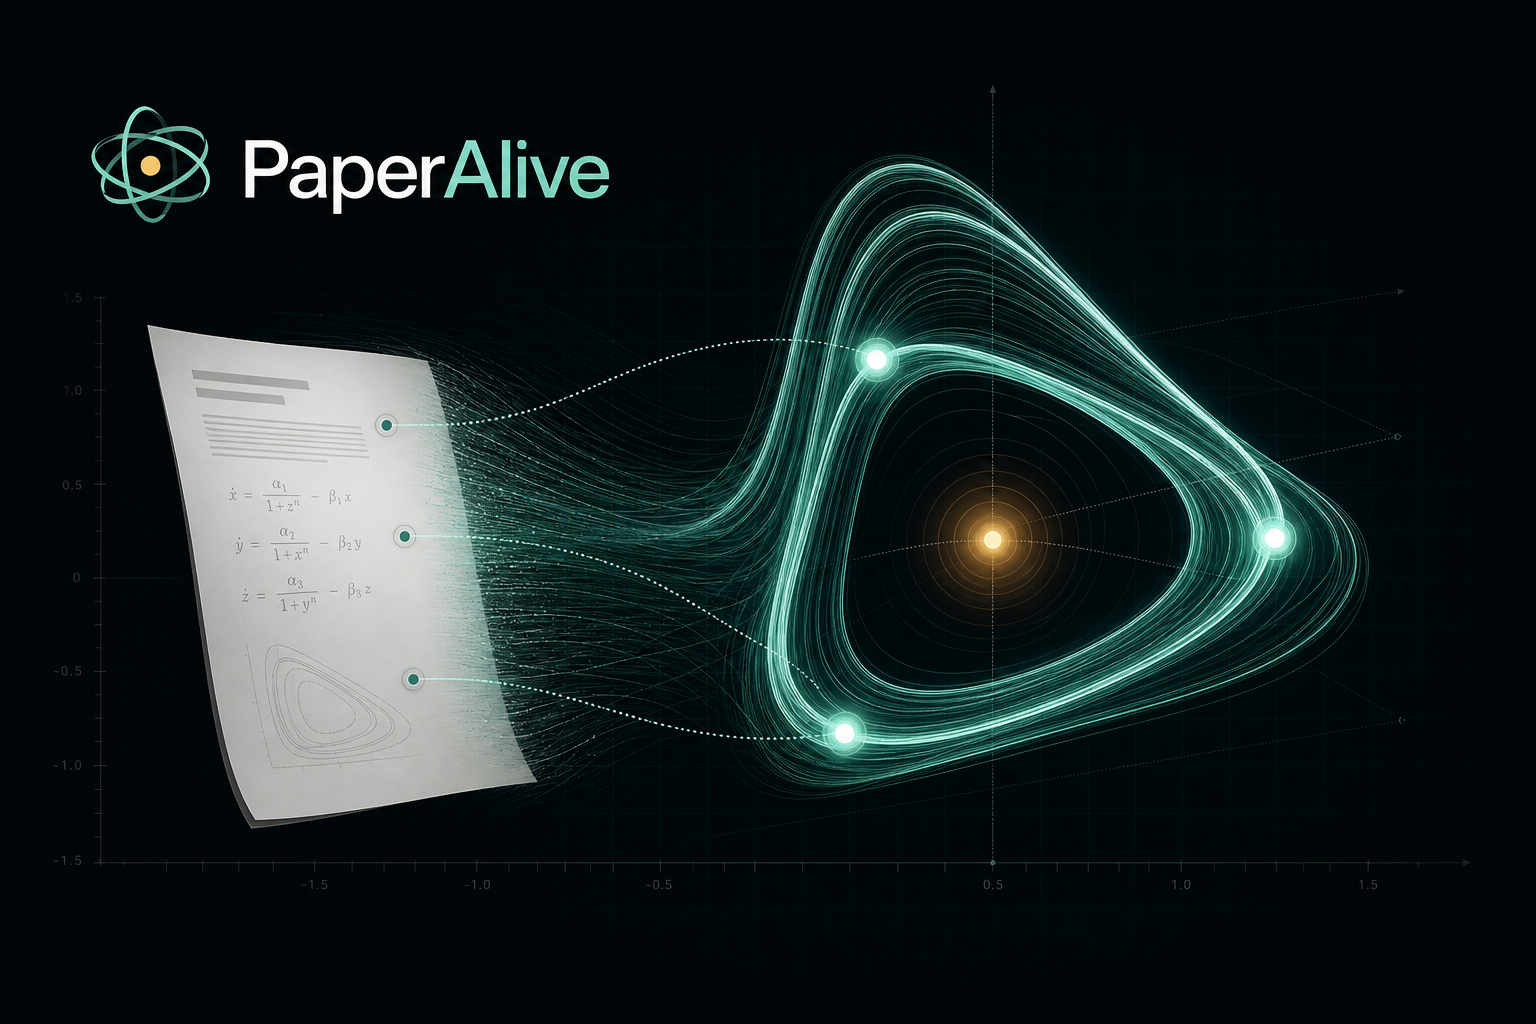
The paper describes a simplified repressilator: three proteins connected through a negative feedback loop. Each protein suppresses the next, producing oscillations that eventually settle into a stable limit cycle.
PaperAlive turns that static model into:
- synchronized time-series plots of all three protein concentrations;
- a labelled three-dimensional mathematical phase space;
- interactive controls restricted to evidenced values and ranges;
- an equation walkthrough;
- comparison with the paper baseline;
- an independent numerical reference calculation;
- a visible trust status;
- and an evidence thread connecting every quantitative element back to the relevant paper location.
A user can select a parameter and immediately inspect its source. Selecting a curve, equation, or phase-space object reveals the evidence behind it. Selecting the evidence returns the user to every connected representation.
The visualization is therefore not separate from the scientific record. It is an interface into it.
Supported experiment types
The current version contains three carefully bounded scientific adapters:
- ODE systems: deterministic models with one to three state variables, shown through time series, phase portraits, and labelled three-state phase spaces.
- Particle systems: deterministic physical or conceptual particles with trajectories, forces, vectors, scale semantics, and invariant checks.
- Scalar fields: evidenced one-, two-, or three-dimensional fields represented through heatmaps, contours, and surfaces.
PaperAlive chooses the representation from validated model semantics. It does not force every paper into 3D.
Who it is for
PaperAlive is designed for:
- students, who need to develop intuition instead of only memorizing equations;
- educators, who want interactive, source-grounded demonstrations without rebuilding every model manually;
- researchers, who want a faster path from publication to exploration;
- reviewers, who need to inspect whether equations, parameters, and reported results agree;
- science communicators, who want engagement without sacrificing scientific honesty;
- and curious readers, who want to experience what a paper actually describes.
How we built it
I built PaperAlive with Codex and GPT-5.6 as an active engineering partner during OpenAI Build Week.
Codex was not used only to generate isolated code snippets. I used it to reason across the entire system: scientific requirements, schema design, security boundaries, numerical methods, frontend behavior, accessibility, test strategy, plugin packaging, and documentation.
I defined the central principle early:
PaperAlive must fail honestly before it visualizes dishonestly.
Codex helped translate that principle into concrete architecture, validation rules, negative test cases, and implementation decisions across the repository.
A typed scientific intermediate representation
At the center of PaperAlive is PAER, the PaperAlive Experiment Representation.
PAER is defined by one canonical JSON Schema. It contains:
- source artifacts and cryptographic hashes;
- precise provenance anchors;
- quantities and units;
- equations represented as a closed abstract syntax tree;
- parameters and initial or boundary conditions;
- model and solver configuration;
- experiment controls;
- visualization mappings;
- validation evidence;
- trust status;
- warnings and limitations.
TypeScript types are generated from the same schema used by Python validation, preventing the frontend and compiler from silently developing different ideas of what an experiment means.
Equations are never stored as executable code. PaperAlive uses a closed, allowlisted mathematical AST and never calls eval, executes author scripts, runs notebook cells, or accepts arbitrary shaders or JavaScript from a paper.
Independent scientific execution
The interactive browser calculation and the scientific reference calculation are deliberately separate.
The frontend uses deterministic TypeScript solvers running inside a Web Worker. The reference path uses Python with NumPy and SciPy. Results are compared using declared tolerances, convergence behavior, paper targets, or appropriate invariants.
This separation matters: if the UI and the reference calculation shared the same implementation, they could reproduce the same mistake.
Camera position, framerate, interpolation, display sampling, and visual scaling are downstream presentation choices. They cannot feed back into the scientific state.
Trusted rendering
Validated PAER semantics are mapped to fixed renderer templates:
- MathJax for accessible equations;
- Plotly for quantitative charts, fields, contours, and surfaces;
- React Three Fiber and Three.js for physical particle trajectories and labelled mathematical phase spaces;
- PDF.js for local evidence inspection.
Unsupported mappings produce an evidence report rather than an improvised scene.
Offline by design
The generated Experiment Studio is a static React application built with TypeScript and Vite.
A completed experiment requires:
- no runtime API key;
- no OpenAI SDK;
- no backend;
- no user login;
- no runtime model call;
- no CDN;
- and no external font service.
After compilation, PaperAlive packages the experiment and starts a verified loopback-only server on 127.0.0.1. The user receives a clickable local URL and an exact command for stopping the server.
This makes the resulting experiment portable, inspectable, private, and suitable for classrooms, review workflows, or sensitive local research environments.
Challenges we ran into
Making AI useful without allowing it to invent science
The biggest challenge was deciding where AI reasoning belongs—and where it must stop.
Codex is excellent at reading context and connecting evidence across a paper. But scientific software cannot accept a value simply because it looks plausible.
The solution was a strict boundary: Codex performs evidence-aware semantic interpretation, while deterministic local code enforces the schema, units, symbols, domains, provenance, numerical behavior, resource limits, and renderer selection.
Any assumption required to make the model run must be explicitly supported. Otherwise, the quantitative build stops.
Treating provenance as part of the product
It was not enough to store a citation somewhere in a report.
Every slider, equation, axis, curve, initial condition, comparison target, and quantitative spatial object needed a stable connection to evidence. That required provenance to become a first-class part of the data model and the interface—not an afterthought.
Separating “looks correct” from “is verified”
Scientific visualization can be dangerously persuasive. A smooth curve and polished 3D scene may hide incorrect equations, broken units, or unstable numerics.
PaperAlive therefore validates before rendering. The weakest critical gate determines the visible trust status, and warnings remain visible even when other checks pass.
Supporting useful papers without pretending to support every paper
Many scientific papers cannot be converted honestly from the publication alone. They may omit parameters, depend on unavailable author code, use unsupported numerical methods, or describe qualitative work without an executable model.
Instead of hiding those limitations, PaperAlive makes refusal a successful outcome. A precise evidence-backed explanation is more valuable than a fabricated experiment.
Building a complete offline experience
The final viewer had to remain interactive without a backend or runtime model connection. That required local rendering, Web Worker simulation, safe package import and export, bundled mathematical accessibility, local PDF evidence viewing, and a secure local preview server.
Accomplishments that we're proud of
I am especially proud that PaperAlive is a working end-to-end system rather than a visual prototype.
The project now includes:
- an installable Codex plugin with a complete
$paperaliveworkflow; - paper and supplement extraction with source hashes and location anchors;
- a canonical typed scientific representation;
- structural, semantic, dimensional, provenance, numerical, convergence, invariant, and reproduction gates;
- independent Python and TypeScript scientific implementations;
- three bounded model adapters;
- a closed renderer registry;
- an offline interactive Experiment Studio;
- local evidence inspection and bidirectional provenance navigation;
- safe package import and export;
- a verified local preview server;
- a real open-access paper demonstration;
- synthetic ground-truth benchmarks for particle and scalar-field behavior;
- and a complete release gate covering linting, types, security architecture, unit tests, scientific evaluations, browser tests, accessibility, offline operation, and plugin validation.
I am also proud of what PaperAlive refuses to do.
It does not turn every paper into a generic 3D animation. It does not execute arbitrary author code. It does not silently choose missing values. It does not claim real-world validation when only numerical verification was performed.
Scientific honesty is not a limitation of the product. It is the product.
What we learned
The most important thing I learned is that trust can be an interaction design feature.
A provenance link does not have to live in a forgotten appendix. It can be something the user touches. Validation does not have to be a hidden build step. It can be visible and understandable. Limitations do not weaken an experiment when they are communicated clearly; they make the result more useful.
I also learned that interactivity changes how a reader approaches a model. Once an equation can be explored, people naturally begin asking better questions:
- What changes if this parameter moves?
- Which behavior comes directly from the paper?
- Which values were derived?
- Does the numerical result converge?
- Where did this curve come from?
- What would make this model unsupported?
Codex was particularly powerful for a project like this because PaperAlive crosses many technical boundaries. It combines document processing, scientific computing, type systems, security, frontend visualization, plugin architecture, and accessibility. Codex helped maintain context across those layers while continuously testing whether the implementation still respected the original scientific principles.
The project reinforced a simple idea for me:
The most impressive scientific visualization is not the one that looks the most complex. It is the one that earns the reader's trust.
What's next for PaperAlive
The current version establishes a strict and testable foundation. Next, I want to expand PaperAlive without weakening that foundation.
Planned directions include:
- More isolated scientific adapters for additional model classes, each with its own evidence requirements, numerical verification, resource limits, and trusted renderers.
- A larger open benchmark library of papers with reproducible interactive experiments and clearly documented compatibility decisions.
- Author workflows that allow researchers to publish a PAER package alongside a traditional paper.
- Reviewer mode for comparing equations, parameter tables, code outputs, and claimed results during peer review.
- Classroom mode with guided questions, parameter challenges, accessible explanations, and instructor-defined exploration boundaries.
- Continuous reproducibility checks that can detect when dependencies, source artifacts, or numerical behavior change.
- Shareable offline experiment packages that preserve evidence, validation reports, results, and the interactive viewer as one auditable artifact.
- Community extension points for new adapters and renderers that must pass the same scientific and security contracts before they can be trusted.
My long-term vision is for interactive, auditable experiments to become a normal companion to scientific publishing.
A PDF should not be the end of a scientific idea. It should be the beginning of an exploration.
PaperAlive gives scientific papers a pulse—without disconnecting them from the evidence that makes them trustworthy.

Log in or sign up for Devpost to join the conversation.