-
-
Baltimore - Food Pantries
-
Analytics & Predictions
Inspiration
Food access is not only about having food available. It is also about having the right resources, in the right places, at the right capacity.
While thinking about food access here in Baltimore, we became interested in a question that sounds simple:
Where should the next food pantry go?
For a nonprofit, answering that question involves much more than finding an empty space on a map.
Who lives around that location? How many people could it reach? What does poverty look like in the surrounding community? Are there already food resources nearby? Would a new pantry expand geographic coverage? And if the location looks promising, could that pantry handle the expected demand with its available food, storage, volunteers, deliveries, and operating budget?
The information needed to explore those questions often lives in different places: Census data, maps, food-resource directories, transportation indicators, environmental data, and an organization's own operational assumptions.
We wanted to bring those pieces together.
That became PantryTwin — a digital planning twin for nonprofits like food pantries.
Instead of treating location and operations as separate decisions, PantryTwin connects them. An organization can choose a proposed location in Baltimore, understand the surrounding community, explore its relationship with existing food resources, simulate how the pantry could operate over 11 months, and compare what changes when that location is added.
We built PantryTwin around a simple belief:
Limited nonprofit resources should be supported by the clearest information we can give them.
Our goal was to turn complex public data into something community organizations can explore, understand, and use when deciding where their resources can expand community reach.
HopHacks Prize Targets
| Track / Sponsor | How PantryTwin fits |
|---|---|
| Bloomberg - Most Philanthropic Hack | Helps nonprofits explore where food-access resources could expand community reach and what it could take to operate a pantry there. |
| OPEF - Environmental Intelligence | Connects food security, geographic access, environmental context, food distribution, and spoilage through geospatial and operational intelligence. |
| Gemini API | Turns PantryTwin's structured location, coverage, scenario, and operational results into natural-language explanations. |
| Auctor - Conversation to Action | Converts an assessment and conversation into an actionable planning report. |
| GoDaddy | Gives PantryTwin a public custom domain for sharing the platform with organizations and community partners. |
PantryTwin is deployed through Vercel directly from our GitHub repository.
Tracks We're Building For
PantryTwin started with food access, but the problem sits at the intersection of philanthropy, food security, environmental intelligence, and technology.
Bloomberg : Most Philanthropic Hack
PantryTwin is built around a question that nonprofits face when resources are limited:
Where can those resources create meaningful community reach?
For food pantries, opening a new location involves decisions about geography, community need, existing services, staffing, food supply, storage, and cost.
PantryTwin brings those factors into one planning experience so organizations can explore a proposed location before committing resources.
Our goal is not simply to identify areas of need. We want to help nonprofits understand how a new service could fit into the community and what resources may be required to operate it.
OPEF : Environmental Intelligence
For us, food security is also an environmental intelligence problem. Food insecurity is shaped not only by whether food exists, but by where resources are located, who can access them, how surrounding community and environmental conditions affect that access, and how efficiently food can be stored and distributed before it becomes waste. PantryTwin brings these signals together using U.S. Census population and poverty data, Census geography, public food-resource locations, transportation and vehicle-access indicators when available, environmental indicators, and user-defined operational assumptions. We use MapLibre GL and Turf.js for GIS mapping, catchments, Census-tract intersections, and coverage analysis; our own digital-twin simulation models food intake, inventory, shelf life, storage, household demand, volunteers, delivery capacity, distribution, spoilage, and cost; and the Gemini API interprets the resulting structured analysis in natural language.
During HopHacks, we built and demonstrated a working Baltimore application where a nonprofit can choose a potential pantry location, understand the surrounding community, estimate population using area-weighted Census intersections, compare new geographic reach with existing food-resource coverage, test different demand scenarios, simulate pantry operations over time, identify resource constraints, track food distribution and spoilage, and compare the system before and after adding the proposed pantry. The decision we want PantryTwin to support is practical: Where could food resources reach people effectively, and what would it take to operate there responsibly? We keep public datasets, calculated estimates, user assumptions, and simulated outcomes distinct so users understand what each result represents. With more time, we would expand beyond Baltimore, replace straight-line catchments with walking, driving, and public-transit travel times, and add deeper environmental intelligence such as heat exposure, flooding and extreme-weather risk, food-desert indicators, refrigeration and energy constraints, real food-waste records, and community-resilience data. Ultimately, we want to understand not only where another pantry could go, but how resilient a community's food-support network is when environmental conditions, demand, or available resources change.
What it does
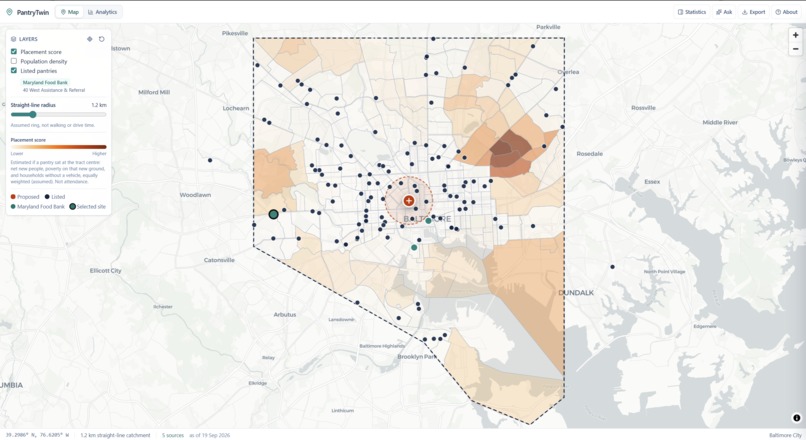
PantryTwin is an interactive location-intelligence and digital-twin simulation platform for nonprofits like food pantries.
It begins with a map.
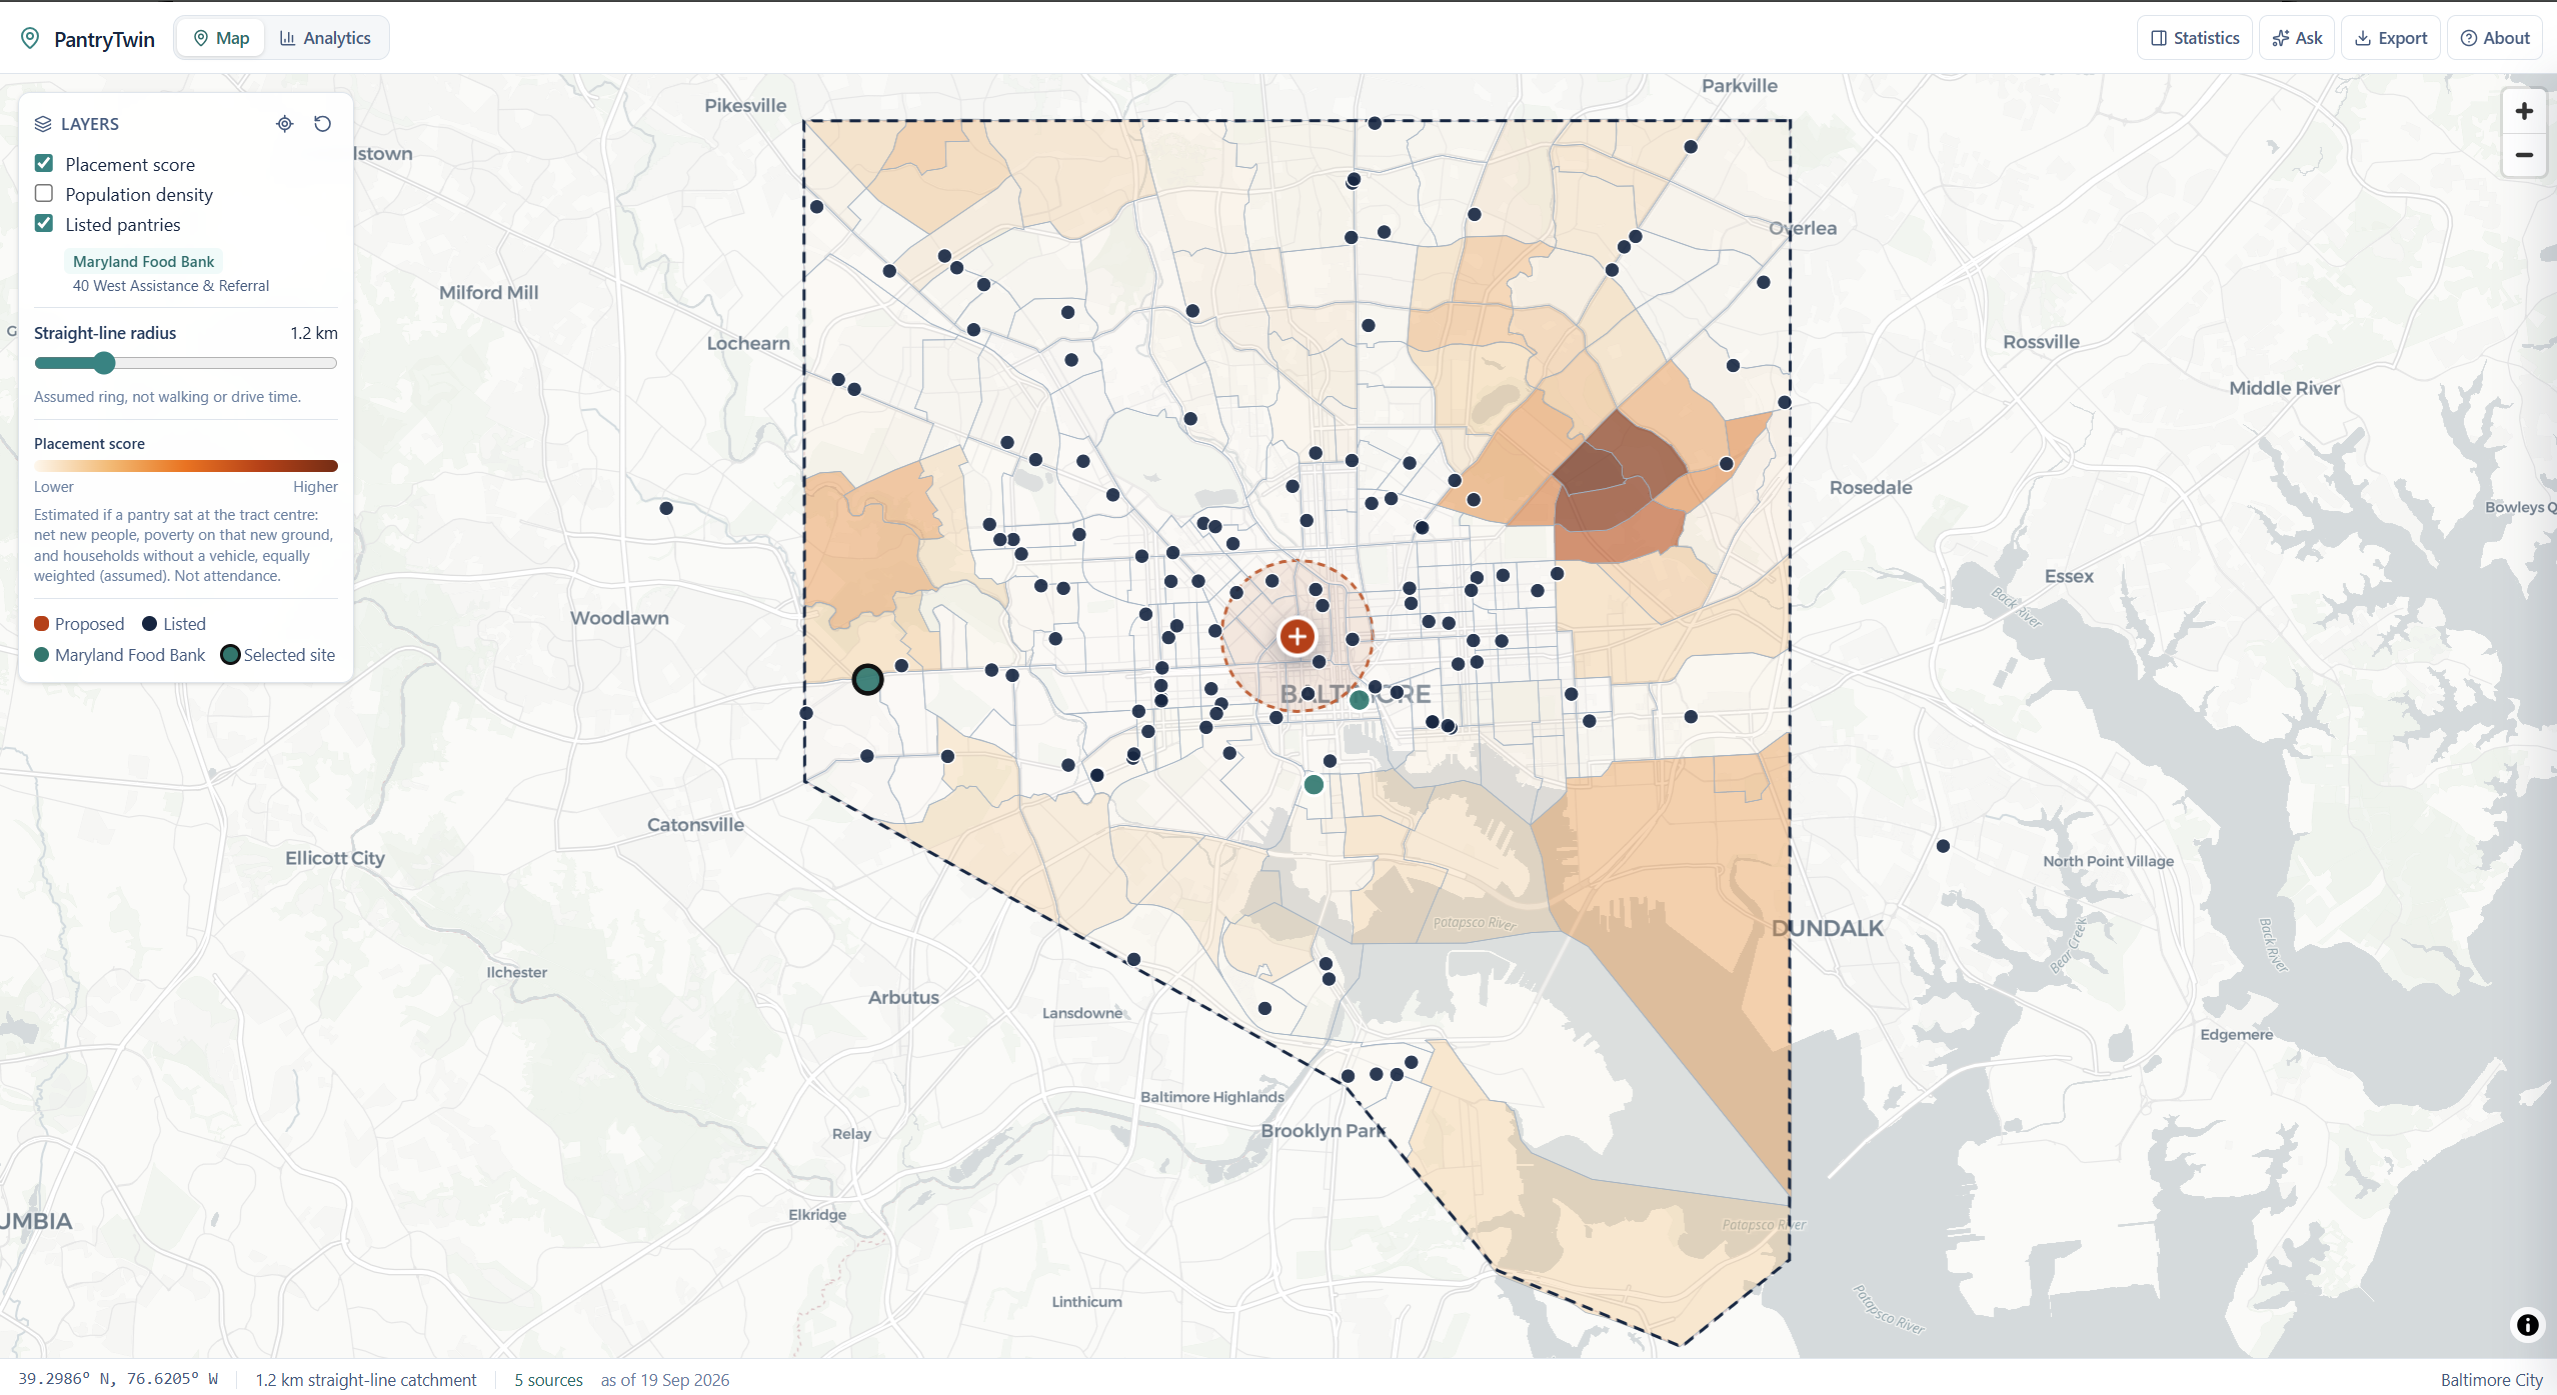
A user can select a proposed pantry location directly in Baltimore and adjust the service radius around it. From that single point, PantryTwin begins building a community and operational assessment.
From a location to community intelligence
PantryTwin combines multiple signals around the proposed location, including:
- population and Census tract information
- poverty indicators
- existing food resources
- geographic coverage
- transportation and vehicle-access indicators when available
- environmental context
- operational assumptions
The platform estimates how many people live within the selected catchment and how much of that geographic reach may already be represented by nearby listed pantry coverage.
This allows organizations to explore an important distinction:
Net-new geographic reach vs. overlapping coverage
A location can appear promising by itself while telling a very different story when nearby services are considered.
PantryTwin also creates placement intelligence using signals such as surrounding population, poverty, nearby resources, geographic reach, vehicle access when available, and overlap with existing pantry coverage.
But we wanted PantryTwin to answer more than "Where?"
We also wanted it to explore:
"What could happen if we actually operated there?"
A 11 months digital twin
After selecting a proposed location, PantryTwin can run a deterministic 11-months operational simulation of the pantry.
Every simulated day considers interacting operational factors including:
- food intake
- inventory
- storage capacity
- shelf life
- spoilage
- household demand
- volunteer throughput
- delivery capacity
- food distribution
- operating costs
Food is distributed using a first-expiring-first strategy so shelf life and spoilage become part of the operational model rather than static numbers.
Users can explore low, medium, and high demand scenarios.
For each scenario, PantryTwin surfaces outcomes such as household visits served, service rate, cost per household, resource utilization, and the operational constraint that becomes the limiting factor.
This lets a nonprofit explore not only whether a location appears promising geographically, but also what resources could be required to operate there.
Baseline vs. Expansion
We then take the idea of a digital twin one step further.
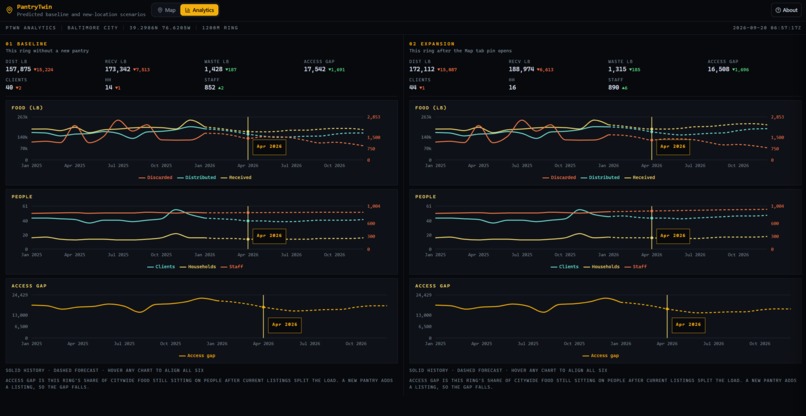
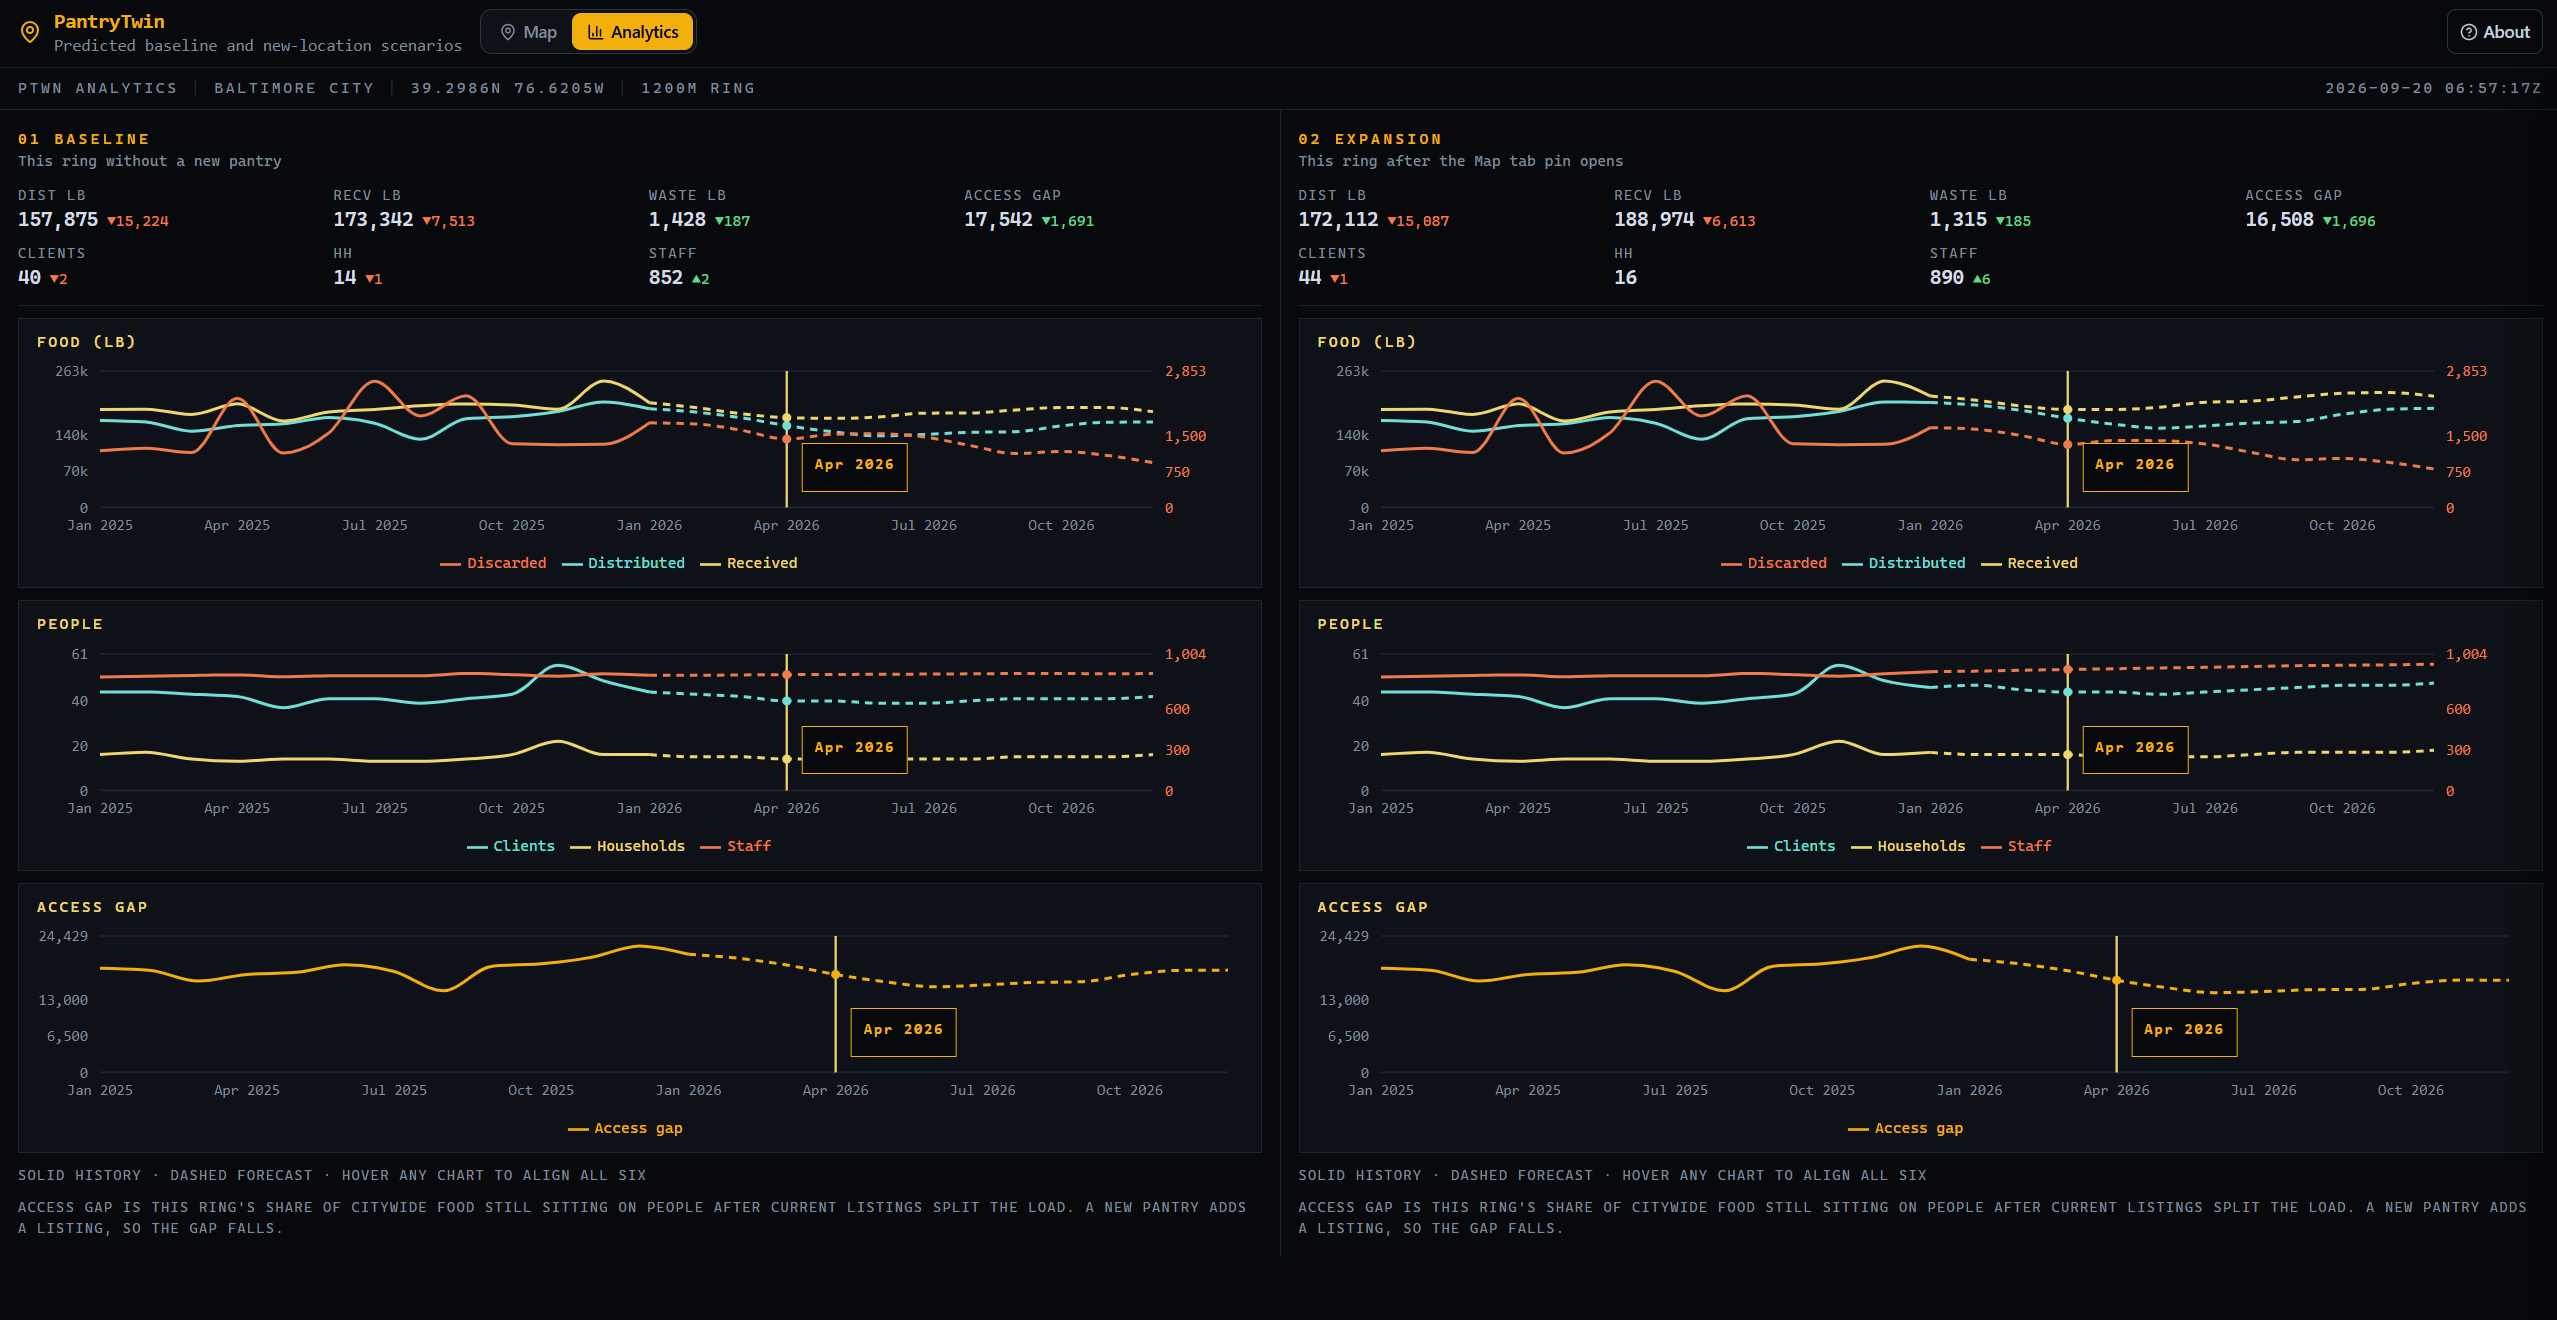
PantryTwin's Analytics workspace compares two modeled systems:
Baseline — the system without the proposed pantry location.
Expansion — the system after adding the proposed location.
Users can compare modeled indicators such as:
- food received
- food distributed
- food discarded
- clients
- households
- staffing
- operational trends
Instead of looking at the proposed pantry in isolation, this comparison helps answer:
What actually changes when we add this location?
That question became one of the central ideas behind PantryTwin.
Making the data conversational with Gemini
A powerful analysis is only useful if people can understand it.
PantryTwin can produce geographic estimates, demographic indicators, placement intelligence, simulation results, operational constraints, and time-series analytics. We wanted that information to remain accessible even to someone who does not work with data every day.
So we integrated the Gemini API as an interpretation layer over PantryTwin.
A user can ask natural-language questions such as:
Would opening here add coverage?
What does this location tell us about community need?
What happens under high demand?
Which resource is limiting service?
How does this location compare with a nearby pantry?
Gemini receives structured context from PantryTwin's analysis rather than being asked to create the underlying metrics itself.
This was important to us.
We wanted AI to serve as a bridge between the analysis and the person trying to understand it.
Instead of simply displaying another dashboard, PantryTwin turns complex planning information into a conversation.
How we built it
We built PantryTwin as a full-stack web application using Next.js, React, TypeScript, and Tailwind CSS.
Geospatial intelligence
For the interactive geographic experience, we use MapLibre GL for mapping and Turf.js for spatial calculations.
When the proposed pantry location or catchment changes, PantryTwin recalculates the surrounding assessment.
One of the most interesting technical problems involved Census geography.
A circular pantry catchment does not conveniently follow Census tract boundaries.
Simply counting the entire population of every tract touched by the catchment could significantly distort the estimate.
Instead, we intersect the selected catchment with Census tract geometry and calculate an area-weighted population estimate.
Conceptually:
Estimated catchment population = Σ (tract population × proportion of tract area inside the catchment)
This gives us a more meaningful planning estimate than treating every intersecting tract as completely inside the service area.
We then combine this geographic model with public food-resource locations, population and poverty information, transportation-related indicators when available, and environmental intelligence.
Simulation engine
For operational planning, we built our own deterministic 11 months simulation engine.
Each simulated day processes food arriving at the pantry, available inventory, shelf life, storage, household requests, volunteer capacity, delivery capacity, distribution, spoilage, and costs.
These factors interact.
More food does not automatically mean more households can be served if volunteer throughput becomes the constraint. More volunteers may have limited impact if inventory or delivery capacity becomes the bottleneck.
That interaction is exactly what we wanted the digital twin to expose.
Analytics
We use Recharts to visualize operational and time-series results and make Baseline vs. Expansion comparisons easier to understand.
AI
We integrated the Gemini API server-side as an interpretation layer.
Rather than asking Gemini to invent planning metrics, PantryTwin provides structured analysis functions for location evidence, location comparisons, scenario results, and limitations.
Deployment
PantryTwin is deployed through Vercel from our GitHub repository and connected to our custom domain, allowing the entire experience to run as an accessible web application.
Our overall pipeline became:
Location → Community Data → Geospatial Analysis → Digital Twin → Analytics → Gemini → Human Decision
Challenges we ran into
One of our biggest challenges was bringing very different types of information into one understandable model.
Geographic coverage, Census demographics, food-resource locations, environmental information, and operational capacity describe different dimensions of the same community.
We needed moving one point on a map to update those perspectives while keeping the experience understandable.
Making geography meaningful
Spatial analysis became one of our biggest technical challenges.
Catchment circles and Census boundaries rarely align. Implementing tract intersections and area-weighted estimates required us to think carefully about what the numbers displayed by PantryTwin actually represented.
Building a real operational model
The digital twin introduced another challenge.
Food availability alone does not determine service capacity.
Inventory, storage, volunteers, deliveries, demand, shelf life, spoilage, and costs all influence one another.
We had to build the simulation so these relationships could be modeled while still producing results that a user could understand.
Making AI useful
We also spent significant time thinking about the role of Gemini.
Adding a chatbot would have been easy.
We wanted something more meaningful.
Gemini needed access to the structured results generated by PantryTwin so its responses could explain the current location and scenario rather than provide generic answers.
One of our biggest technical lessons from the weekend was:
Connecting an AI model is the easy part. Giving it meaningful context is the important part.
Communicating complexity
Finally, we had to make all of this usable.
Maps, demographics, placement intelligence, simulations, scenarios, analytics, environmental information, and AI can become overwhelming quickly.
We separated PantryTwin into connected experiences for map intelligence, statistics, scenarios, analytics, and conversational interpretation while keeping everything centered on the same proposed location.
Accomplishments that we're proud of
We are especially proud that PantryTwin became an end-to-end planning experience, rather than simply another visualization.
One point selected on a map can become:
Geographic assessment → Community profile → Coverage analysis → Placement intelligence → Operational simulation → Baseline/Expansion comparison → AI-assisted explanation
During the hackathon, we were able to bring together:
- adjustable catchment analysis
- Census tract intersection
- area-weighted population estimation
- existing pantry coverage comparison
- placement intelligence
- low, medium, and high demand scenarios
- a deterministic 11 months operational twin
- operational constraint detection
- interactive time-series analytics
- Baseline vs. Expansion modeling
- environmental context
- Gemini-powered interpretation
We are also proud of the transparency built into PantryTwin.
Public data, calculated estimates, model outputs, and planning assumptions do not all mean the same thing. We designed PantryTwin with those distinctions in mind so users can better understand what they are seeing.
Most importantly, everything we built comes back to one human question:
How can limited nonprofit resources be placed where they can expand community reach?
What we learned
This project taught us that building technology for social impact means connecting technical decisions to human decisions.
We learned about geospatial analysis, Census geography, catchment modeling, simulation design, data visualization, environmental intelligence, and building generative AI on top of structured evidence.
But one of our biggest lessons went beyond the technology.
We learned that a digital twin does not have to represent a factory, vehicle, or machine.
It can represent a community service that does not exist yet.
It can give people a space to ask what if? before committing limited resources.
We also gained a much deeper appreciation for uncertainty.
A Census estimate, a catchment calculation, an operational assumption, and a simulated outcome each tell us something different. Communicating those differences is just as important as calculating the numbers themselves.
Throughout the hackathon, we kept returning to one idea:
Good data becomes much more powerful when people can actually explore it, question it, and use it.
What's next for PantryTwin
Baltimore is our starting point.
Our next step is expanding PantryTwin from a Baltimore food-access planning prototype into a reusable planning platform for community organizations.
We want nonprofits to eventually be able to bring their own service locations, capacity information, operating assumptions, and community data into PantryTwin and create digital twins tailored to their programs.
We also want to move beyond straight-line geographic catchments by incorporating walking, driving, and public-transit accessibility.
Future versions could support multi-location analysis, service-network optimization, volunteer and delivery routing, longer-term operational simulations, additional environmental and community-resilience indicators, and richer scenario comparisons.
And the underlying idea extends beyond food access.
The same framework could potentially support planning for:
Community health programs • Shelters • Resource centers • Cooling centers • Disaster-response hubs • Distribution sites • Other location-based nonprofit services
PantryTwin started with food pantries because it gave us a meaningful way to explore how geography, community need, operations, public data, and AI can work together.
Our long-term vision is broader:
Help community organizations understand where resources are needed, model how those resources could operate, and make complex planning information easier to understand.
And our vision for the experience remains simple:
Choose a location → Understand the community → Model the operation → Turn analysis into action.
Contributions
Raisa Nusrat Chowdhury: I primarily developed the backend, analytics, and forecasting system for PantryTwin. I built the core digital-twin and network-comparison backend, including API routes, operational simulation logic, data-processing and ingestion pipelines, dataset integration, location-specific analytics, and backend testing. For the forecasting component, I implemented a Ridge Regression–based time-series forecasting model in TypeScript to predict key pantry operational metrics, including food distributed, food received, food waste, clients served, households served, and staff hours. The model incorporates temporal trends, seasonal sine/cosine features, and historical lag features to generate future operational forecasts. I also integrated the forecasting outputs into PantryTwin’s baseline-versus-expansion analysis, allowing the system to compare current operations with simulated future scenarios and provide location-specific insights that are then visualized through the frontend.


Log in or sign up for Devpost to join the conversation.