-
-
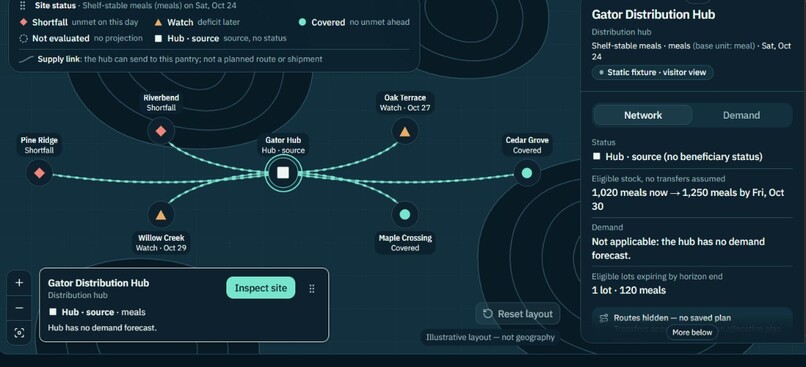
Gatorhub
-
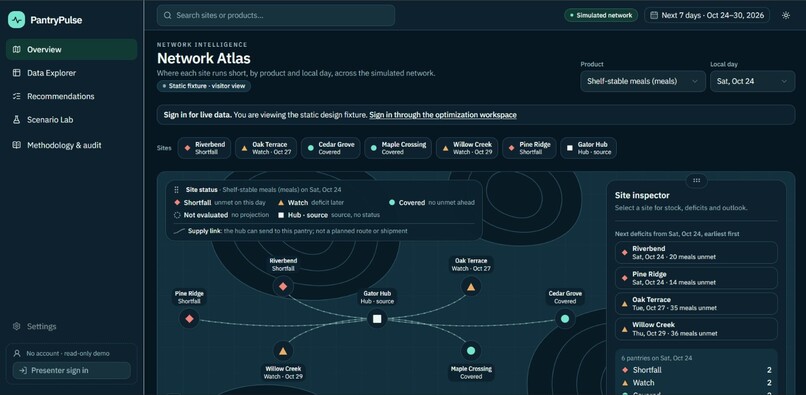
Pantry-Maple Crossing Pantry
-
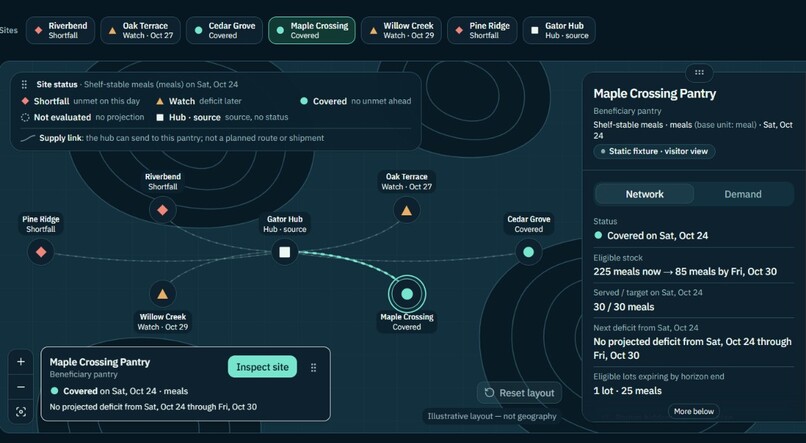
PantryPulse
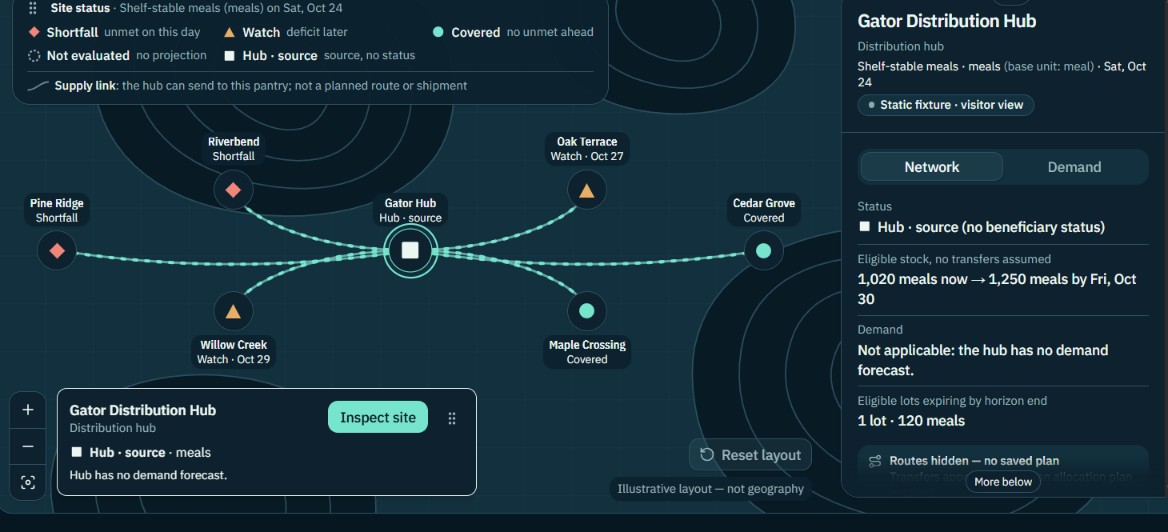
Inspiration
One pantry has food nearing expiry. Another is preparing to tell a family there isn’t enough left.
We kept coming back to that disconnect. Behind every inventory count is someone hoping to bring food home—and a volunteer making difficult decisions with limited time and resources. What if that volunteer could see a shortage coming and find available support elsewhere in the network?
That question became PantryPulse.
Our inspiration came from An extended goal programming framework incorporating poverty measures: application to food bank logistics, published by Rampazo and colleagues in September 2026. Its treatment of vulnerability, deprivation and perishable inventory encouraged us to ask: when food is limited, whose needs remain unmet—and how should that influence the next allocation?
What it does
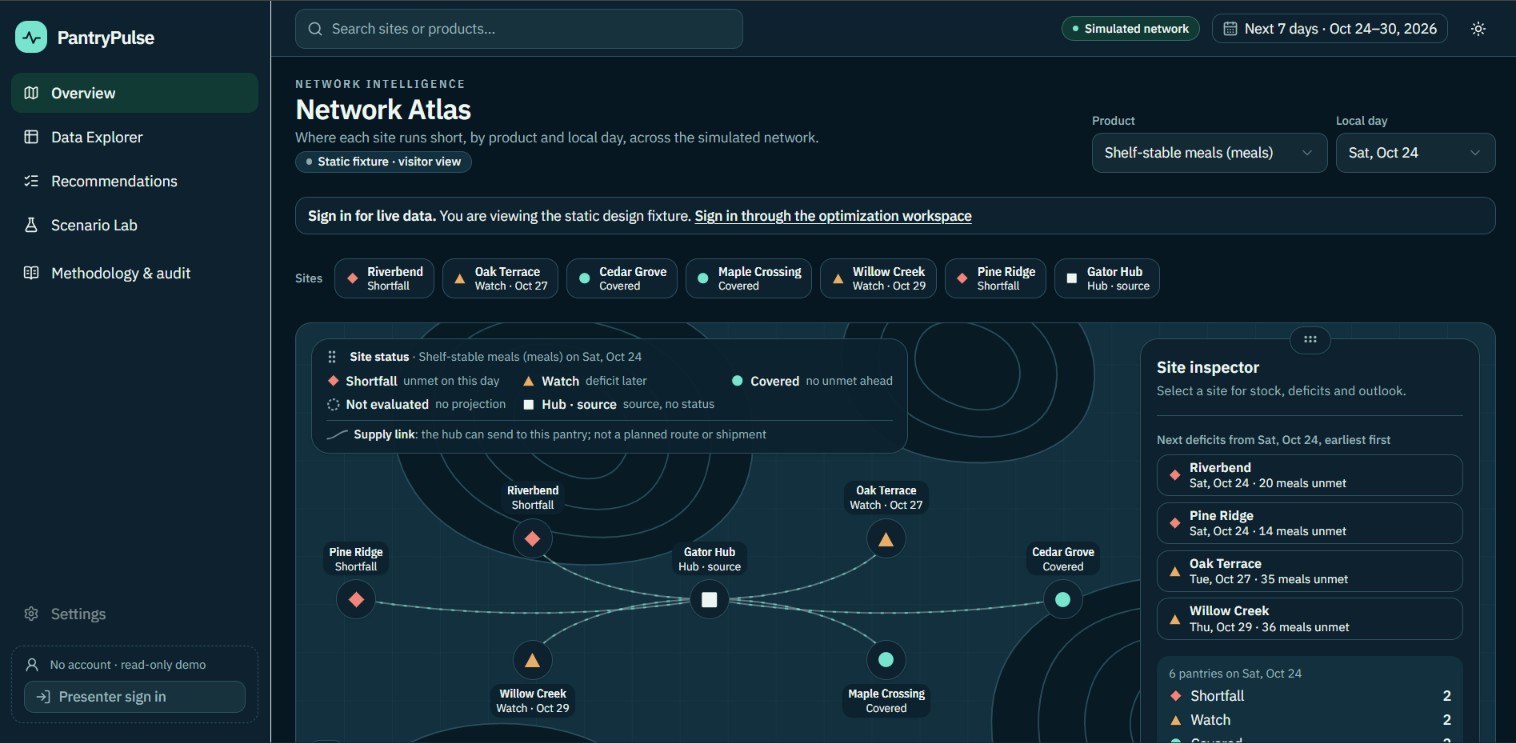
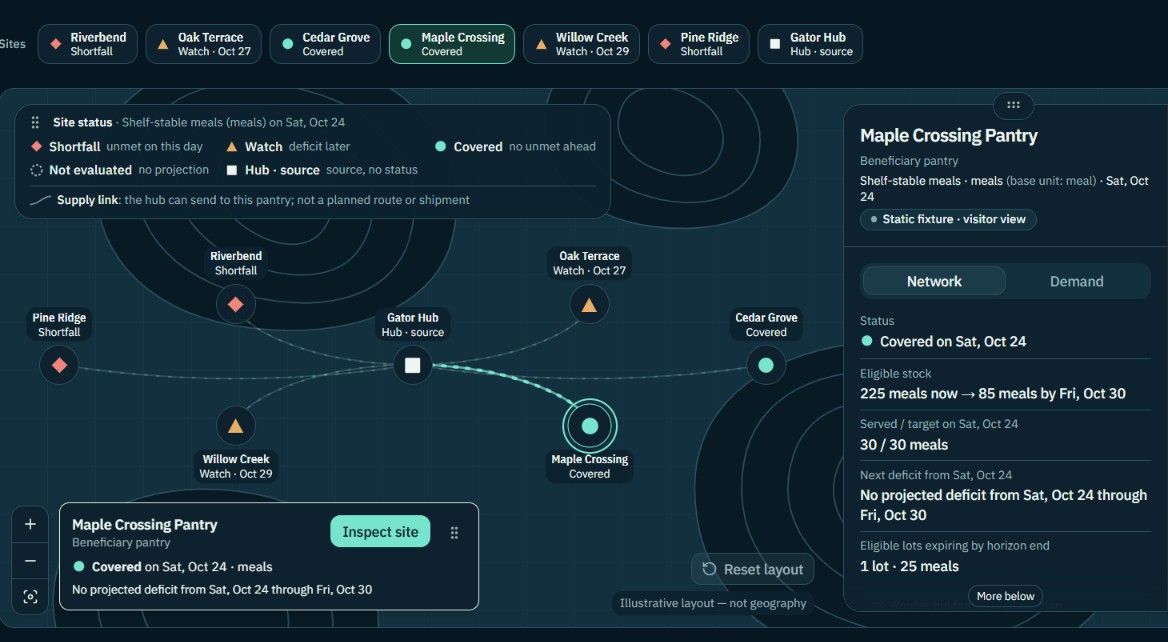
PantryPulse brings inventory, seven-day demand forecasts and redistribution planning into one shared view of a food-bank network.
Teams can identify projected shortages, inspect available stock and explore transfers from a central hub to pantries or between pantries. Recommendations account for expiry dates, capacity limits and the sending pantry’s own projected needs.
Through the Scenario Lab, users can explore changes in demand and compare classical goal programming with an EGP-PI-inspired approach using the same saved inputs. Results show service coverage, remaining shortages and how allocation choices differ across institutions.
Our goal is to help teams anticipate shortages and make informed decisions before shelves run empty.
What makes PantryPulse different
Platforms such as MealConnect connect donors with nonprofit partners, while Food Rescue Hero supports rescue coordination, volunteers and operational insights.
PantryPulse focuses on a specific planning challenge: given the food already available across a network and the demand ahead, what should move, where should it go, and what would each choice mean?
We bring forecasting, pantry-to-pantry sharing and transparent allocation comparisons into one workflow. Teams can examine alternatives before acting, including the shortages a plan cannot resolve.
Building on the paper’s ideas, we added an interactive application around the decision process: network visibility, forecast-driven scenarios, protection for local needs and saved, inspectable recommendations.
How we built it
We started with the journey a pantry team would follow: record what happened, understand current stock, anticipate demand, compare options and review a recommendation.
We connected these steps so each plan can be traced back to its inventory, forecast and assumptions. Changes create a new scenario, preserving earlier results for comparison.
We also built a separate verification step to check proposed allocations against the constraints. Recommendations remain simulations for human review, with people retaining control over operational decisions.
Technical architecture
Forecasting and data engineering: A Python pipeline prepares revision-aware daily demand and donation histories, distinguishing missing records from true zeros and fulfilled demand from actual requests. We generate seven-day forecasts with seasonal-naïve and moving-average baselines, alongside an experimental Amazon Chronos-2 adapter. Chronological backtesting, prediction-coverage checks, and recorded model provenance keep forecasts auditable; predicted donations never count as confirmed inventory.
Operations research: Using Google OR-Tools CP-SAT, we formulate redistribution as a multi-product integer optimization problem. Let $x_{ijp}\in\mathbb{Z}_{\geq0}$ denote units of product $p$ shipped from site $i$ to $j$. Alongside lot-level first-expire-first-out (FEFO), arrival-time, inventory-conservation, and donor-reserve constraints, shared handling capacity imposes
$$ \sum_{(i,j,p)} a_p x_{ijp}\leq C. $$
We compare classical goal programming against a research-inspired extended goal programming objective over the same physical feasible region $\mathcal F$. In compact form, the latter balances aggregate vulnerability-weighted deprivation, its worst-case value, and explicit fairness penalties:
$$ \min_{x\in\mathcal F}\;\beta\sum_{i,p}w_{ip}d_{ip}+(1-\beta)Z+\lambda_{\mathrm{AP}}P_{\mathrm{AP}}+\lambda_{\mathrm{RP}}P_{\mathrm{RP}}+\text{cost/waste},\qquad Z\geq w_{ip}d_{ip}\;\forall i,p. $$
Here $d_{ip}$ is normalized unmet demand; AP and RP capture absolute and relative deprivation. We encode these policies with bounded integer arithmetic and independently replay every candidate allocation to verify feasibility before presenting it. The equation summarizes the objective; the implemented solver uses scaled, quantized coefficients and threshold-based fairness penalties.
Backend and infrastructure: FastAPI, Pydantic, SQLAlchemy, and PostgreSQL connect inventory, forecasts, immutable scenarios, and saved comparisons. Canonical input hashes and versioned assumptions enable reproducible runs; durable jobs execute expensive computations in supervised processes with cancellation, time limits, and protected result publication. OpenAPI-generated TypeScript contracts keep frontend and backend aligned.
Frontend: Next.js, React, TypeScript, Tailwind CSS, and Recharts power the Network Atlas, data exploration, recommendations, and Scenario Lab. Interactive comparisons show projected shortages and beneficiary-level trade-offs, while explicit loading, partial-result, and saved-history states make long-running computation understandable. The interface is designed to explain why a plan changes, not merely display a solver's answer.
Challenges we faced
Keeping the information truthful was one of our hardest challenges. Missing demand is different from zero demand. An expected donation is different from food already on a shelf. A corrected receipt must preserve history without counting stock twice.
Enabling sharing without shifting hardship elsewhere required careful modeling. Helping one pantry should not reduce another pantry’s protected local service. Expiry, arrival timing, reserves and capacity all had to work together.
Making uncertainty understandable was equally important. Incomplete forecasts, changed inventory and unsuccessful calculations need clear explanations. Every displayed result should reflect what the system actually knows.
What we learned
We learned that fairness cannot be reduced to a single headline number. Increasing total service and addressing the most severe unmet needs can lead to different decisions. Making those trade-offs visible is part of building a useful tool.
We also learned that trust depends on being able to question a recommendation: What information produced it? Which assumptions mattered? Who benefits, and what need remains?
Our current demonstration uses simulated institutions and data. Our research-inspired method is a bounded adaptation rather than a reproduction of the paper’s full model, and real-world impact still needs evaluation with food-bank teams.
Our ambition is to help the people feeding their communities see further ahead, coordinate with confidence and make every available donation count.
Built With
- alembic
- classical-goal-programming
- cp-sat
- docker
- egp-pi-inspired-optimization
- fastapi
- google-or-tools
- motion
- moving-average-forecasting
- neon
- next.js
- playwright
- postgresql
- pydantic
- pytest
- python
- react
- recharts
- seasonal-naive-forecasting
- shadcn/ui
- sqlalchemy
- tailwind-css
- typescript


Log in or sign up for Devpost to join the conversation.