-
-
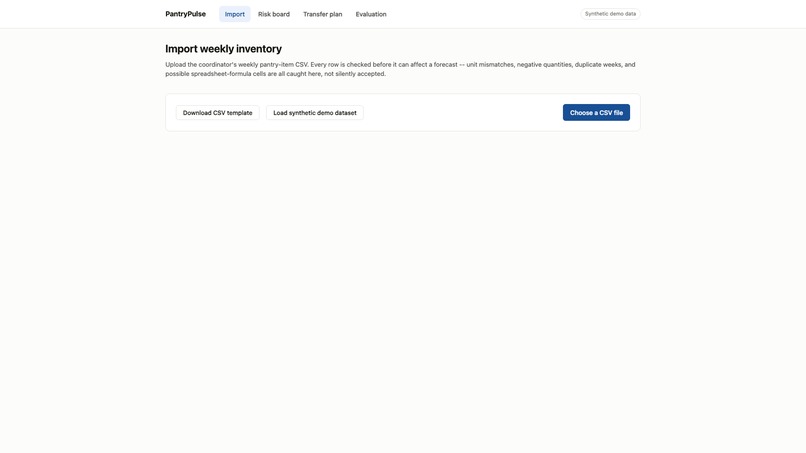
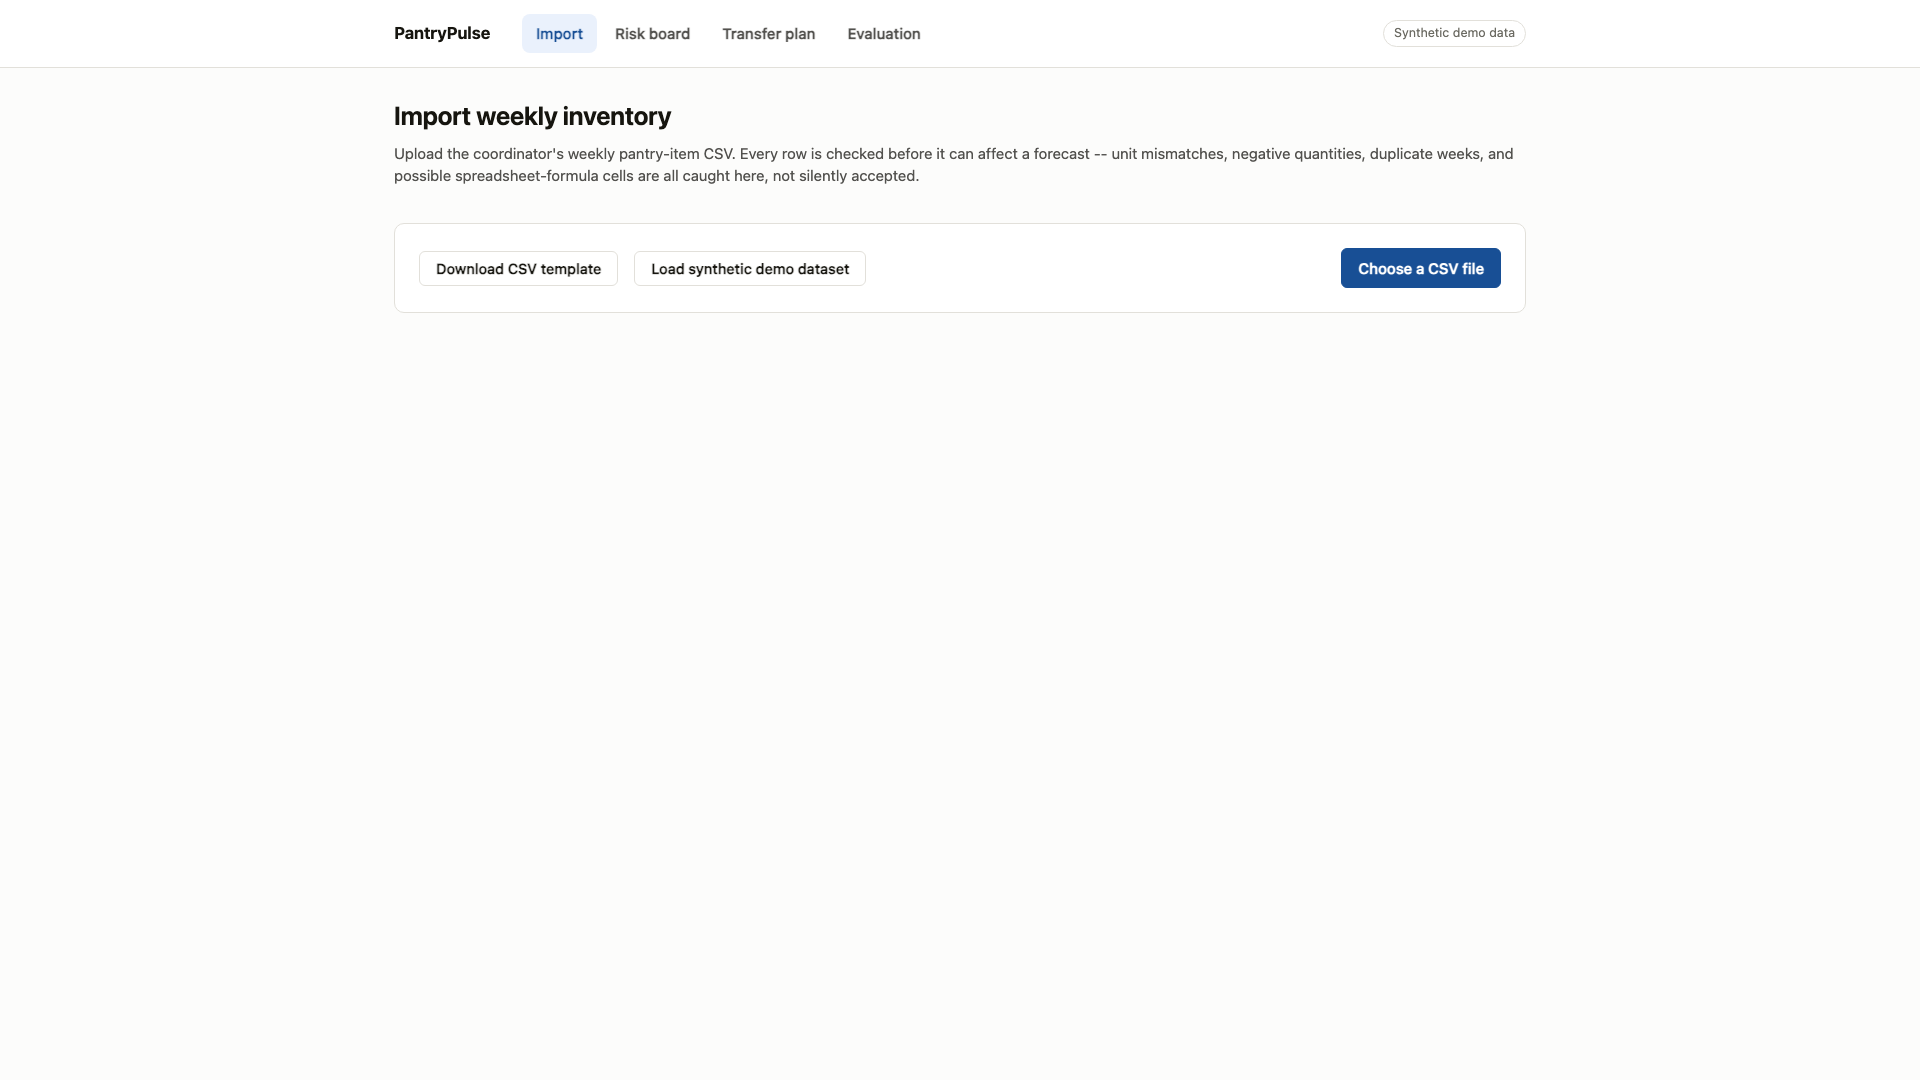
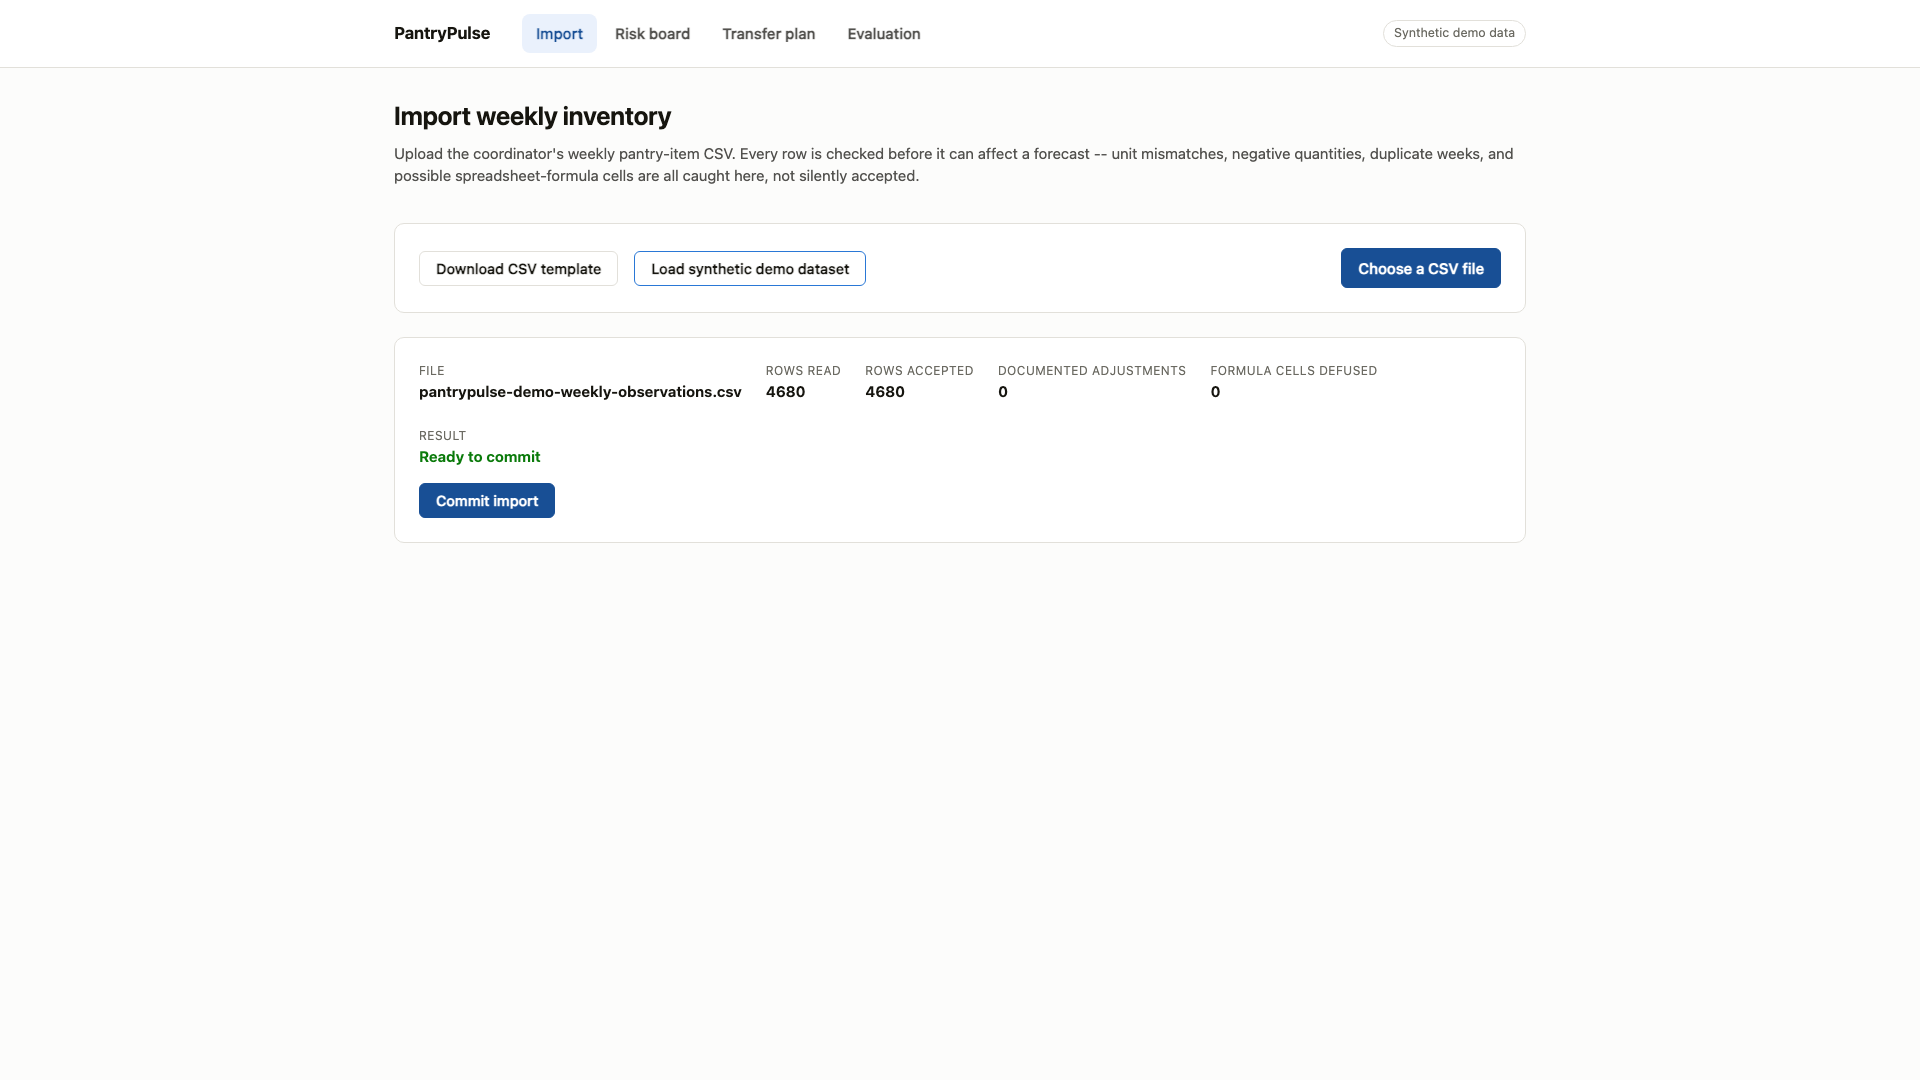
A weekly CSV enters a guided workflow; PantryPulse uses no patron-level data.
-
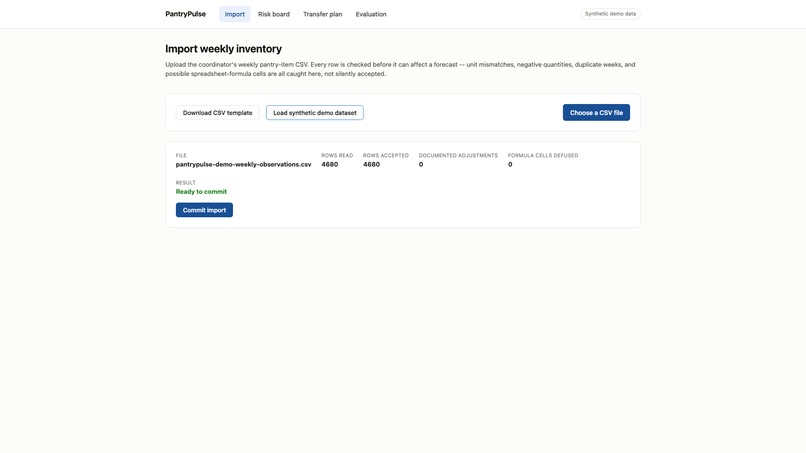
Validation catches unit errors, duplicates, missing weeks, and spreadsheet formulas before forecasting.
-
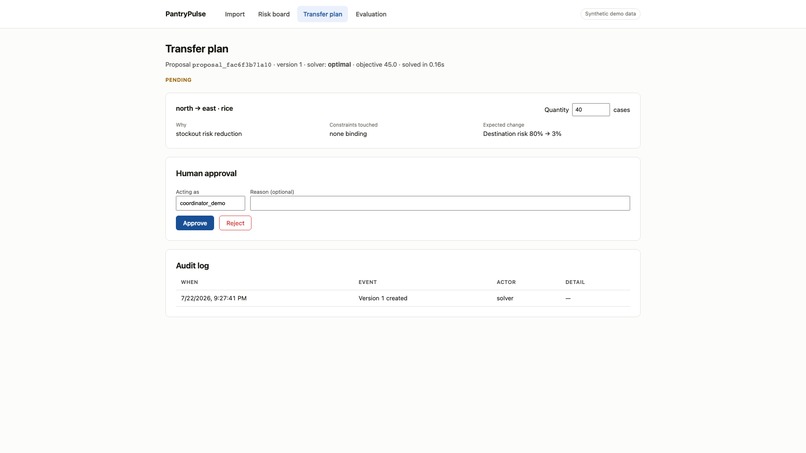
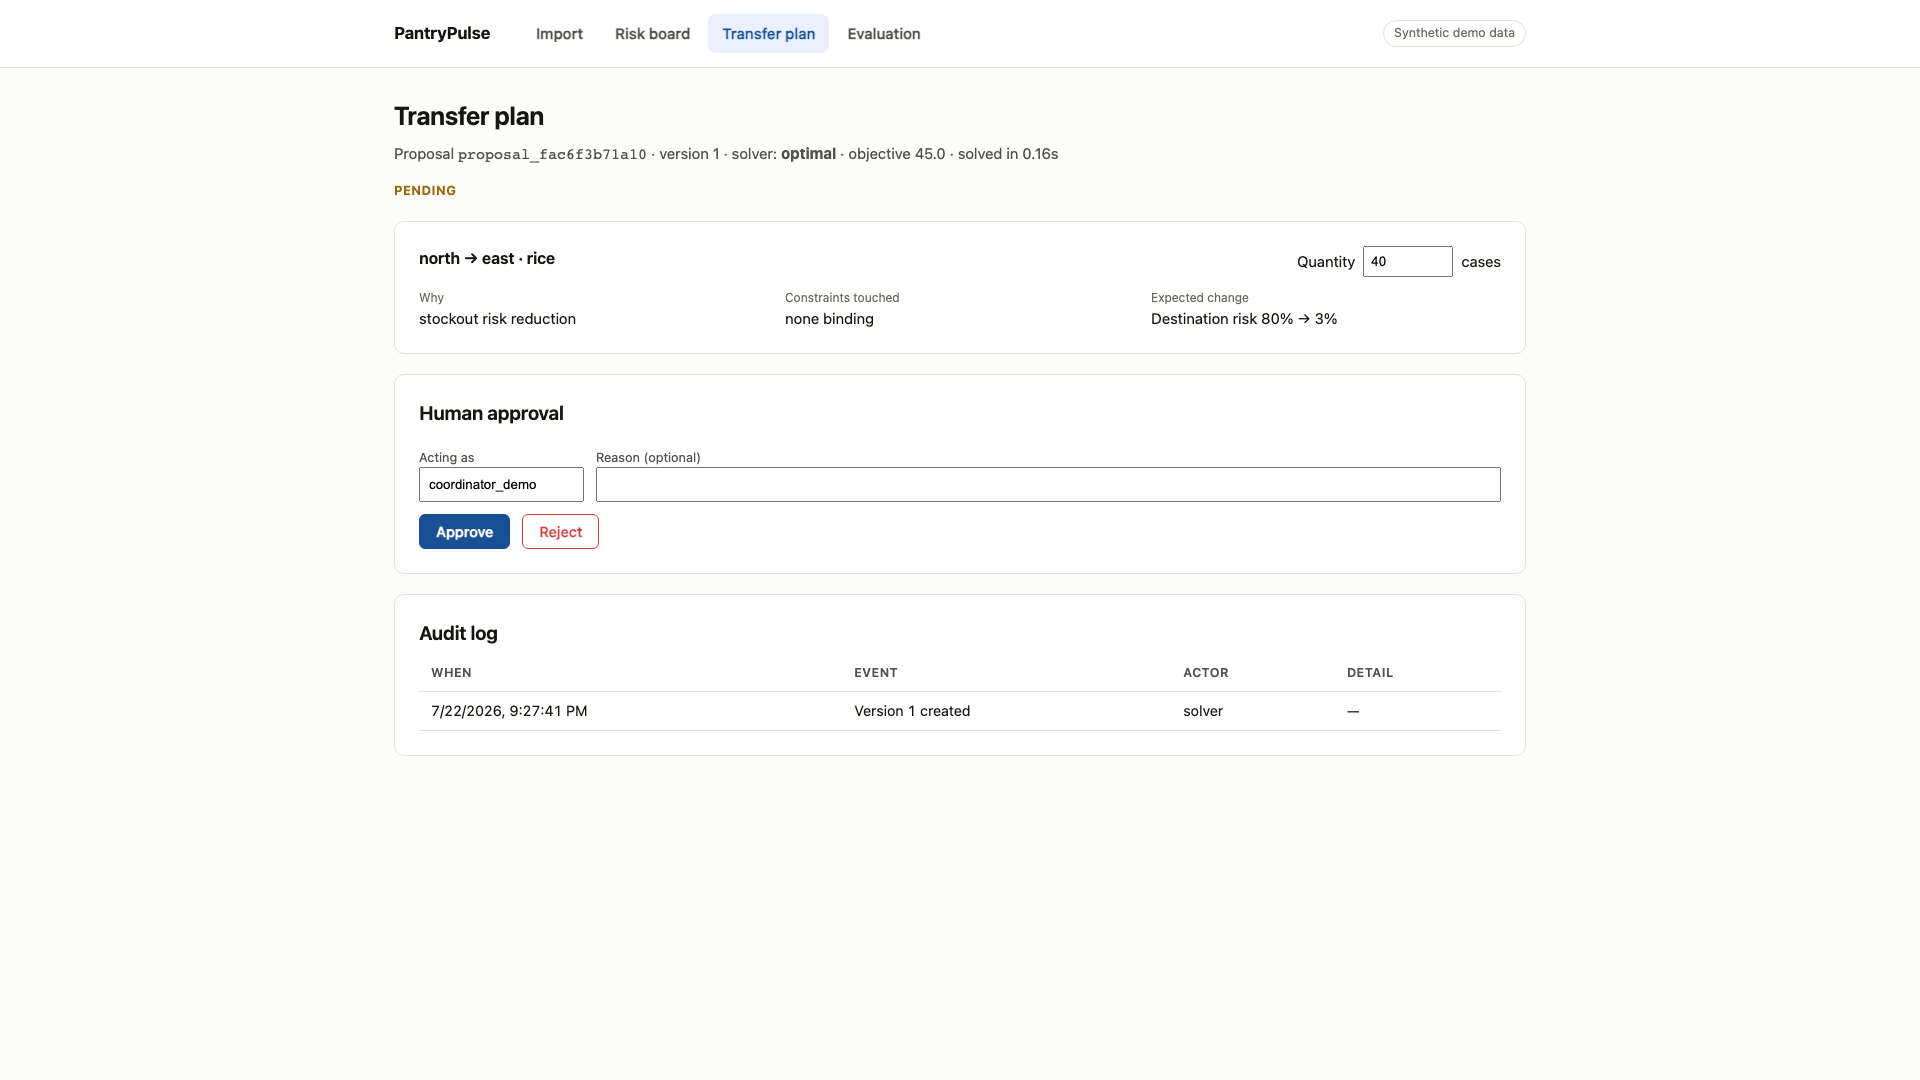
A 40-case transfer from Pantry North lowers simulated destination risk to 3% while preserving safety constraints.
-
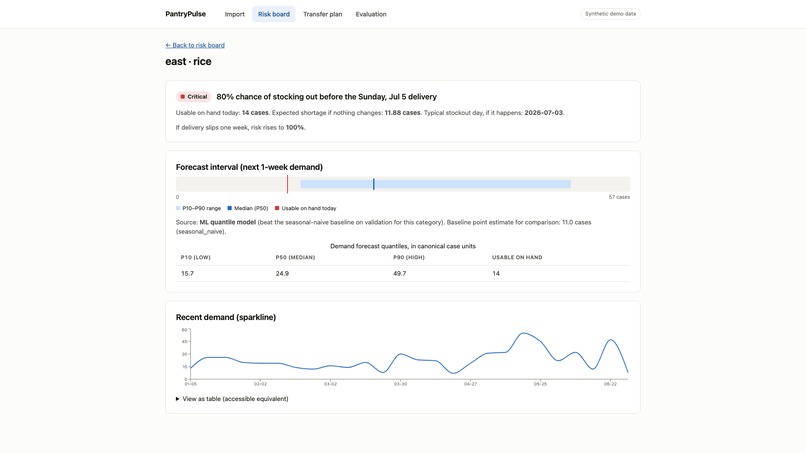
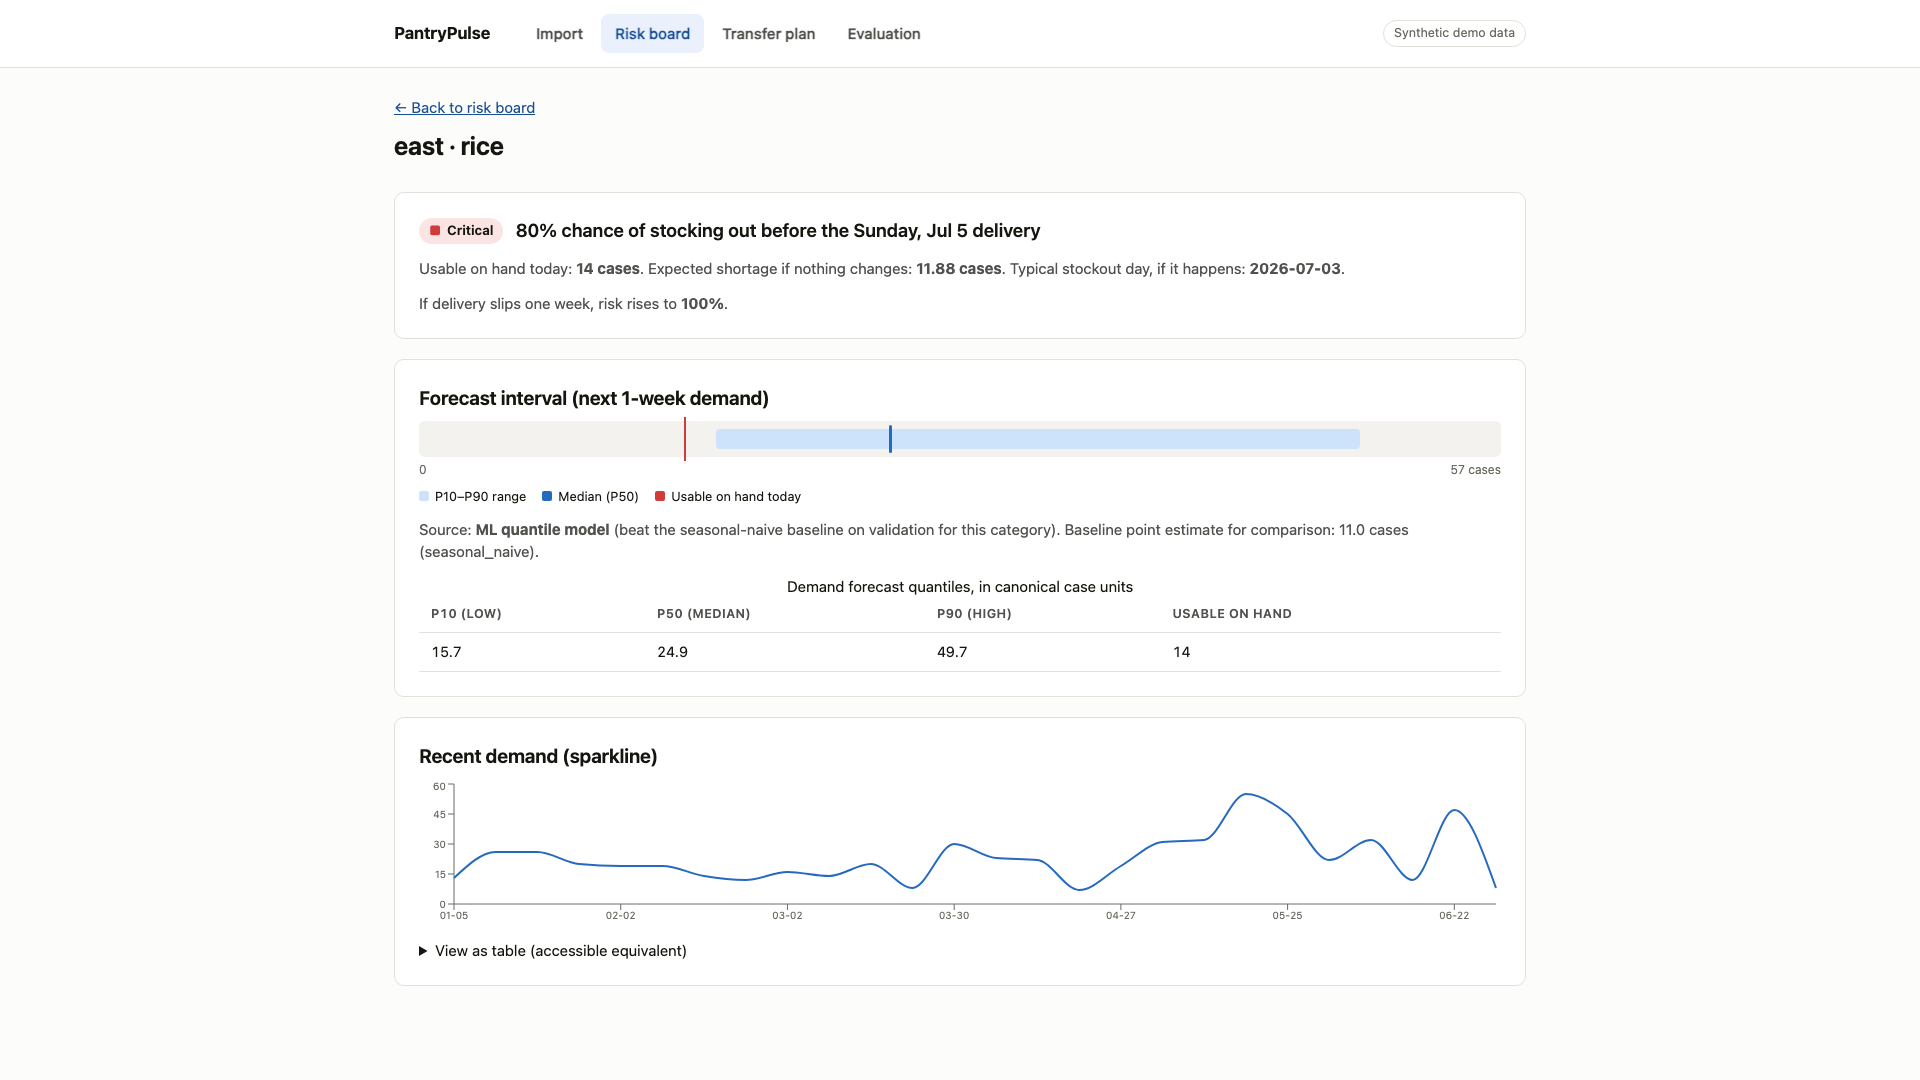
Forecast detail shows uncertainty, recent demand, and the seasonal-naive baseline beside the model.
-
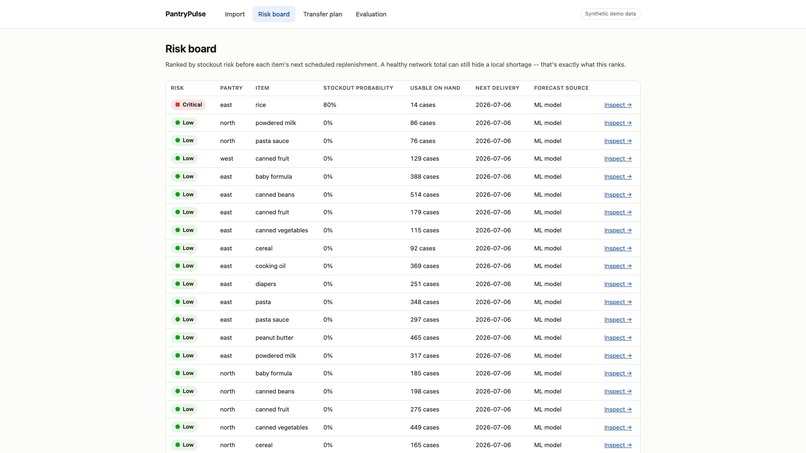
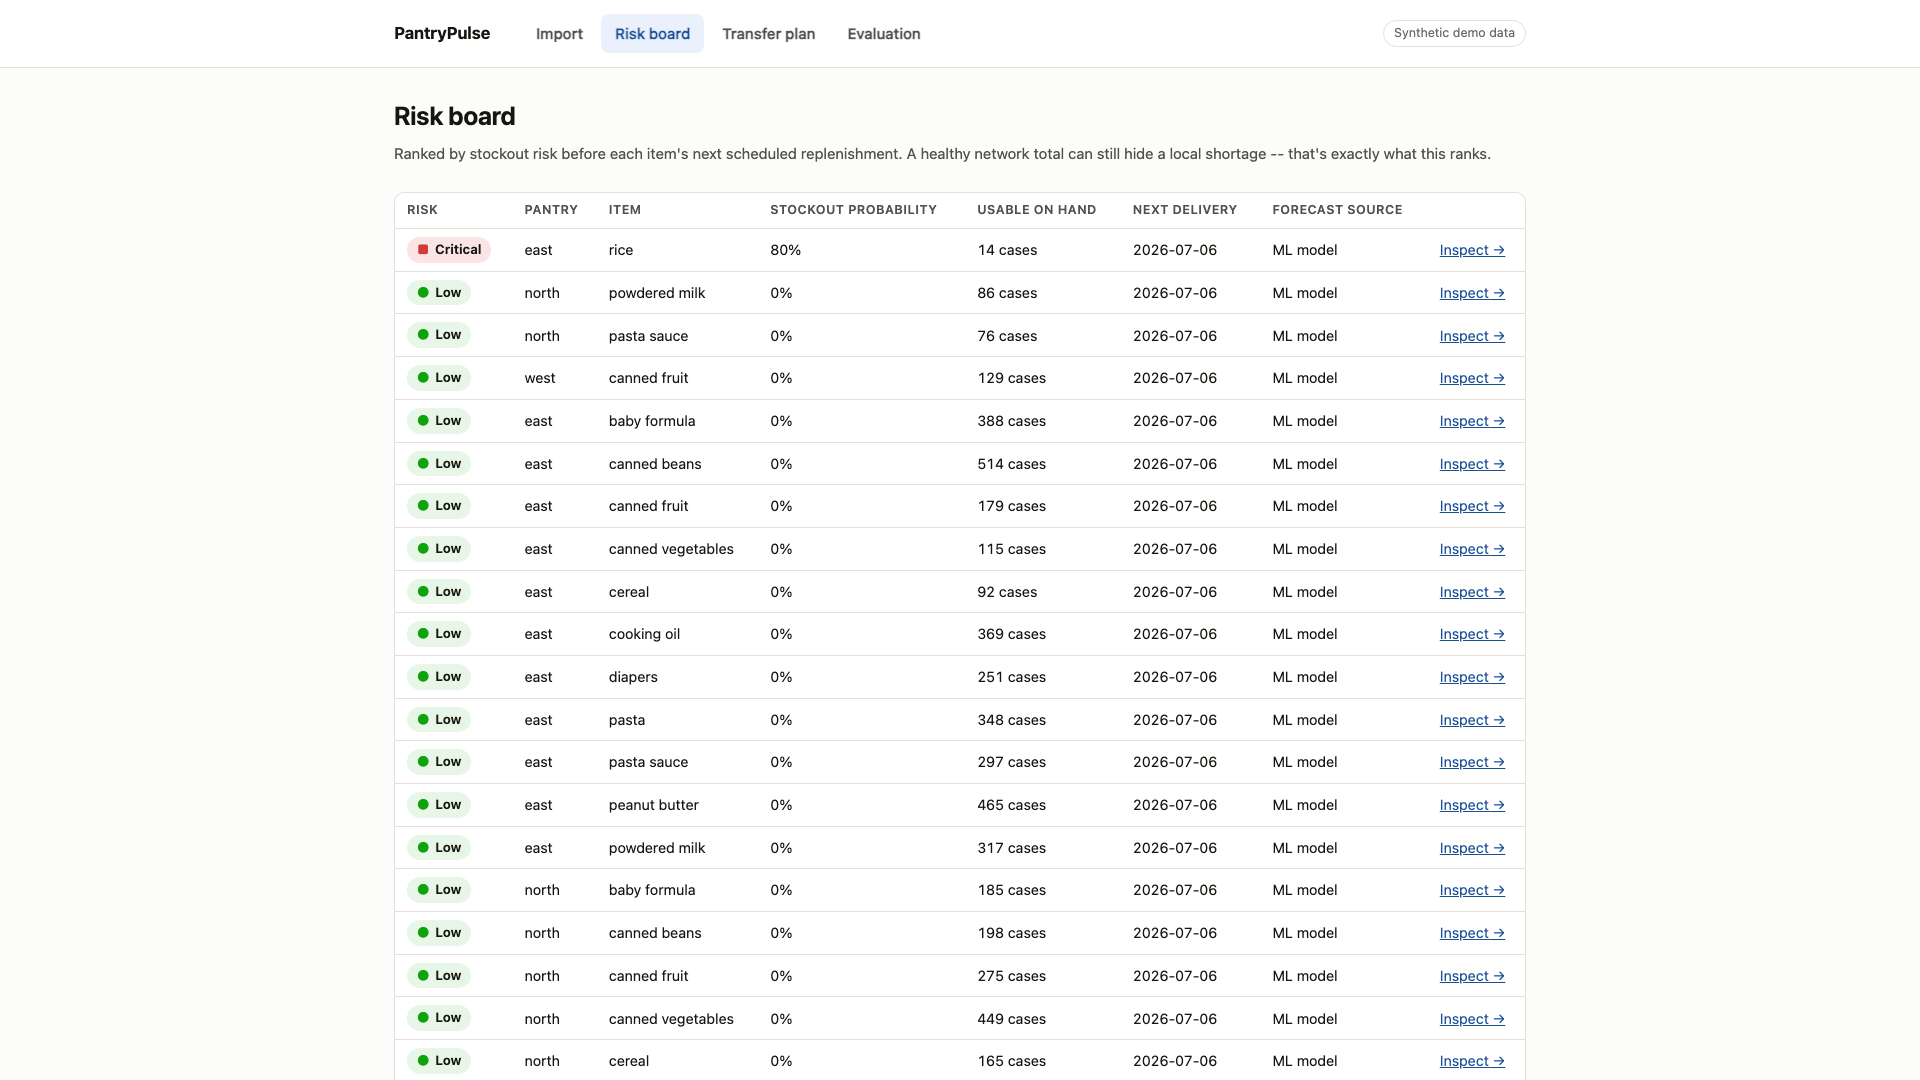
The synthetic risk board surfaces Pantry East rice at 80% stockout risk before its next delivery.
-
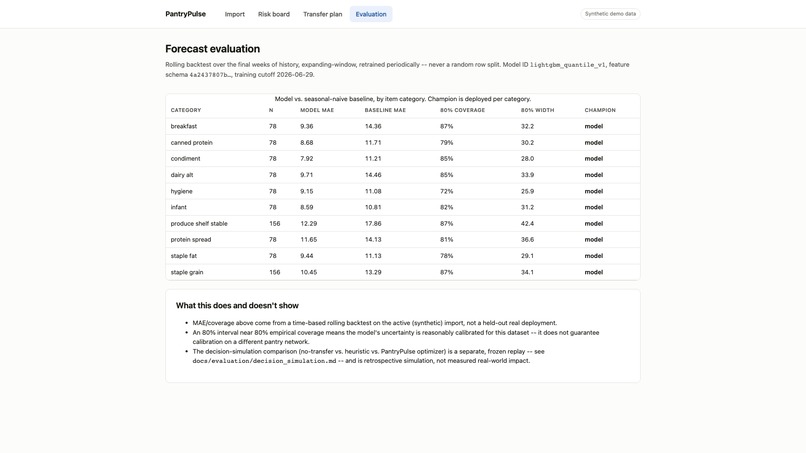
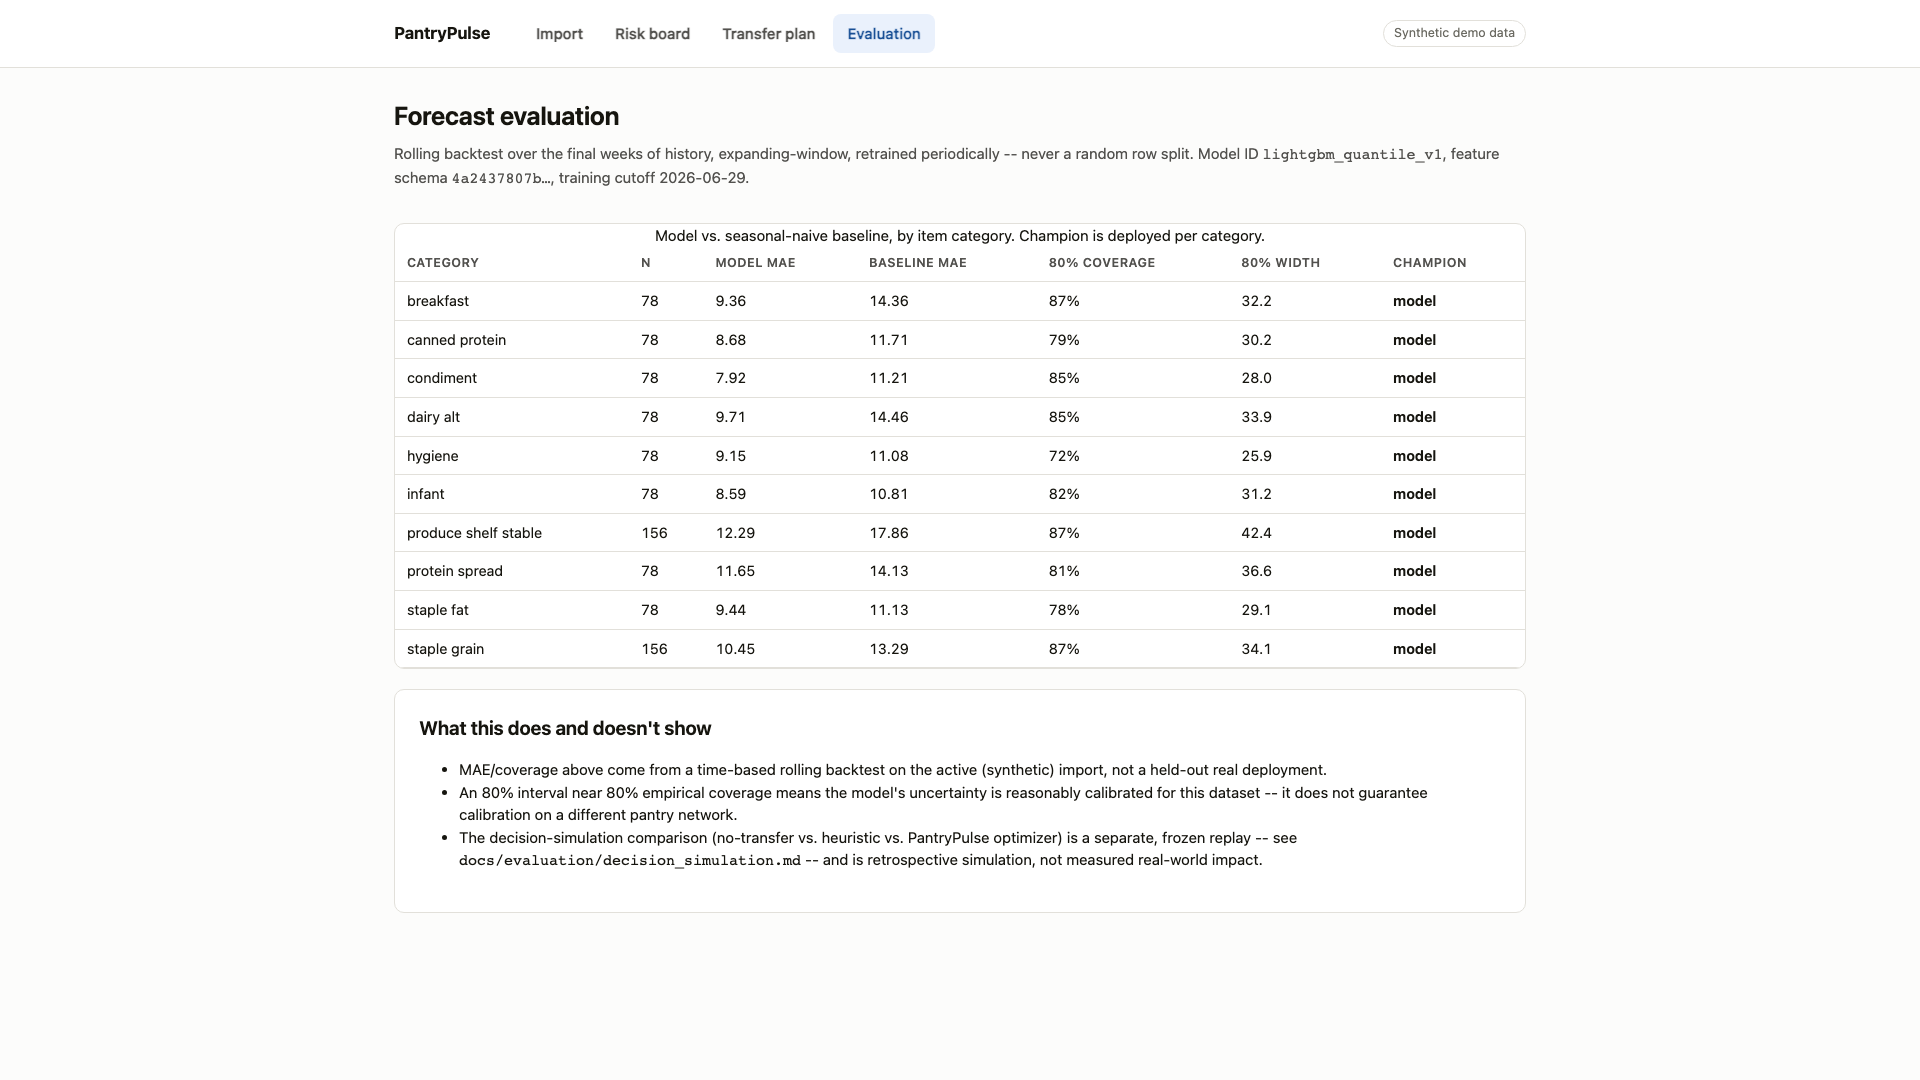
Human approval, export, audit history, and frozen replay metrics keep each recommendation accountable.
Inspiration
A food-pantry network can look healthy in total while one local shelf is days away from going empty. Coordinators need an early warning they can inspect and act on, not a black-box score or an automatic allocation decision.
What it does
PantryPulse turns a weekly inventory CSV into a practical, human-controlled transfer workflow:
- validates units, duplicates, missing weeks, accounting identities, and spreadsheet-formula risks before forecasting;
- forecasts item demand with visible uncertainty and a seasonal-naive baseline comparison;
- ranks pantry-item pairs by stockout risk before the next delivery;
- proposes transfers with OR-Tools CP-SAT while protecting source safety floors, capacity, restrictions, and expiry constraints;
- independently re-validates edits, then requires a coordinator to approve or reject the plan; and
- exports a staff-ready pick list with an audit trail.
Why it matters
The value is a concrete decision: which item, how many cases, from which pantry, and why. In the committed synthetic demo, Pantry East rice has an 80% simulated stockout risk before delivery. A feasible 40-case transfer from Pantry North lowers that destination risk to 3% while keeping the source safe. In the frozen replay, shortage units fall from 40 to 15 and stockout events from 4 to 1, with no new source stockouts.
These results show potential operational value. They are not claims of meals saved or hunger reduced.
How we built it
The forecasting pipeline uses Pandas, LightGBM quantile regression, scikit-learn, rolling time-based validation, baseline gating, and conformal calibration. FastAPI and PostgreSQL persist an immutable chain from import through forecast, risk, proposal, edit, approval, and export. The React and TypeScript interface exposes the reasoning and keeps a human in control.
What we verified
- 56 pytest unit and integration tests pass with 92% coverage.
- Two Playwright end-to-end journeys pass, including accessibility scans and a malformed-CSV rejection path.
- Model MAE is 9.95 versus 13.43 for the seasonal-naive baseline on the synthetic backtest.
- The nominal 80% interval reaches 82.7% empirical coverage.
- Six robustness scenarios pass, including missing history, delayed delivery, demand shock, corrupt units, and sparse-series fallback.
Challenges
Inventory demand is censored when a pantry runs out, so a model can mistake an empty shelf for low need. PantryPulse labels that condition, supports sensitivity strategies, reports calibration instead of hiding it, and falls back to a baseline when ML is not the responsible choice. The optimizer also needed a separate validator so a solver result is never trusted just because it is optimal.
Evidence boundary
This submission uses a documented synthetic three-pantry dataset and retrospective simulation. No real pantry data or patron-level data is included, and no real pantry usability session was conducted. PantryPulse never moves inventory automatically; a coordinator remains accountable for every action.
What is next
A responsible pilot would start with a pantry partner, consented de-identified inventory history, shadow-mode recommendations, and a usability study. Only then should the team measure field outcomes and tune risk thresholds for a real network.
Built With
- accessibility
- lightgbm
- machine-learning
- pandas
- playwright
- postgresql
- python
- react
- visualization

Log in or sign up for Devpost to join the conversation.