-

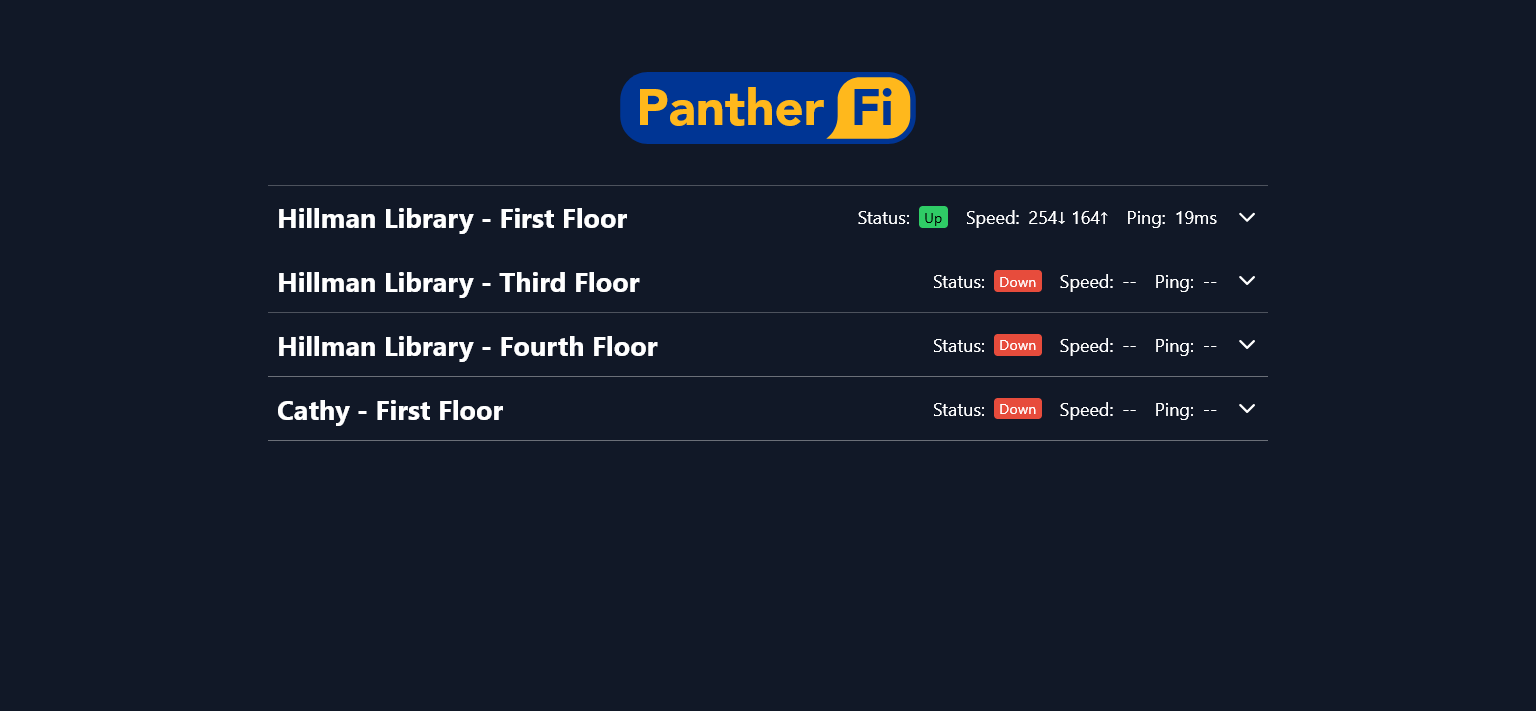
The front-end of the website.
-
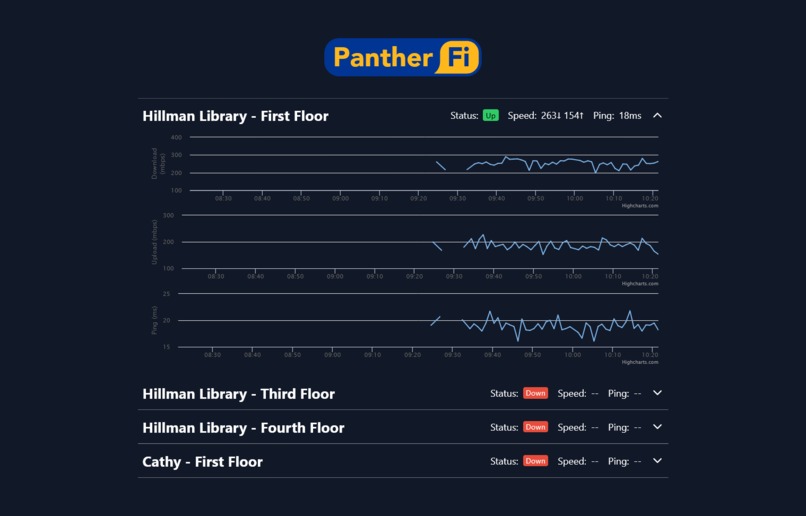
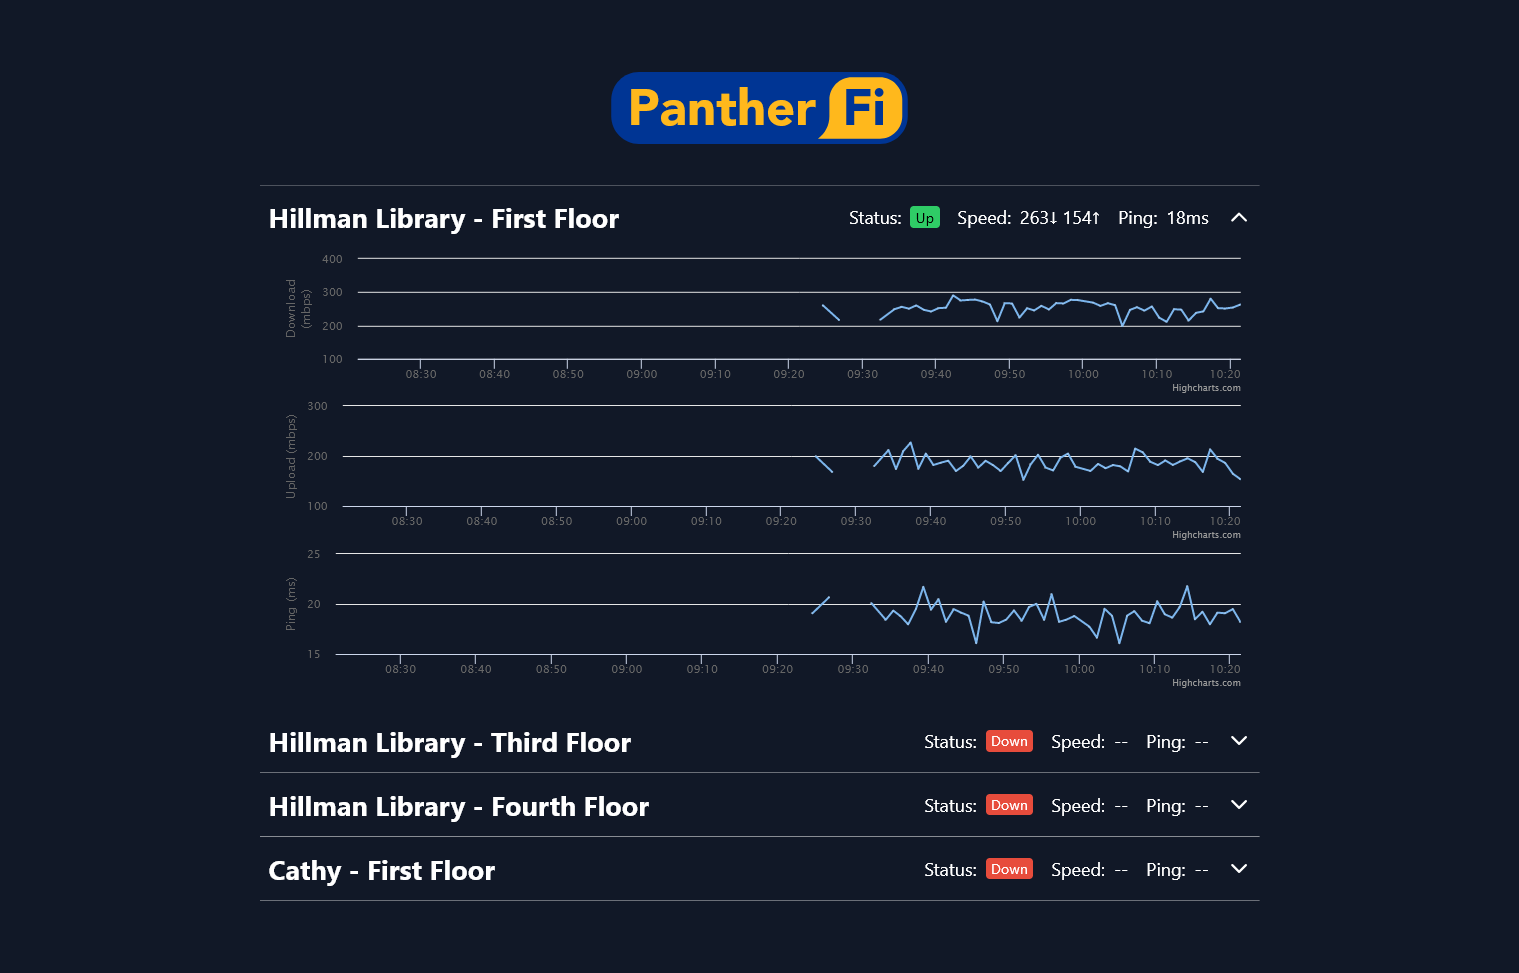
The front-end of the website, with a location expanded to show graphs of past connectivity.
Inspiration
Our inspiration for this project came while we were in the University's main library researching possible ideas for projects. During this brainstorming session, we recalled a frustrating experience from a few days before, when the library Wi-Fi was down without notice for seemingly two straight days. There was no way to know it was down until you had already shown up at the library.
We realized that this was a problem we could address; a utility to view the network performance of various common spaces on campus remotely would be a valuable tool for us, and other students, seeking to optimize their study habits. From that moment, PantherFi was born.
Ironically, five minutes after we decided on this project, there was another temporary network outage at the library. Was it a sign from the Internet gods? Who knows.
What it does
PantherFi can aggregate data from various nodes monitoring the internet connectivity at various locations on campus. This data is processed by the PantherFi server and presented alongside graphs of past connectivity on our website. This allows students to see where the internet is non-functional on campus and avoid those places if they need the connectivity, as well as look at past connectivity to see how the internet at that location has performed over time.
How we built it
On the sensor side of things, we've put together a script that can run on any Unix-based internet-capable device - like a Raspberry Pi - and report the current internet speed to the server in real time. This data is collected using Speedtest.net's speedtest-cli and cleaned up and sent to the server via Python.
Our server code is powered by Python as well, with a REST API built with Flask that can receive and authenticate new internet connectivity observations, save them to the database, and then serve those observations to our front-end. Our database is built in MongoDB, due to some of our familiarity with it, along with its ease of setup and the fact that we were already using JSON data throughout the codebase.
Our front-end is built using a combination of Astro, a static site generator, and Vue, a front-end reactive framework, which together allowed us to build a performant and interactive way to view and visualize the data. In addition, we opted to use the Highcharts library to visualize the data in an intuitive way.
Challenges we ran into
We ran into a few challenges while building this project. The first was in figuring out a critical implementation detail - how would we know when connectivity had been lost? We decided that a lack of data from a node for 5 minutes would be a good indicator that the node had lost connection. We also needed to figure out how to display this downtime on the graphs. The most straightforward solution was to simply plot the graphs with time as the x-axis, rather than plotting every observation in a row; any gaps in observations would be plainly evident this way.
On the front-end, we had never used Astro before, but decided to take this opportunity to learn a new technology. There were some issues with cryptic errors coming from the Vue integration, but after some extensive debugging and Googling, we managed to work out all of the issues we were having.
Accomplishments that we're proud of
During the course of Steelhacks, our team was presented with various logistical problems which limited the amount of testing and development time we had. Given those circumstances, we are proud of what we were able to accomplish in such a short amount of time with the resources we had, as well as the amount that we learned in the process.
What we learned
Going into this event, not every member of the team was familiar with the same tech stack that other members were, which resulted in this being a valuable learning experience for all involved. Through the development of PantherFi, our team gained quality insight into full stack development, as some members were more back-end oriented, while some were more front-end oriented. In addition, using Flask to build APIs and using Astro as a SSG / templating engine were both completely new to us. There were some difficulties in getting Vue and Astro to work together seamlessly, but it was worth the effort, and we both learned a lot.
Through this we also learned a bit about IoT development and the unique set of constraints involved in it, along with the powerful ways in which IoT technology can be leveraged.
Lastly, we gained experience in simply working in teams as opposed to the solo projects that most of us were used to throughout our undergraduate curriculum. We both found this experience really valuable, as collaboration is a massively important part of doing development work in a professional environment.
What's next for PantherFi
We're both really interested in keeping this project going. The plan for that would be to purchase and set up a fleet of Raspberry Pi Zero computers, which could easily be set up in various places around campus to record data and make our product useful. This would require permission from the university, of course, but we feel that the overhead of the project is vastly outweighed by its potential usefulness. One change that may need to be made, however, is to drop the speed testing in favor of simply ping and connectivity tesinf; the bandwidth required to constantly be testing internet speed may simply be too much to allow PantherFi to be scaled up to where we want it to be.

Log in or sign up for Devpost to join the conversation.