Inspiration
Most people have no idea how much electricity their appliances actually consume or how much they're overpaying on their utility bill every month. Tools like Google's Project Sunroof give you a one-shot roof lookup and a static output but they don't tell you why your bill is high, which appliances are costing you the most, or what a real solar switch would look like for your specific household. We wanted to build the tool that actually closes that loop. Panelly is a gamified, personalized energy assistant that takes you from "I have no idea what I'm spending" to "here's exactly what solar would save me and where to get it", in one guided experience.
What it does?
Panelly walks users through a personalized energy journey in five steps:
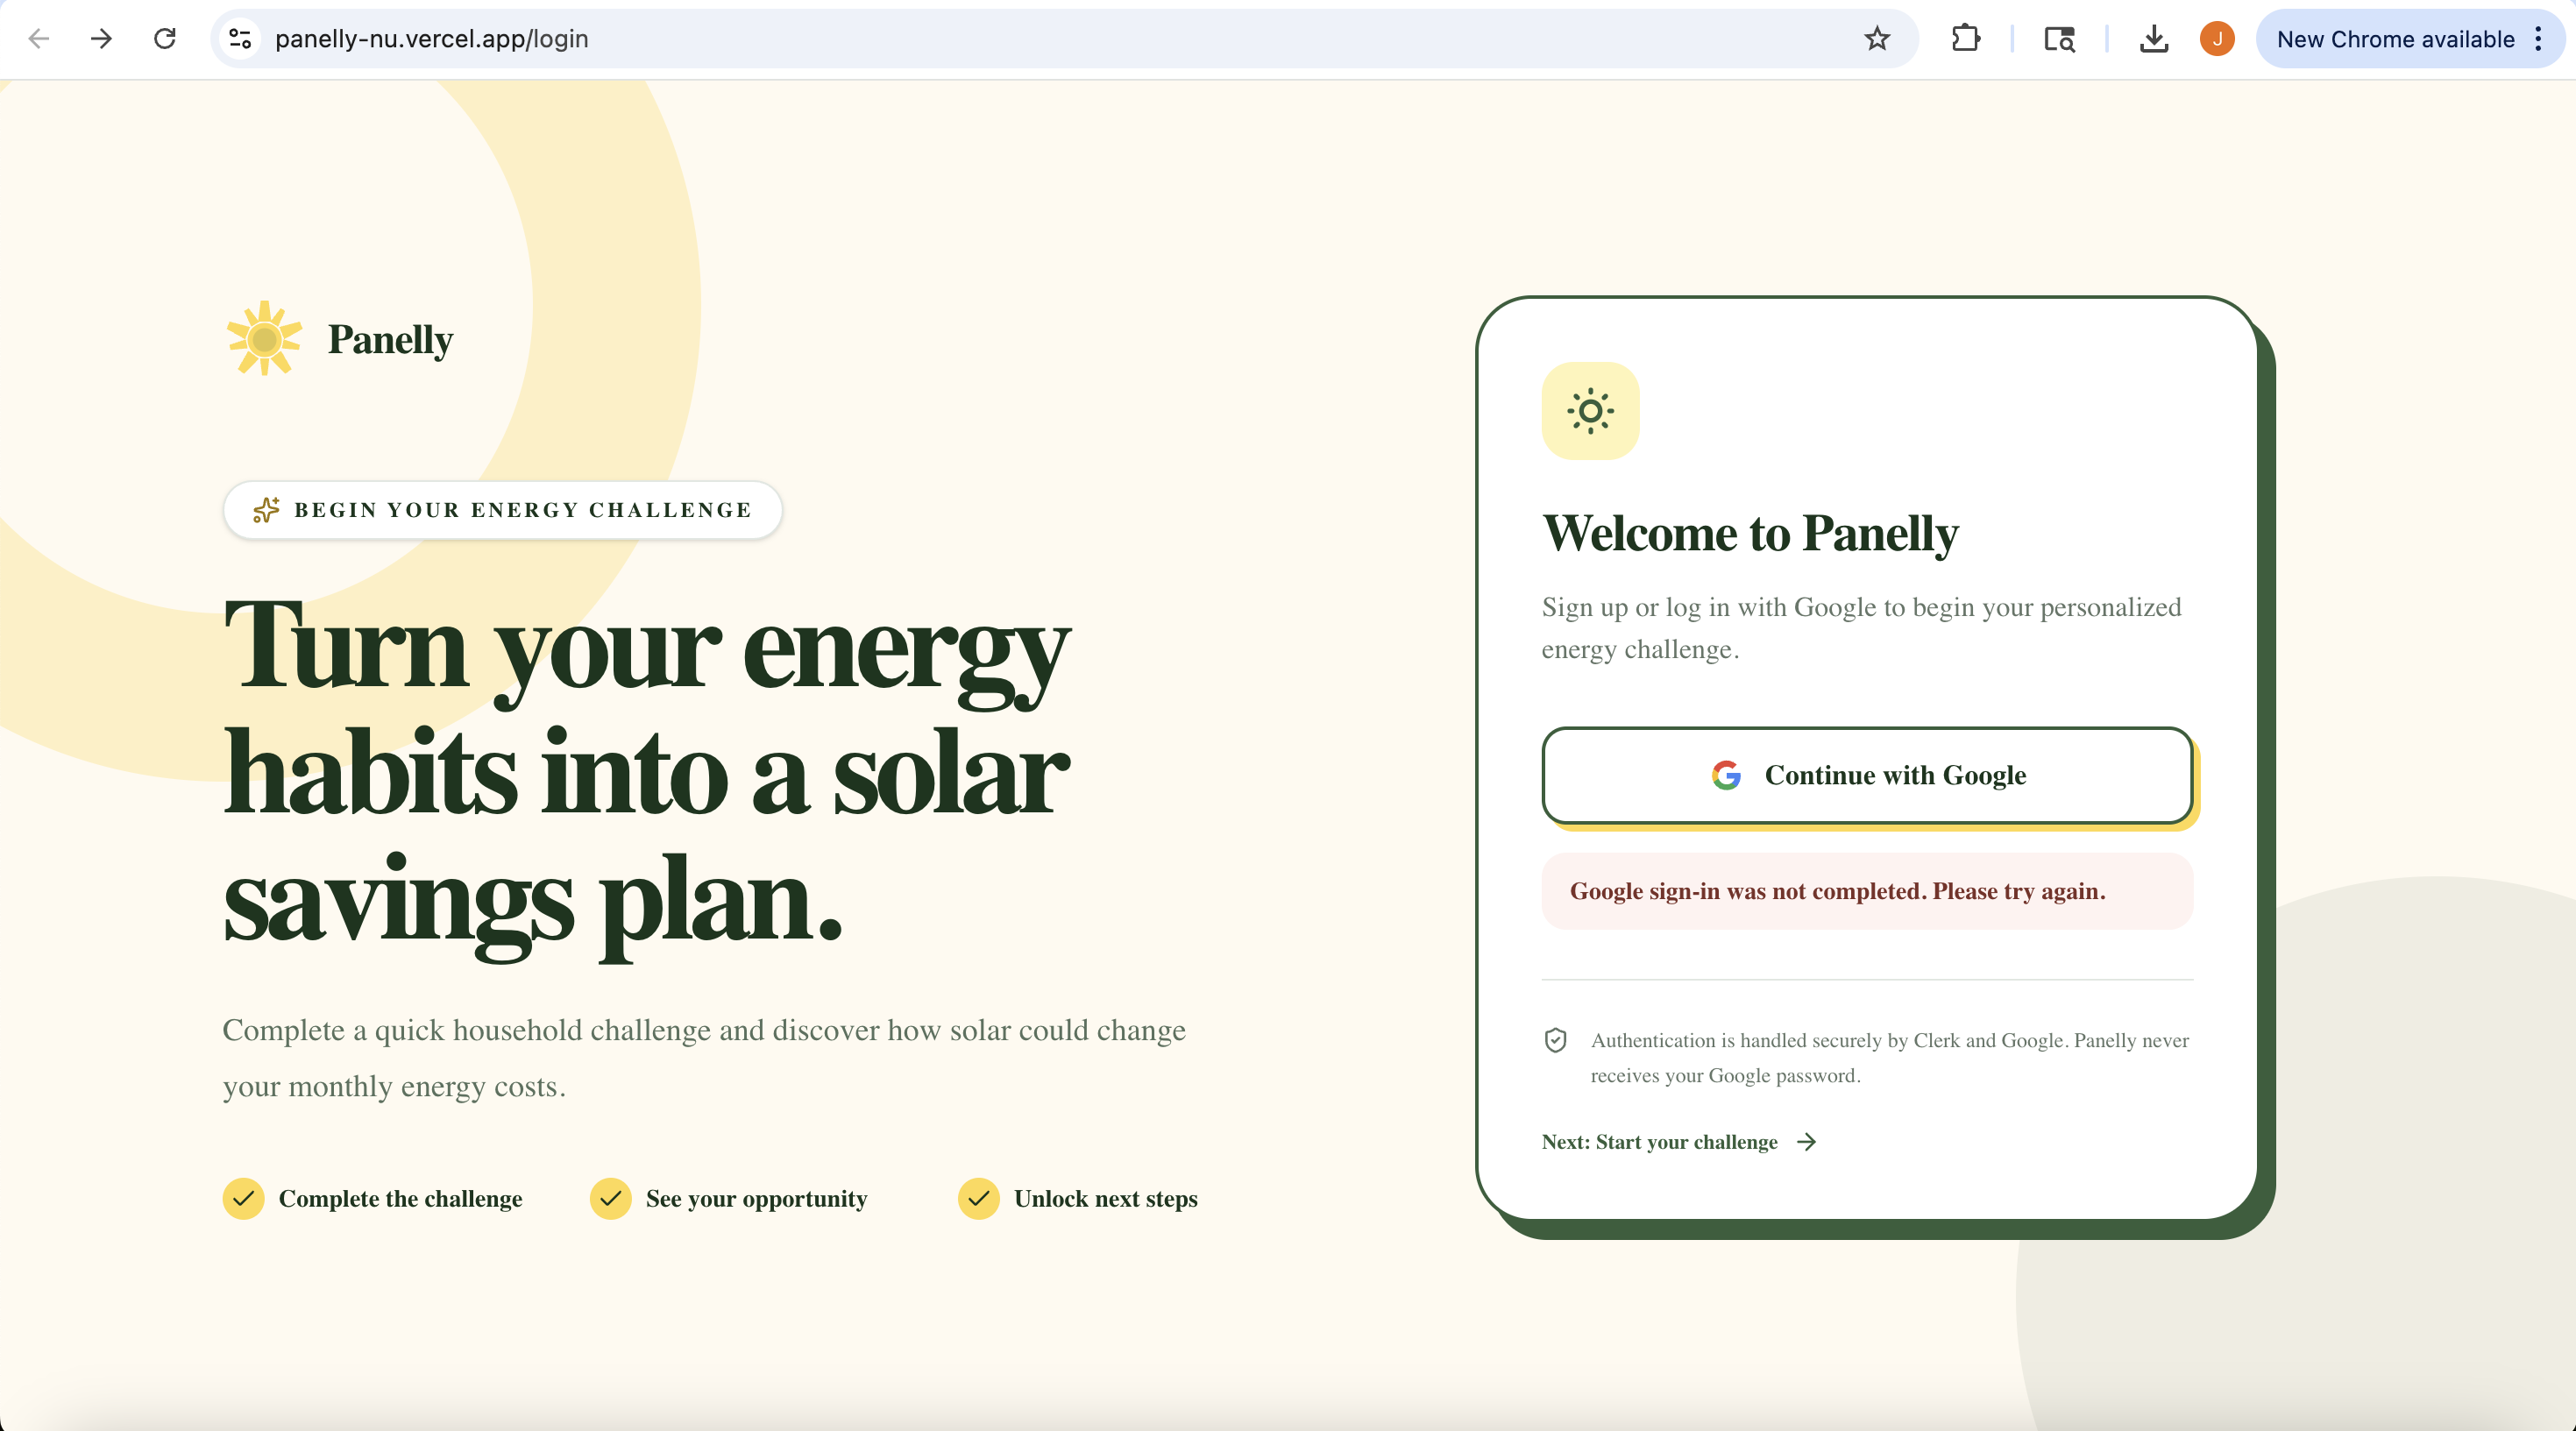
- Sign in with Google and create your profile
- Complete a survey with your zip code and household details → we use this to pull real solar potential data and local electricity rates for your state
- Upload photos of your appliances → Gemini's vision model identifies each appliance, estimates its wattage, and calculates its daily energy draw
- Enter your utility bill numbers (no personal info required → just kWh and dollar amounts) → Gemini OCRs the values and matches them against your appliance breakdown
- Get your results → a full solar vs. utility comparison, top 3 real local solar installers near your zip code, projected payback period, and personalized tips for reducing your energy footprint
How we built it?
Frontend: Next.js (App Router), Tailwind CSS, shadcn/ui, Framer Motion Auth: Clerk with Google as the sign-in provider Database: Neon Postgres (storing survey submissions, computed results, and history logs per user) AI: Google Gemini 2.5 Flash via AI SDK v6 generateObject with Zod schemas, used for three specific tasks: appliance photo identification, bill OCR (kWh and dollar values only), and personalized tip generation. Gemini is never the source of truth for numbers. Solar data: Google Solar API buildingInsights.findClosest — real roof potential and panel yield data Electricity rates: EIA API v2 — real $/kWh rates by state Installer discovery: Google Places API — real installer names, ratings, and addresses near the user's zip code Pricing math: Install cost per watt computed from SEIA/EnergySage public averages, federal 26% ITC applied, payback period derived from actual usage — clearly labeled as estimated Deployed: Vercel, continuously deployed from our GitHub reposity
Challenges we ran into
No public API exposes real solar installer quotes, EnergySage and similar platforms are lead-gen tools, not open data. We solved this by pairing real installer names and ratings from Google Places with our own computed estimates, clearly labeled as projections so we could answer judge questions honestly. Gemini will hallucinate specific pricing numbers if asked directly, we scoped its role strictly to vision tasks (appliance ID and bill OCR) and kept all math on our backend with verified data sources. Coordinating a four-person team across a shared Next.js repo under a 12-hour clock required locking in the architecture early and splitting strictly by folder, backend, survey UI, database, and results UI, so no one was blocked waiting on another person's work.
Accomplishments that we're proud of
We are incredibly proud to have built and shipped a fully functional, end-to-end platform in under 12 hours, meeting every single expectation we set out to achieve. What makes this even more rewarding is that three out of our four team members were first-time hackers who rapidly conquered steep learning curves. While we divided the workload cleanly into individual tasks to stay agile, we collaborated seamlessly, stepping in to troubleshoot together whenever a roadblock appeared and proving that strong individual ownership paired with absolute teamwork wins the day.
What we learned
Real data sources matter more than impressive-sounding AI calls. Using the EIA for electricity rates, the Solar API for roof data, and Places for installers made our numbers defensible under questioning. Gemini earned its place in the stack by doing what it's actually good at, reading images and generating copy, not by inventing facts.
What's next for Panelly
Push notifications when local electricity rates change significantly Integration with smart home APIs (Nest, SmartThings) to pull real-time appliance data instead of relying on photos A community comparison feature, see how your energy footprint compares to similar households in your zip code Expand the installer comparison to include financing options and lease vs. buy breakdowns
Built With
- clerk
- eia-api
- framer
- gemini
- google-places
- google-solar-api
- neon-postgres
- next.js-(app-router)
- shadcn/ui
- tailwind-css
- typescript
- vercel
- zod


Log in or sign up for Devpost to join the conversation.