-
-
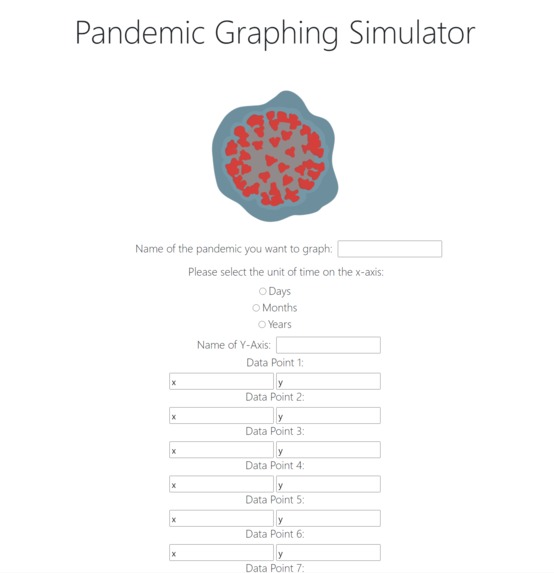
Top of the website page
-

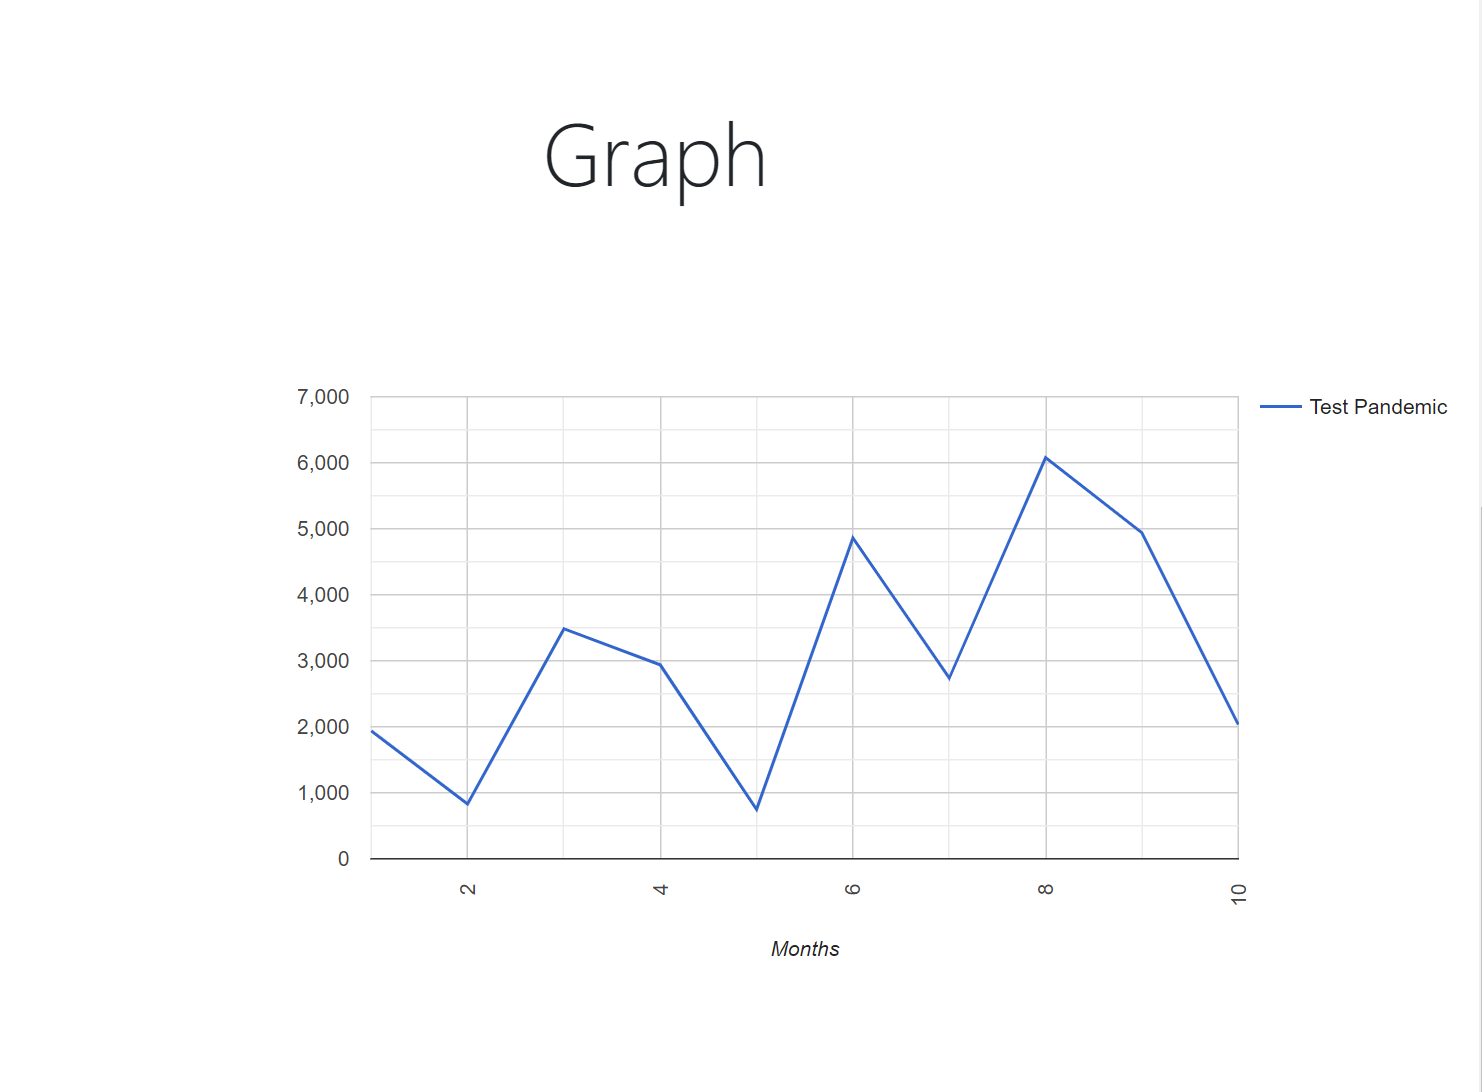
The graph after someone has put in the data

Inspiration
People are unique. Everybody has different ways of visualizing things. Everything can be interpreted a hundred thousand different ways. This is why it is so important for there to be things ranging simplistic graphs to complicated writing. I felt that there were certain groups that have a difficult time understanding and comprehending the data, especially around COIVD-19, surrounding pandemics that is so often given in written form. This is why I made my project simplistic and about graphing.
What it does
Users can give the project the unit of time, name, data, etc. of a pandemic, and the program will take the information given, and produce a minimalistic graph for the user (including the ability to view points at different parts of the graph).
How I built it
I used Qoom, with HTML, CSS, and JavaScript files. In those files, I used open source resources such as bootstrap and the Google Chart API to help aid me with some of the aspects of my projects. I also drew the virus image using Procreate.
Challenges I ran into
There were an unspeakable amount of bugs during the overall time of coding my project, and they were really difficult to find. There were also logical/structural problems from the base idea of my project, and I really had to think about how I could structure my code in a way, where everything worked the way it was supposed to.
Accomplishments that I'm proud of
I haven't coded with HTML, CSS, or JavaScript in over 3 years, so just coming up with a final product was a incredible feat. I also ran into so many bugs, and being able to fix all of them is something that I take great pride in.
What I learned
This was my first time using Qoom, and it was definitely an unique experience. I also relearned HTML, CSS, and JavaScript quickly. Also, once doing my research, I found that there weren't a lot of good websites that have simplistic graphs as opposed to complicated ones.
What's next for the Pandemic Graphing Simulator
I definitely want to continue to work on expanding my work with my simulator! I feel like there are many different aspects, like a mobile version, that can still be explored. I look forward to continuing to expand the possibilities of the Pandemic Graphing Simulator.
Built With
- bootstrap
- css
- google-chart-api
- html
- javascript
- procreate
- qoom

Log in or sign up for Devpost to join the conversation.