-
-

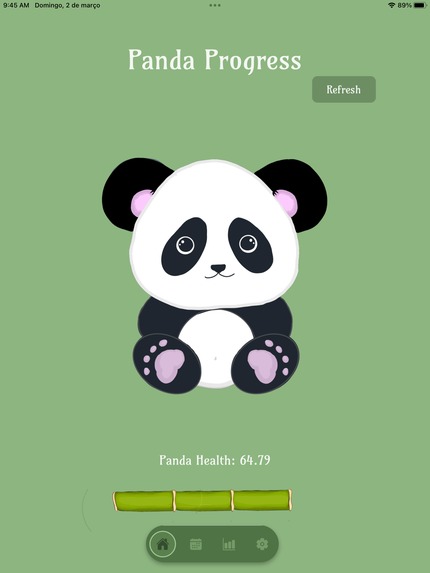
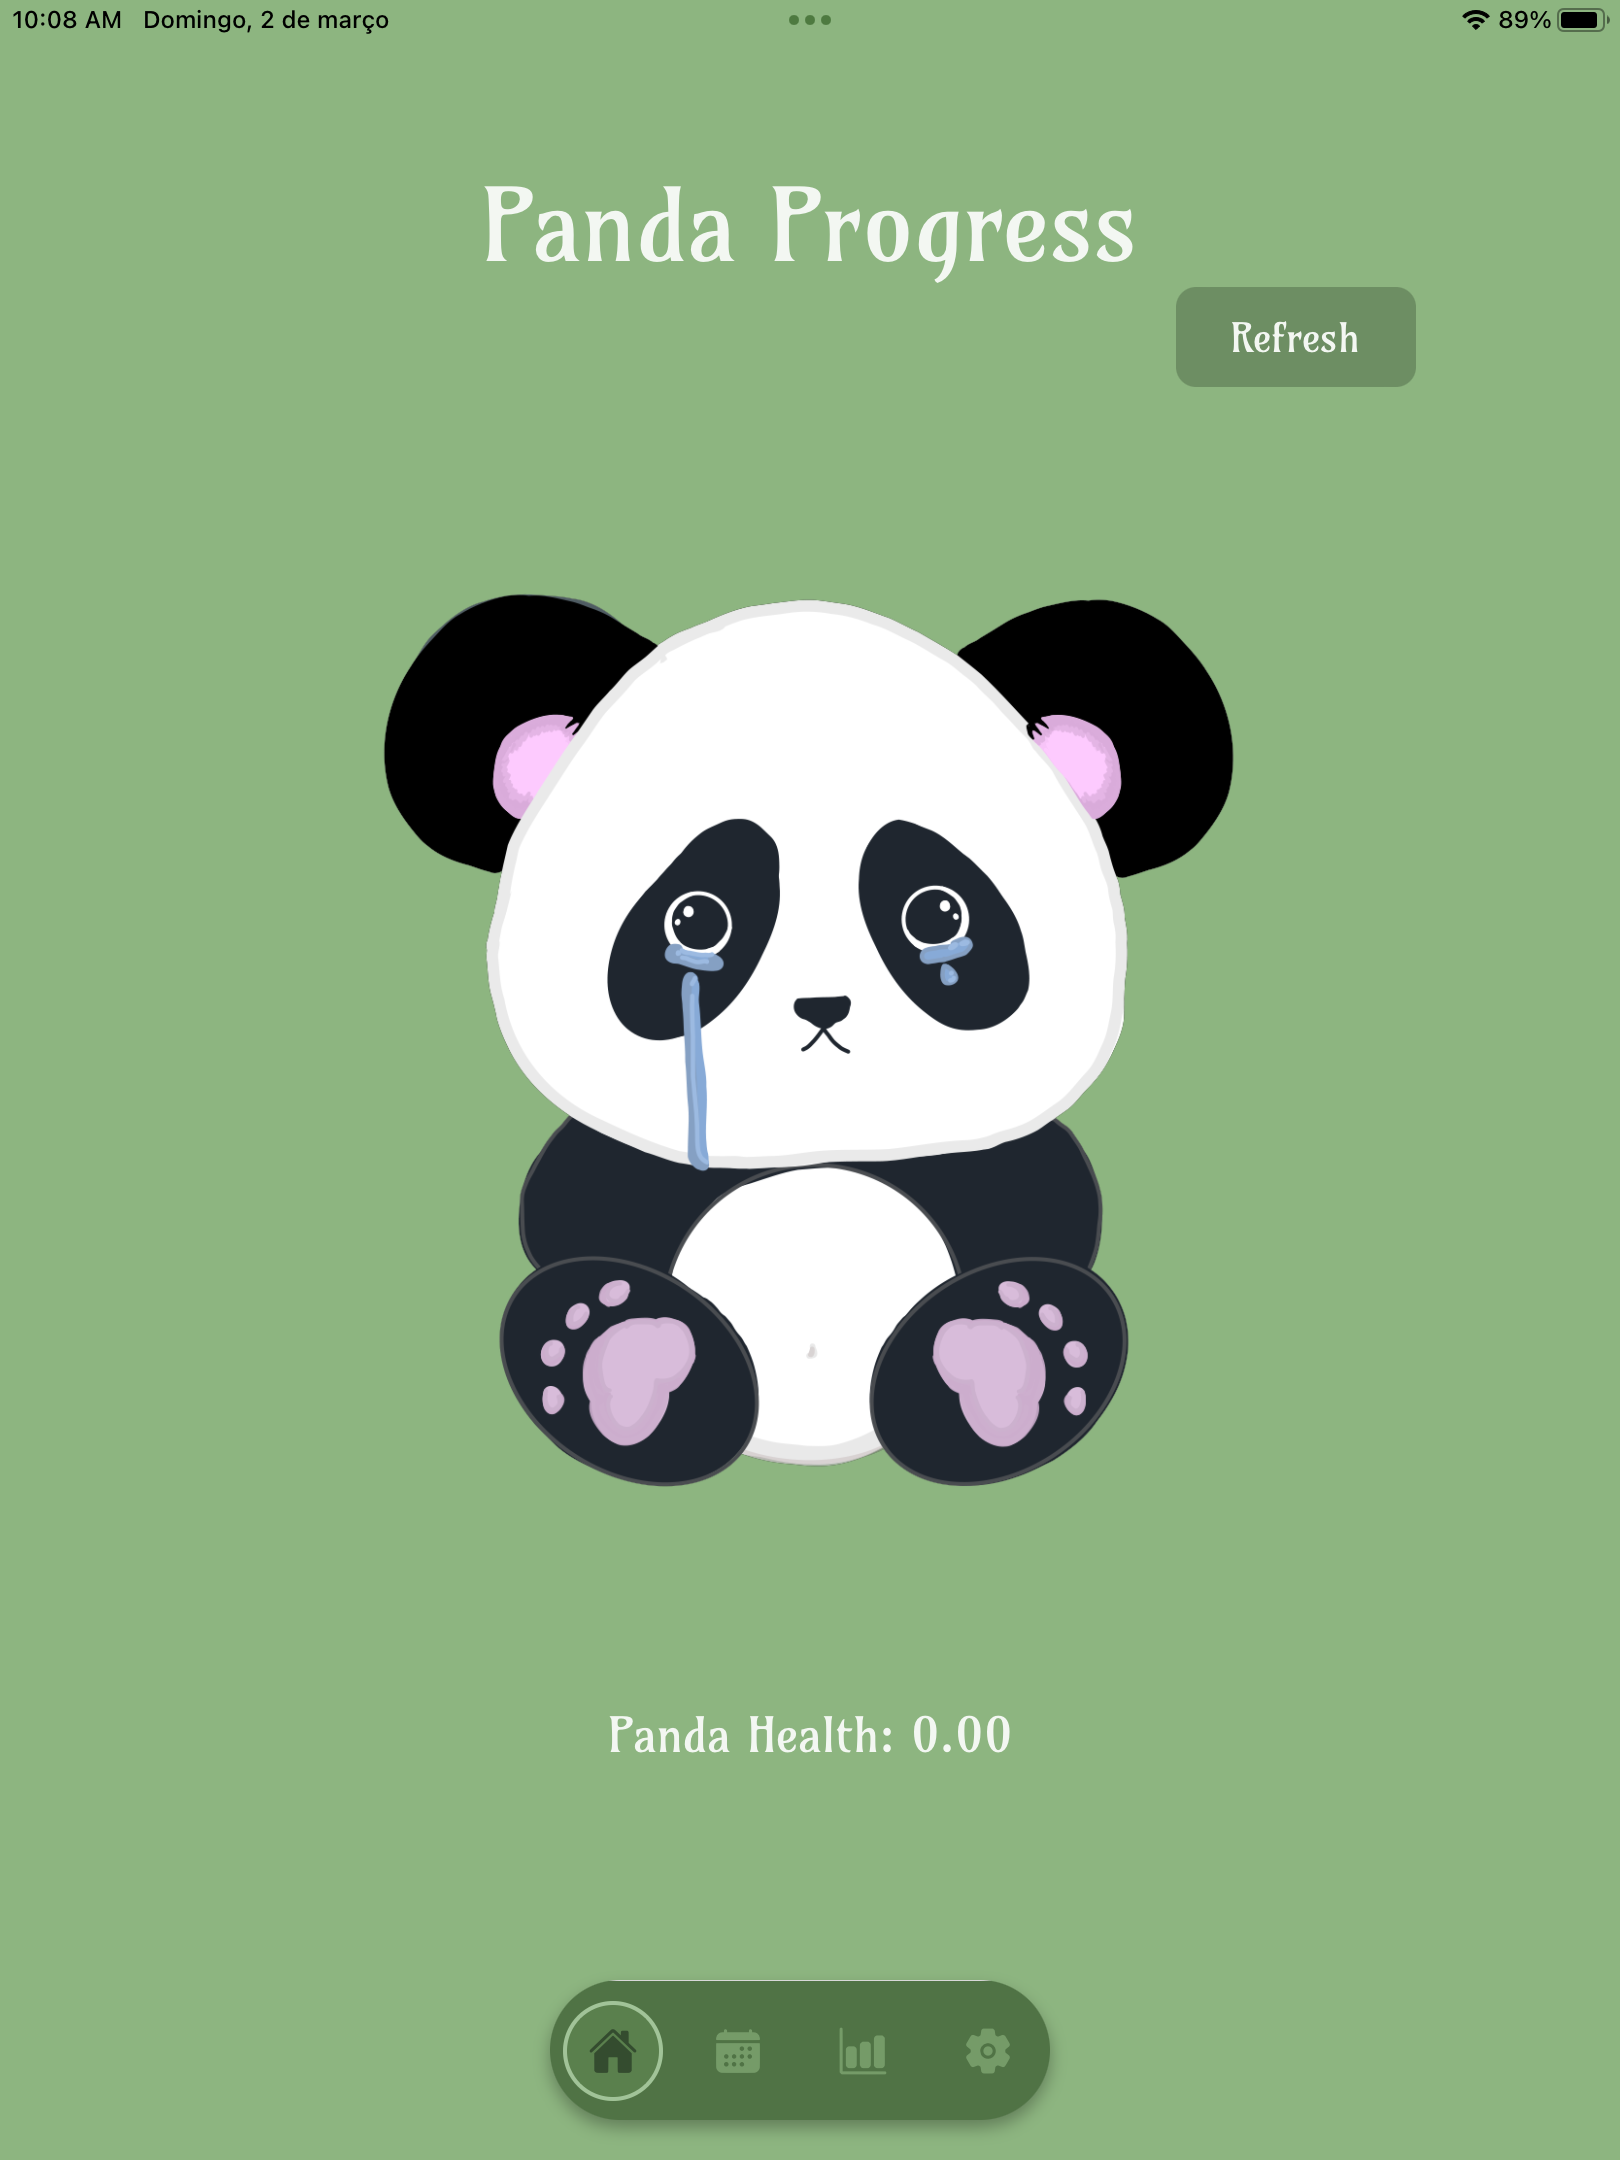
PandaProgressHomePageLowHealth
-
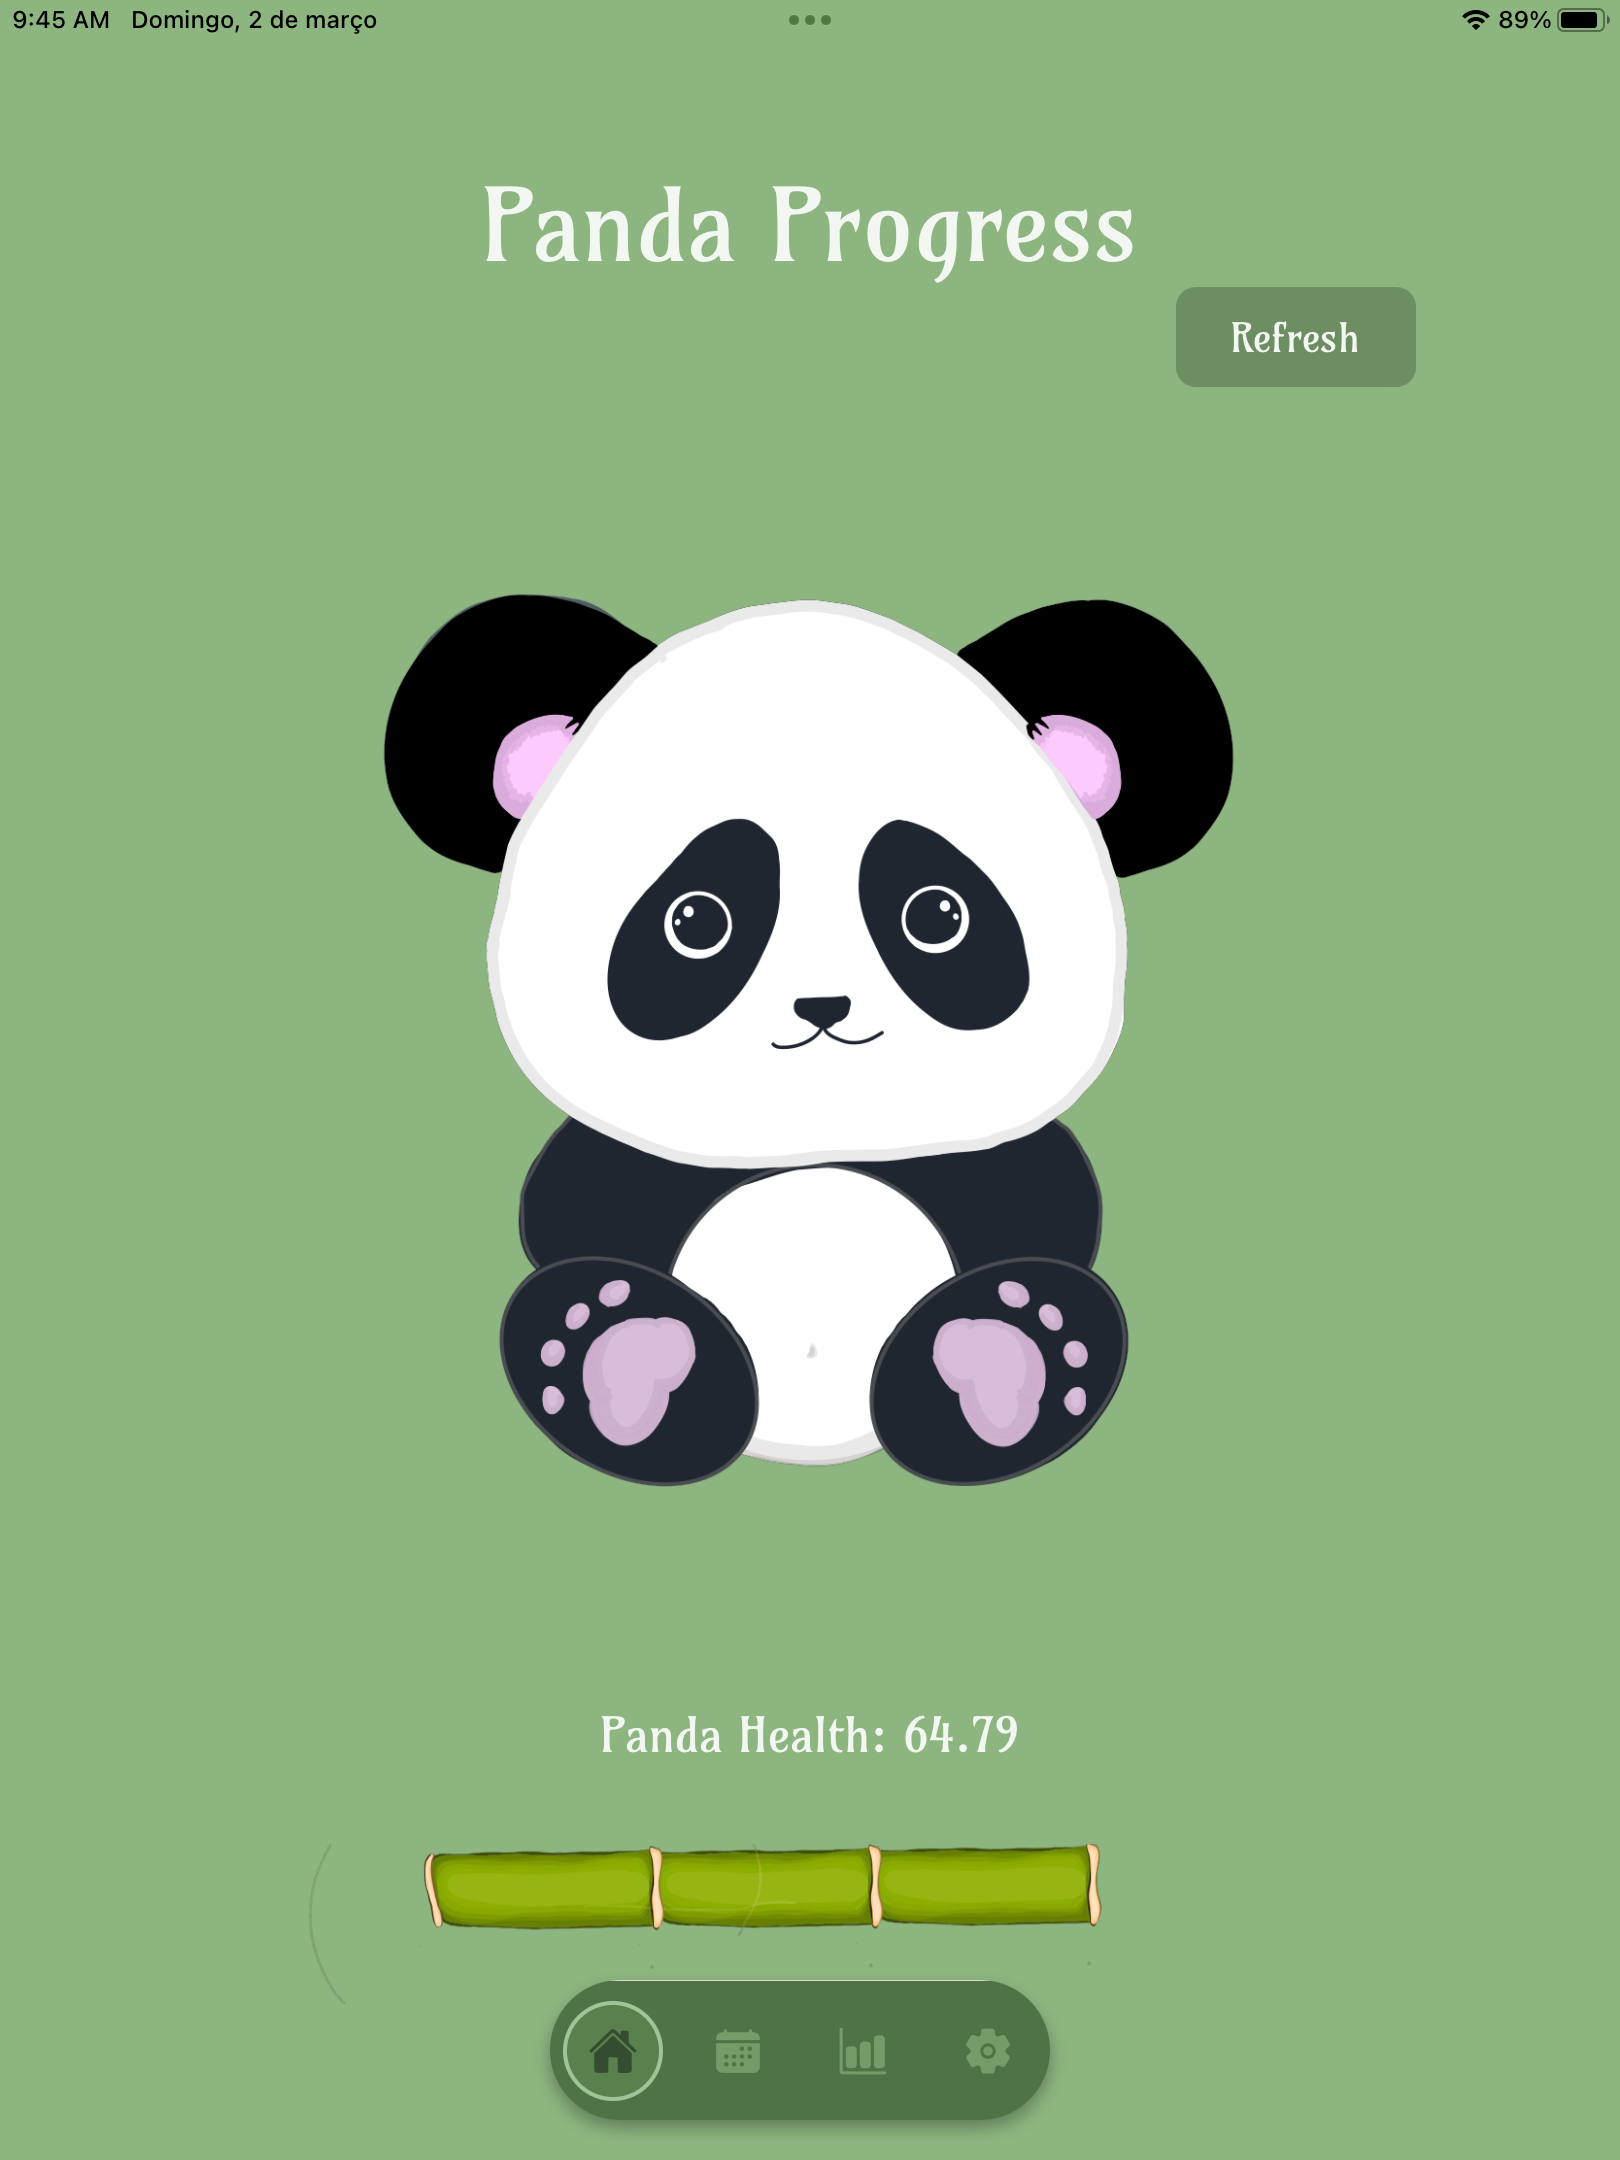
PandaPreogressHomePageHighHealth
-
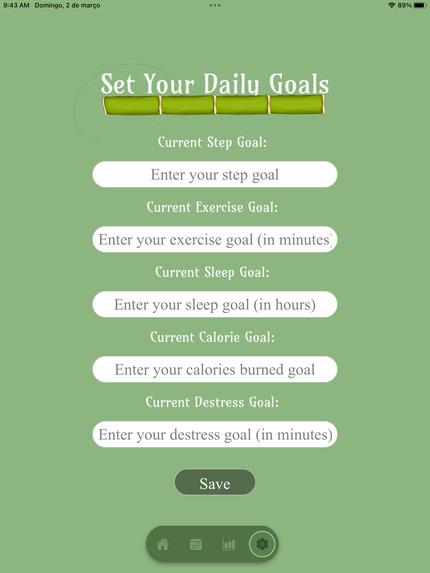
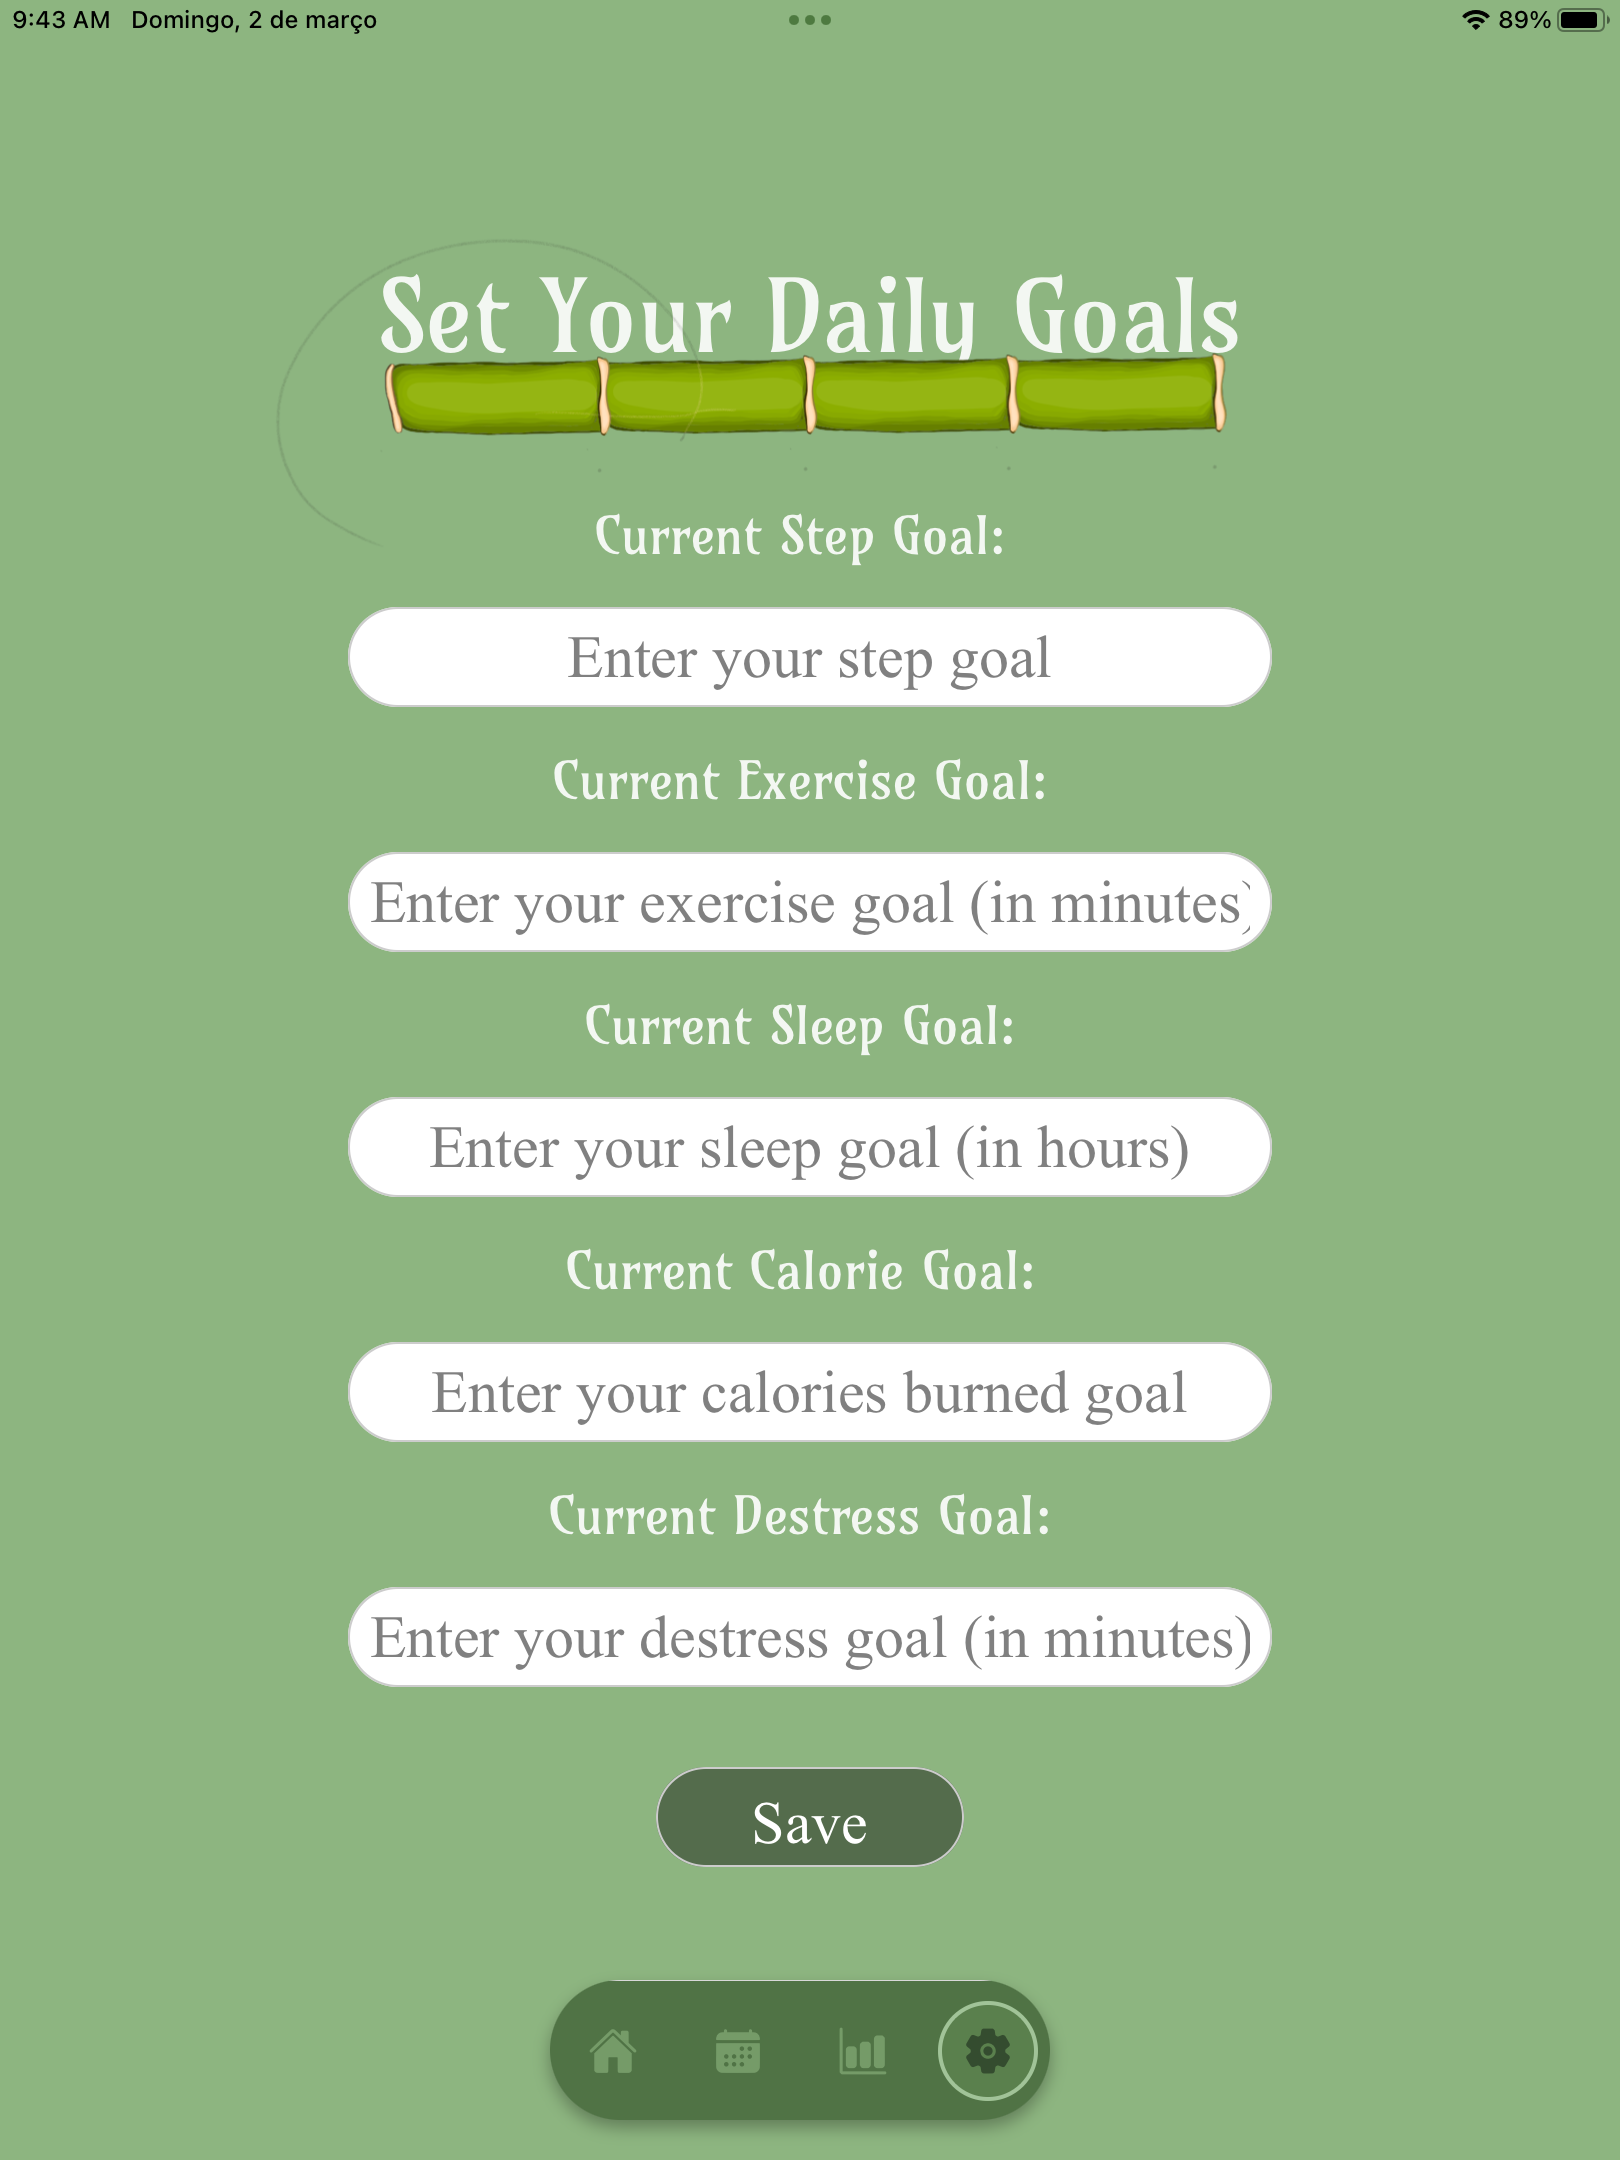
DailyGoalSetter
-

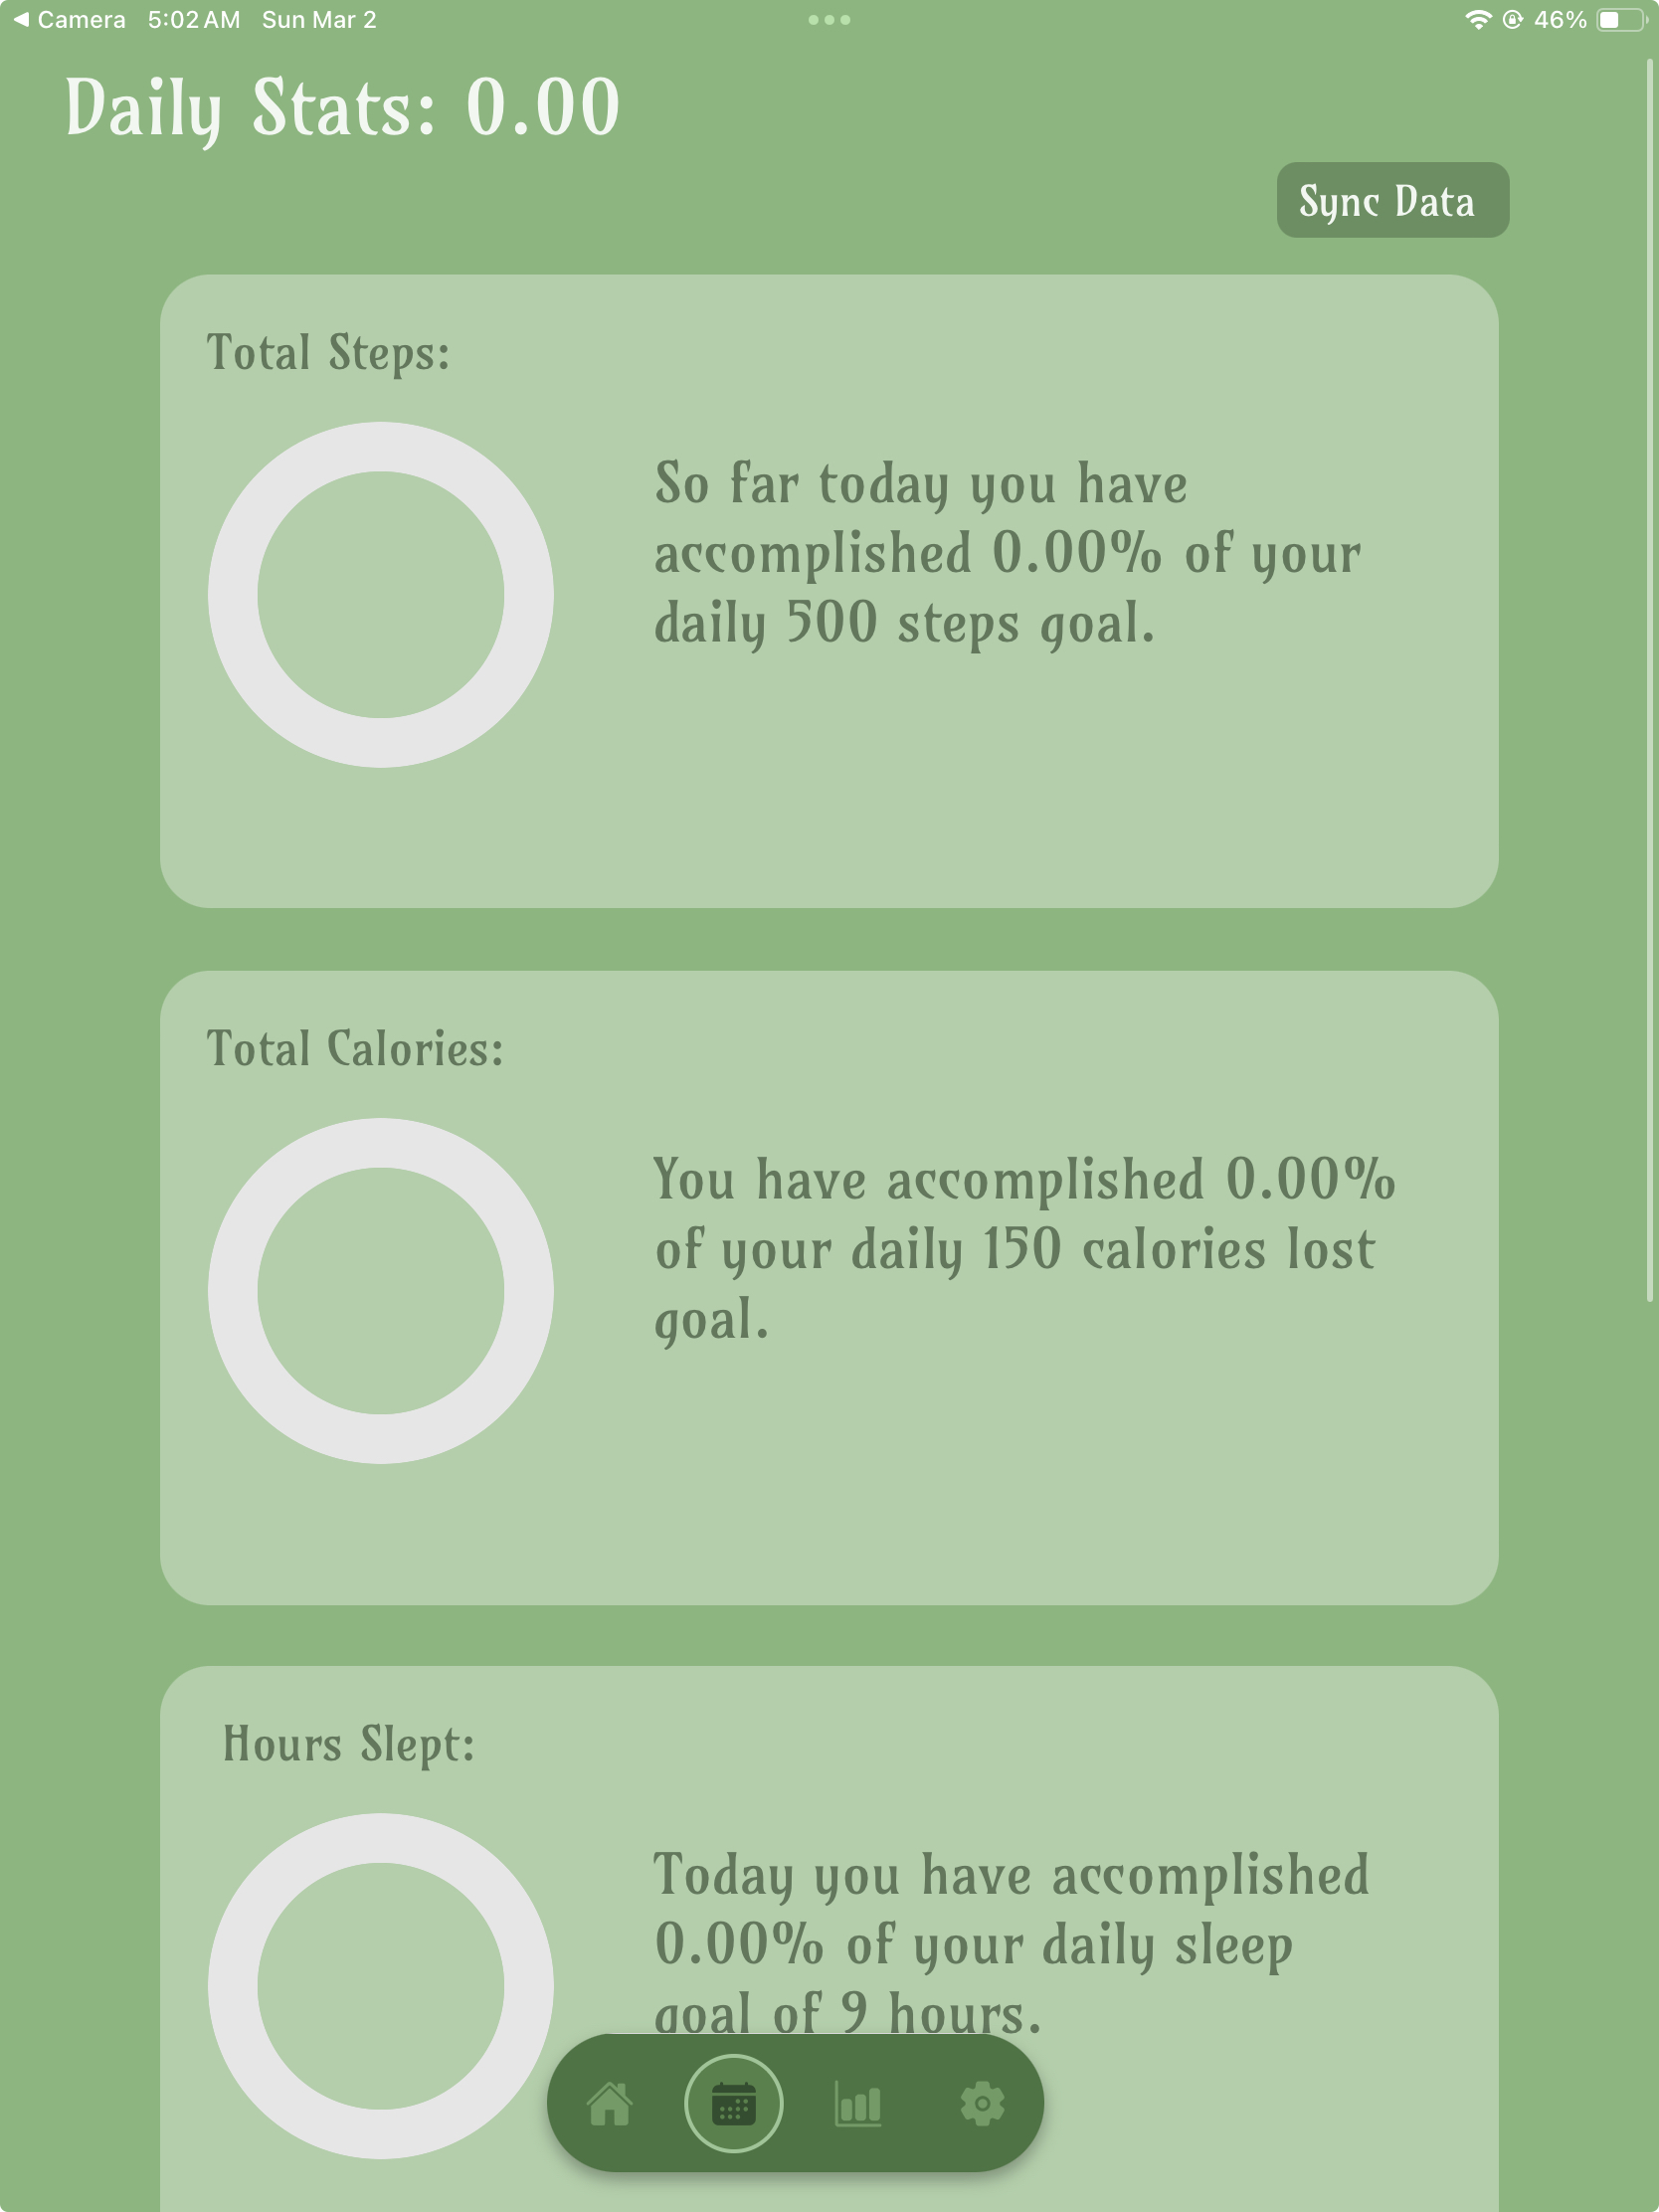
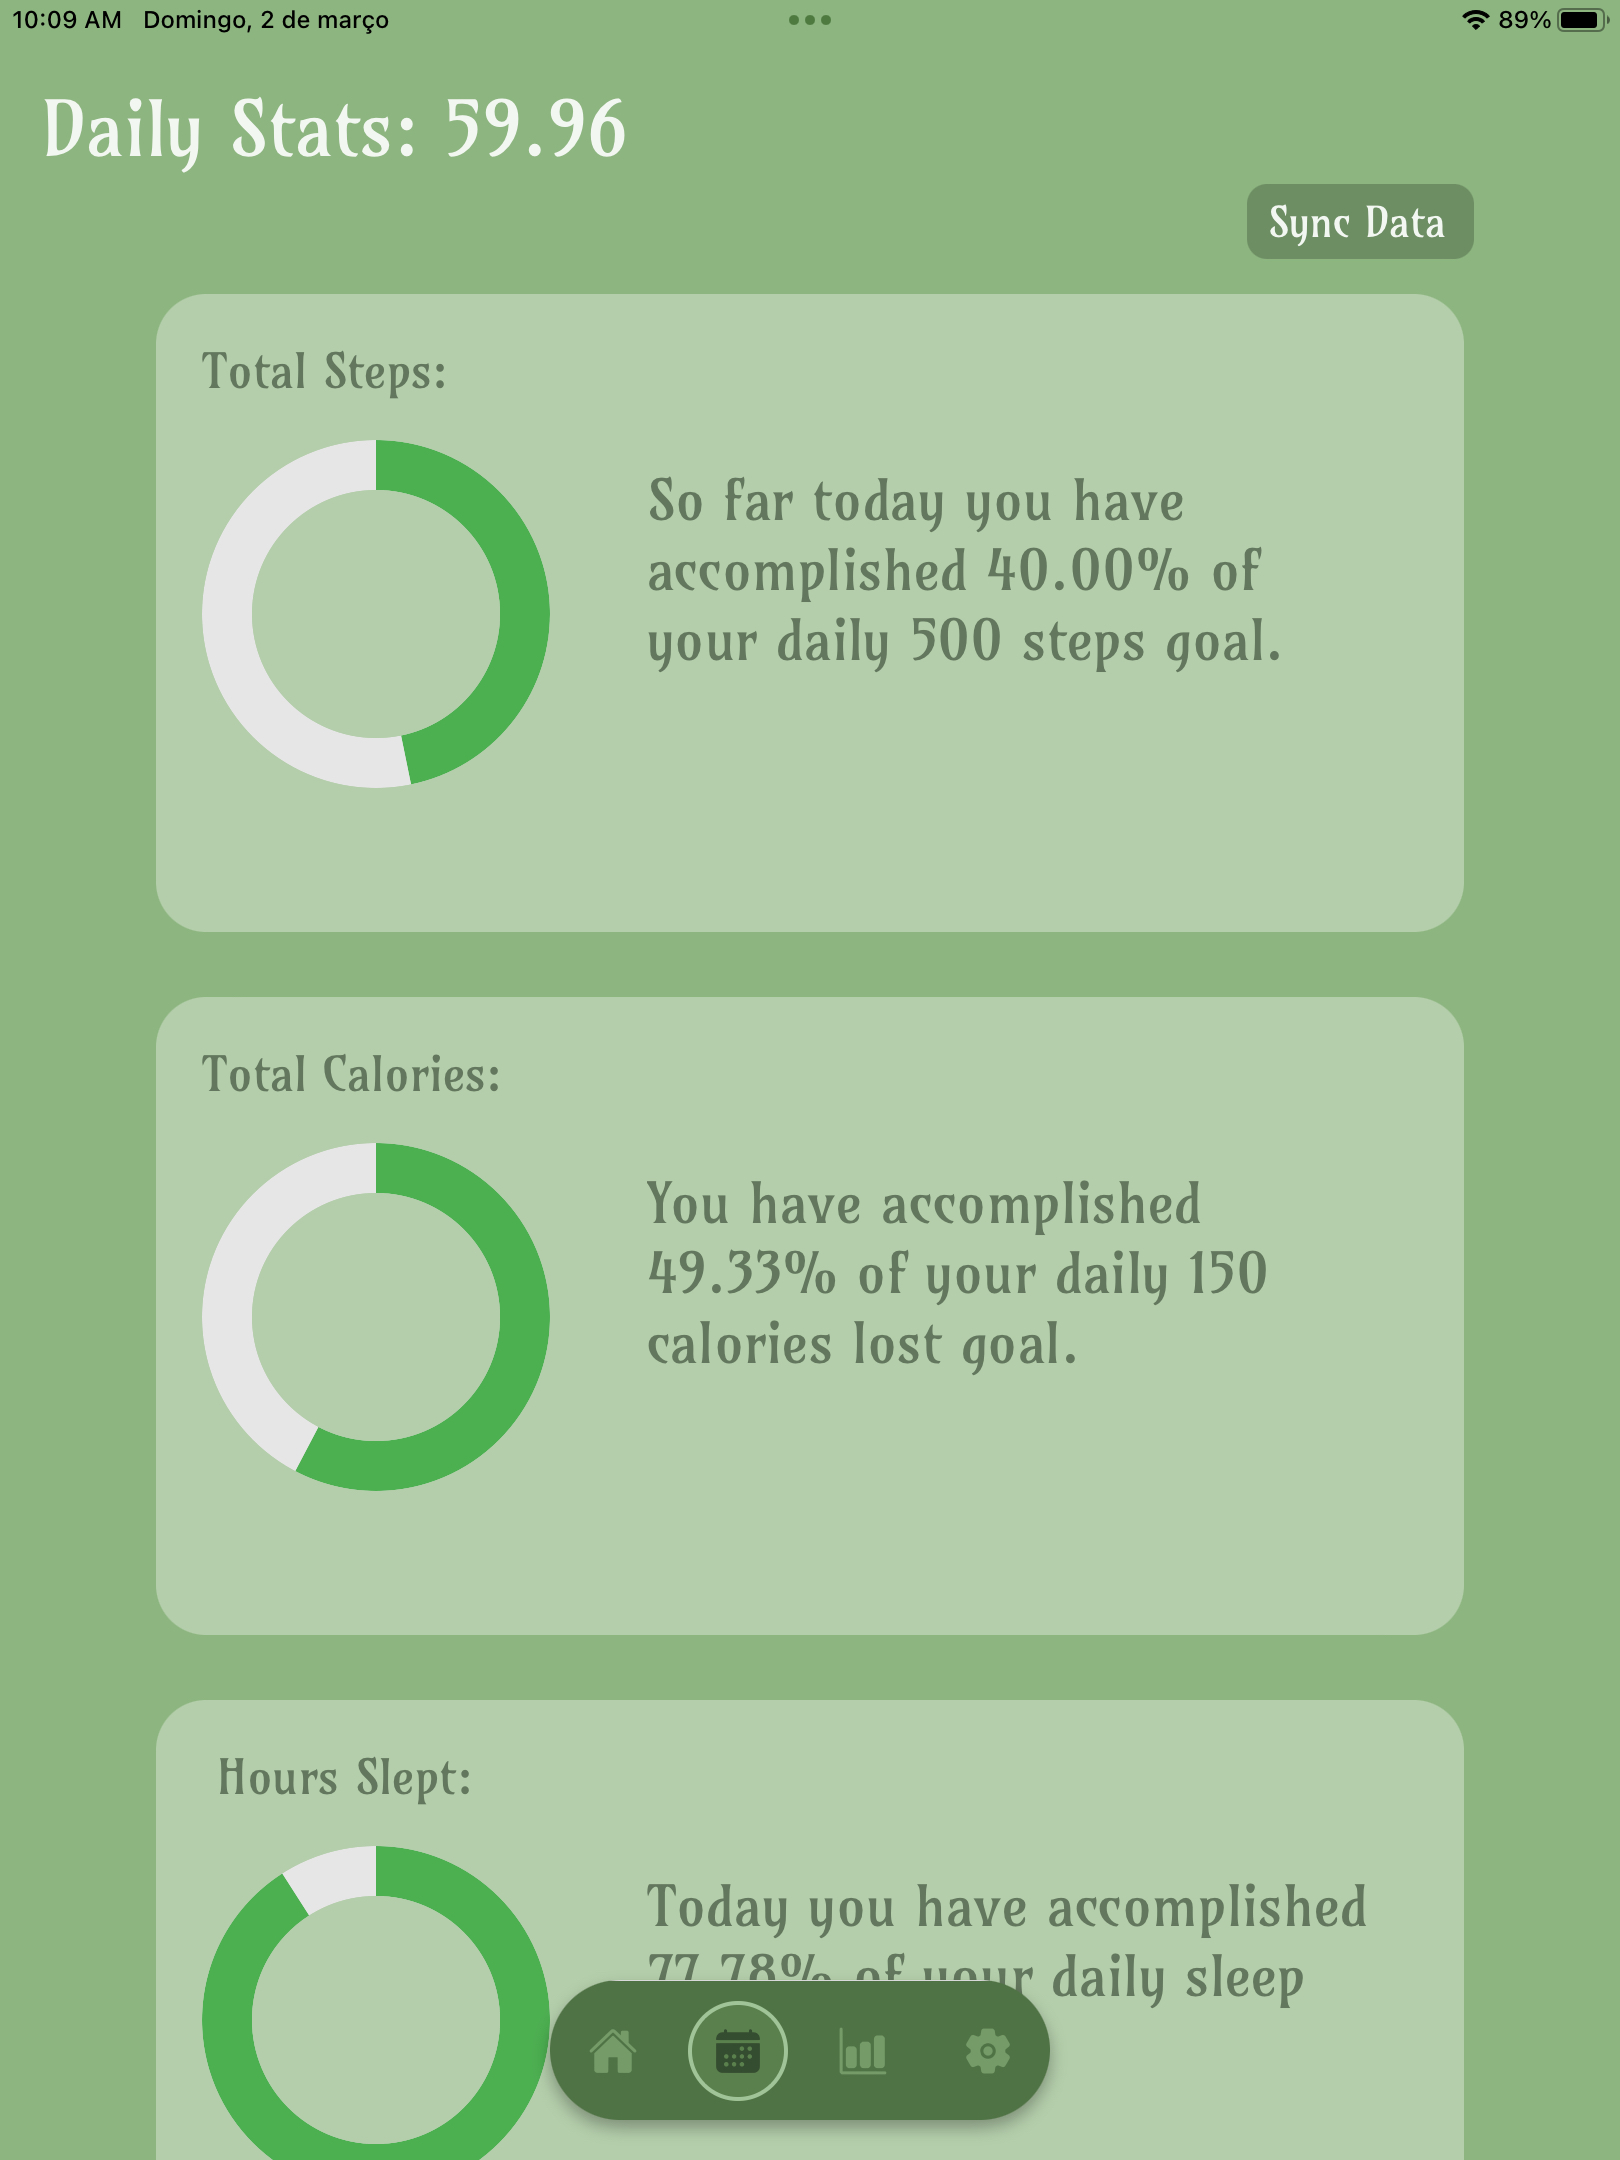
DailyStatus
-
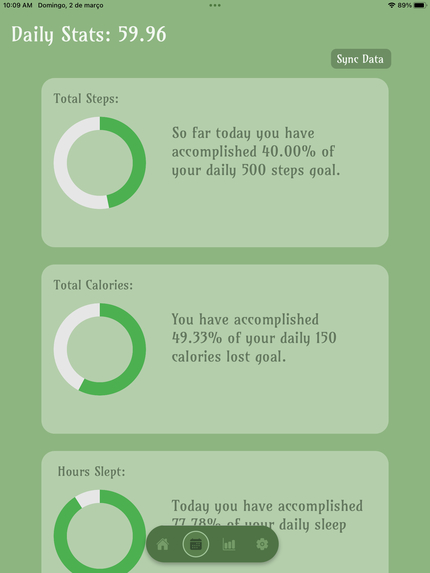
DailyStatusSync
-
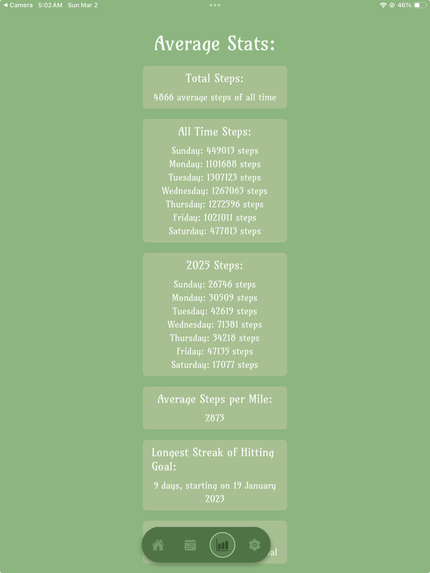
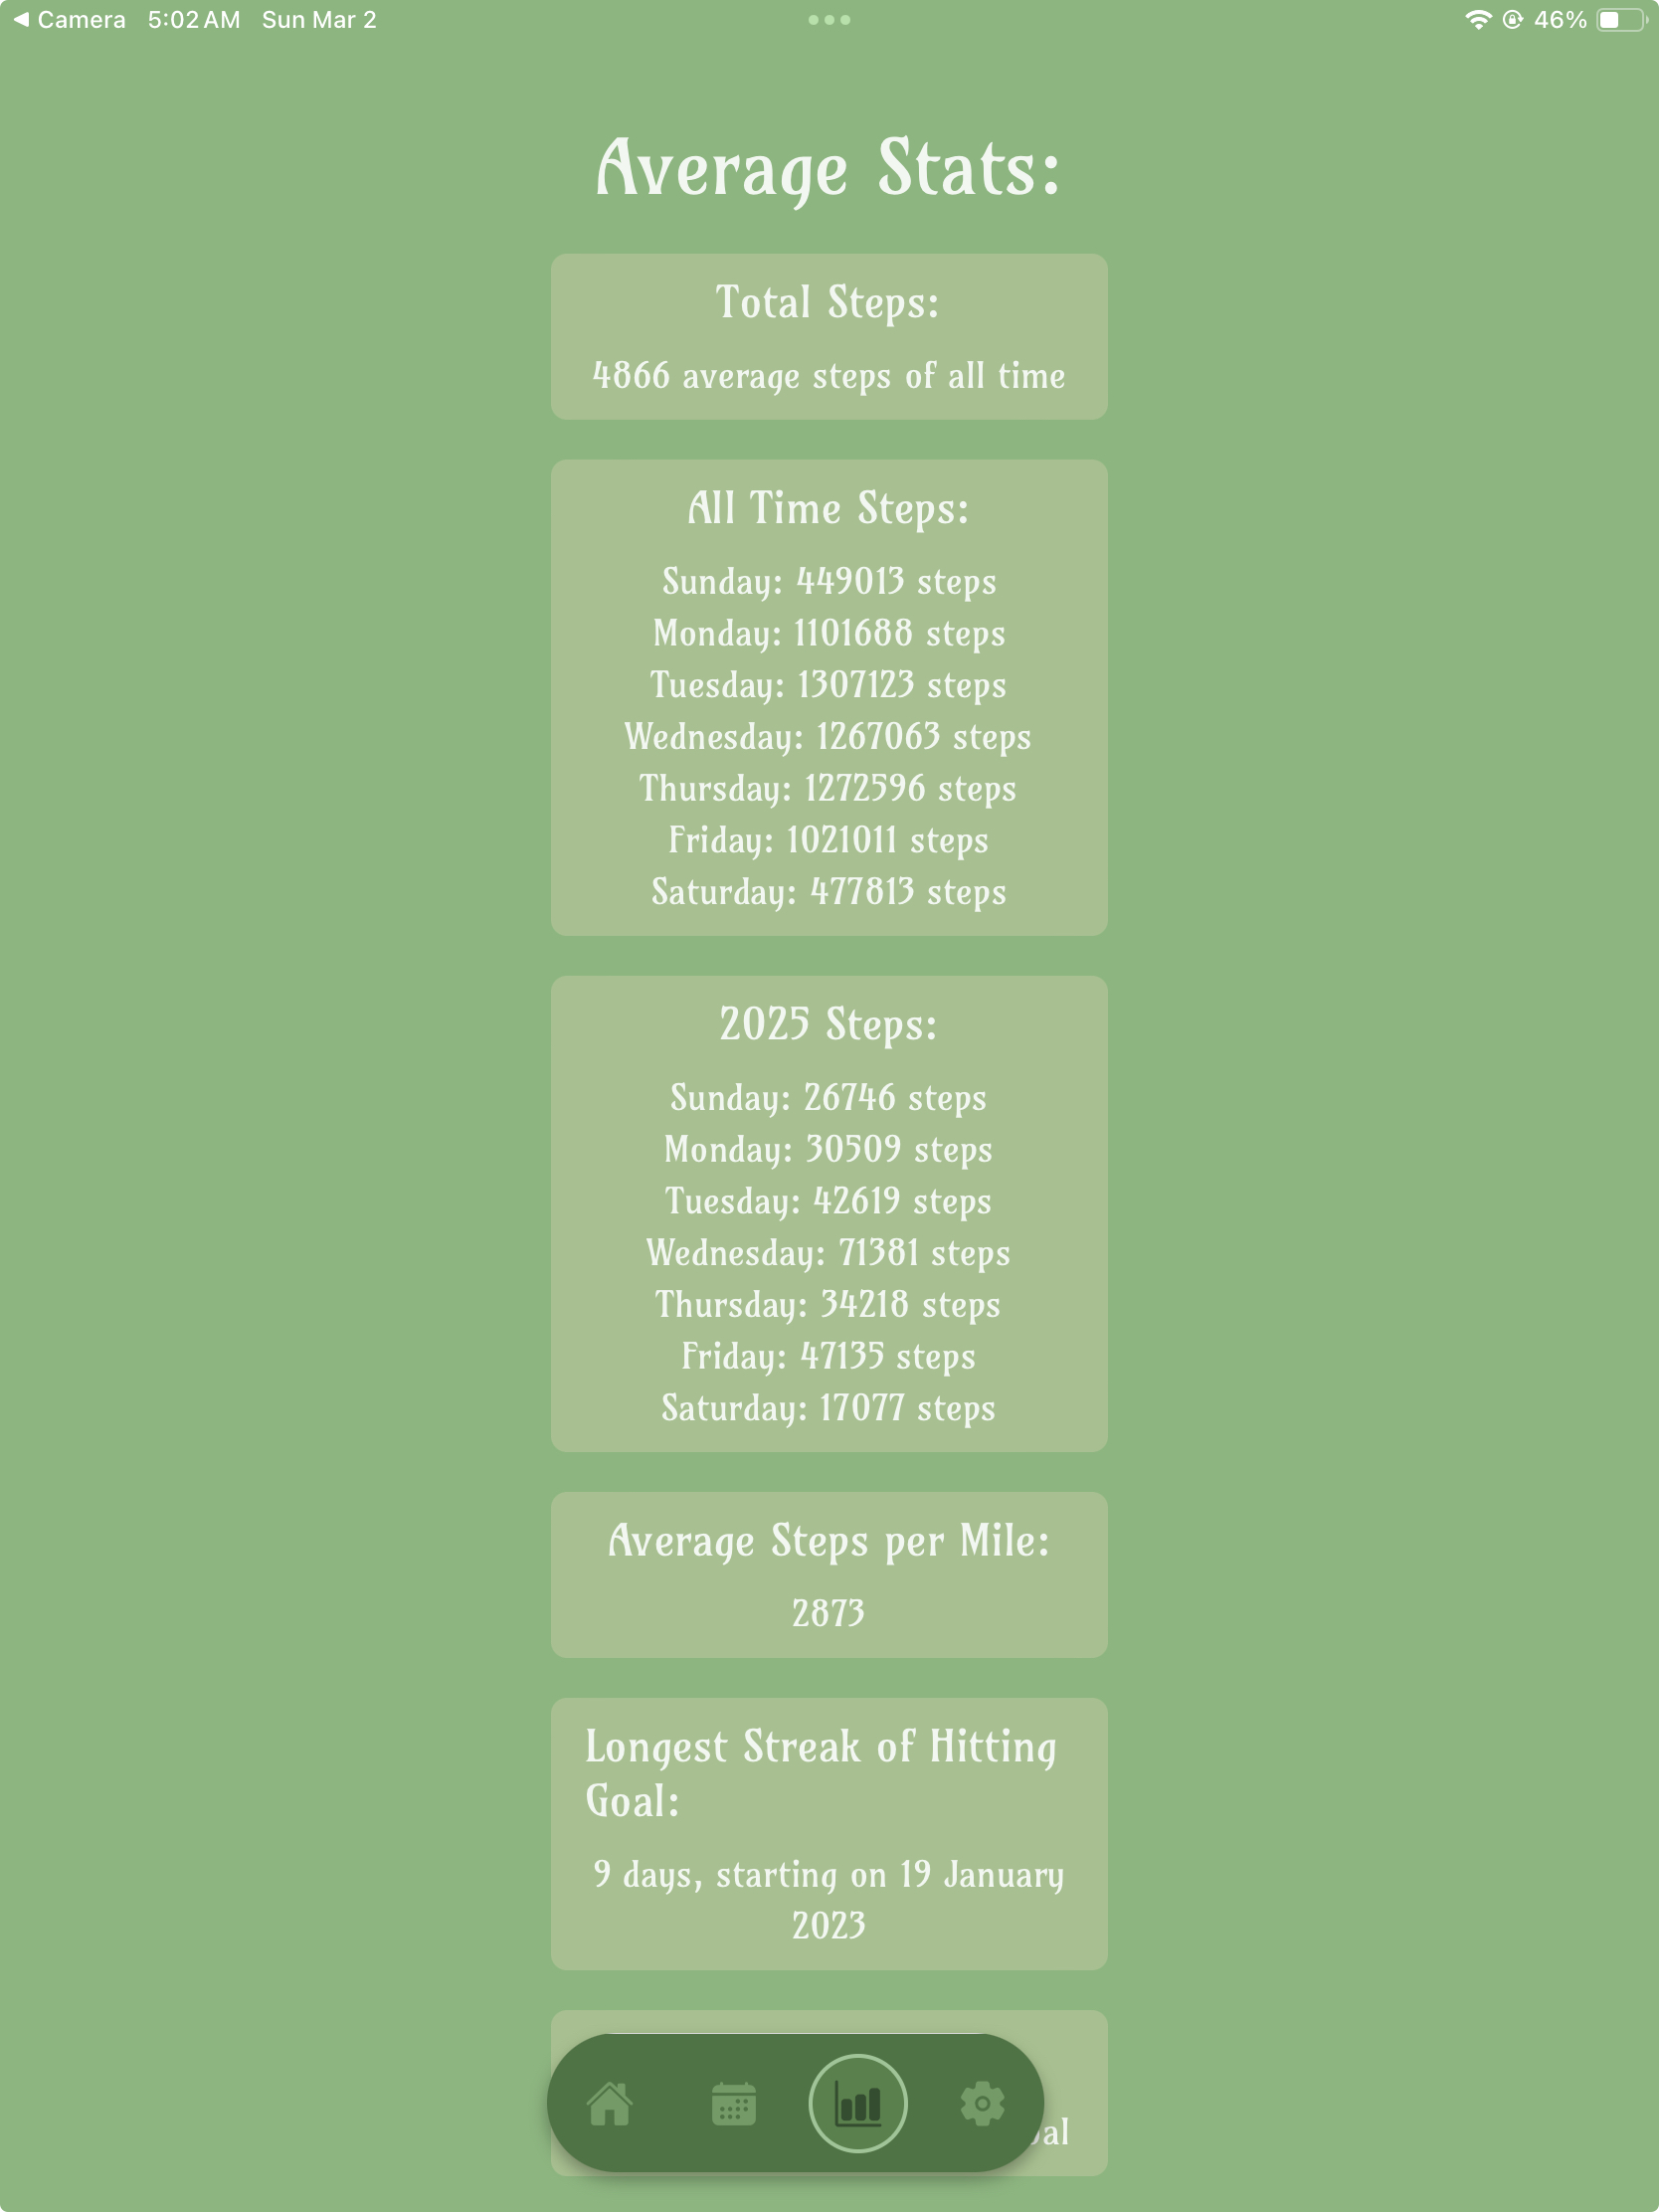
AverageStatistics
Inspiration
The inspiration was similar to the Health Tree Move app, we were inspired by utilizing a visual aid that users can get emotionally invested in, so that they are more motivated to reach their goals to properly take care of the panda.
What it does
This app takes real time health data from smart tracking watches, imports it into the app, and calculates how much daily progres the user has made for their daily goals. The app represents this progress through our Panda's health status. The lower health the Panda the lower the user progress has been, and the higher the health the closer they are to their daily progress goals.
How we built it
We built this utilizing Expo an open source platform that can develop for ios, web, and android devices. By working in TypeScript with React, we were able to develop our code to run our app. Using SmallTalk we developed a script that takes data say from an Apple Watch health app, and converts it to be readily available for sourcing into our application.
Challenges we ran into
We ran into various dependency issues, as well as trying to manage the niche aspects that separates itself from React, a different environment developer that all of us have more experience with. We ran into some various issues with screen management, especially when it comes to sending various data over from screen to screen.
Accomplishments that we're proud of
How quickly we were able to adapt to Expo to create our UI, as well as our data management when we had some struggle with time and not being able to get 100% proper integration with an apple watch health API.
What we learned
We learned that trying to connect emotionally to users is what is key when it comes to Health and Wellness applications, because when they are invested they are much more productive.
What's next for Panda Progress
Full integration for an API to constantly pull the users health data, and distribute it out properly to the correct screens. Animating the Panda so that the user gets a better visual experience for when it has low health, and animations for when they user creates their daily task. For our "Average Stats" screen we want to integrate various graphs to show the user patterns in their progress week to week, and so they can see the areas where they aren't as motivated in, so they can pay special attention in the future. Additionally, we would like to create a zoo, where for each day that the user completes their daily goal a panda is added to the zoo, so they can visually see their progress and how many days they have accomplished their goals.
Built With
- adobe-fresco
- expogo
- react-native
- smalltalk
- typescript
- vscode

Log in or sign up for Devpost to join the conversation.