-

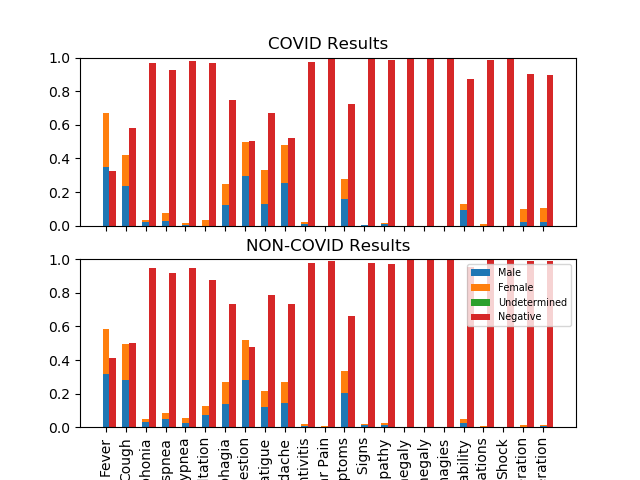
All symptoms (gender-distinction)
-
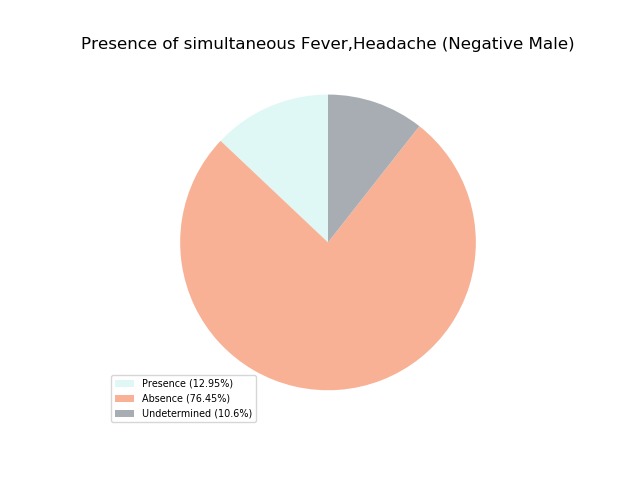
Two simultaneous symptoms on a negative covid patient
-
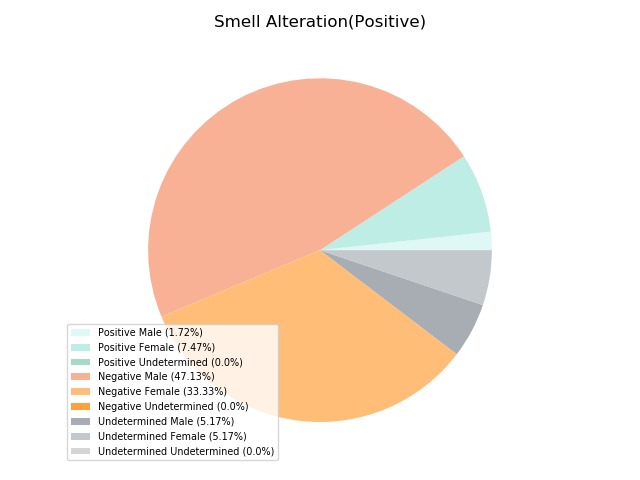
Smell alteration diagnosis of patients who tested positive on covid
-

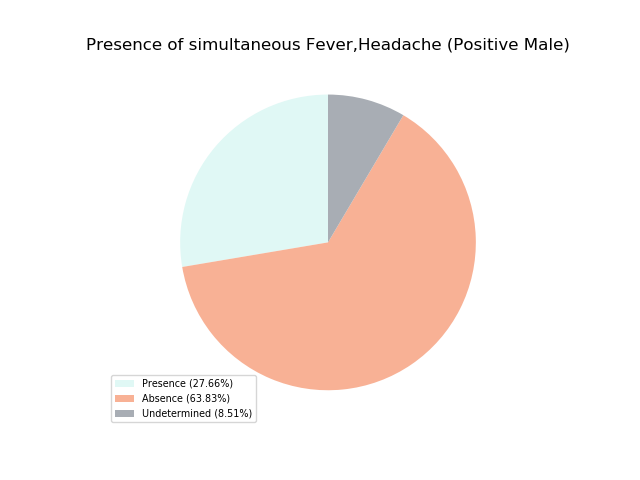
Two simultaneous symptoms on a positive covid patient
-
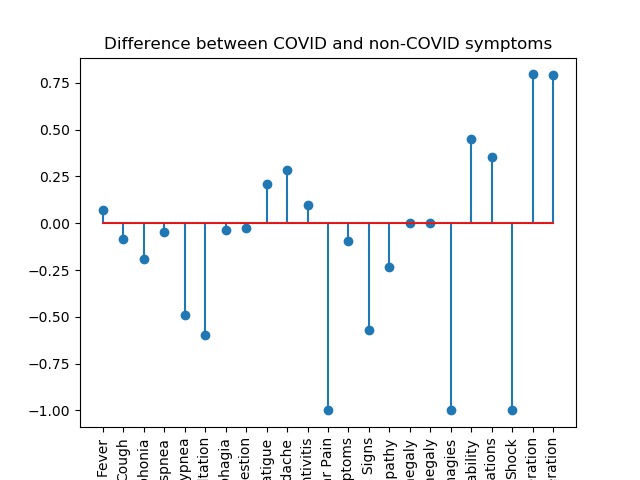
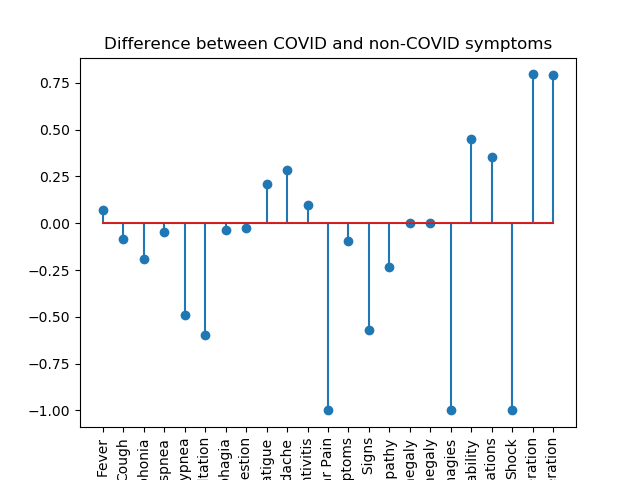
Deviation of every symptom


Inspiration
To ease the work of paediatricians diagnosing possible COVID-19 patients
What it does
Establishes a relation between symptoms and COVID-19
How I built it
Using python, creativity and time
Challenges I ran into
Formatting the data to an easy way to work with, not going mad with so many numbers, percentages and probabilities
Accomplishments that I'm proud of
Getting a final number that displays the probability of having so
What I learned
To work with .csv files and different types of plots
What's next for
Continue to make it more precise


Log in or sign up for Devpost to join the conversation.