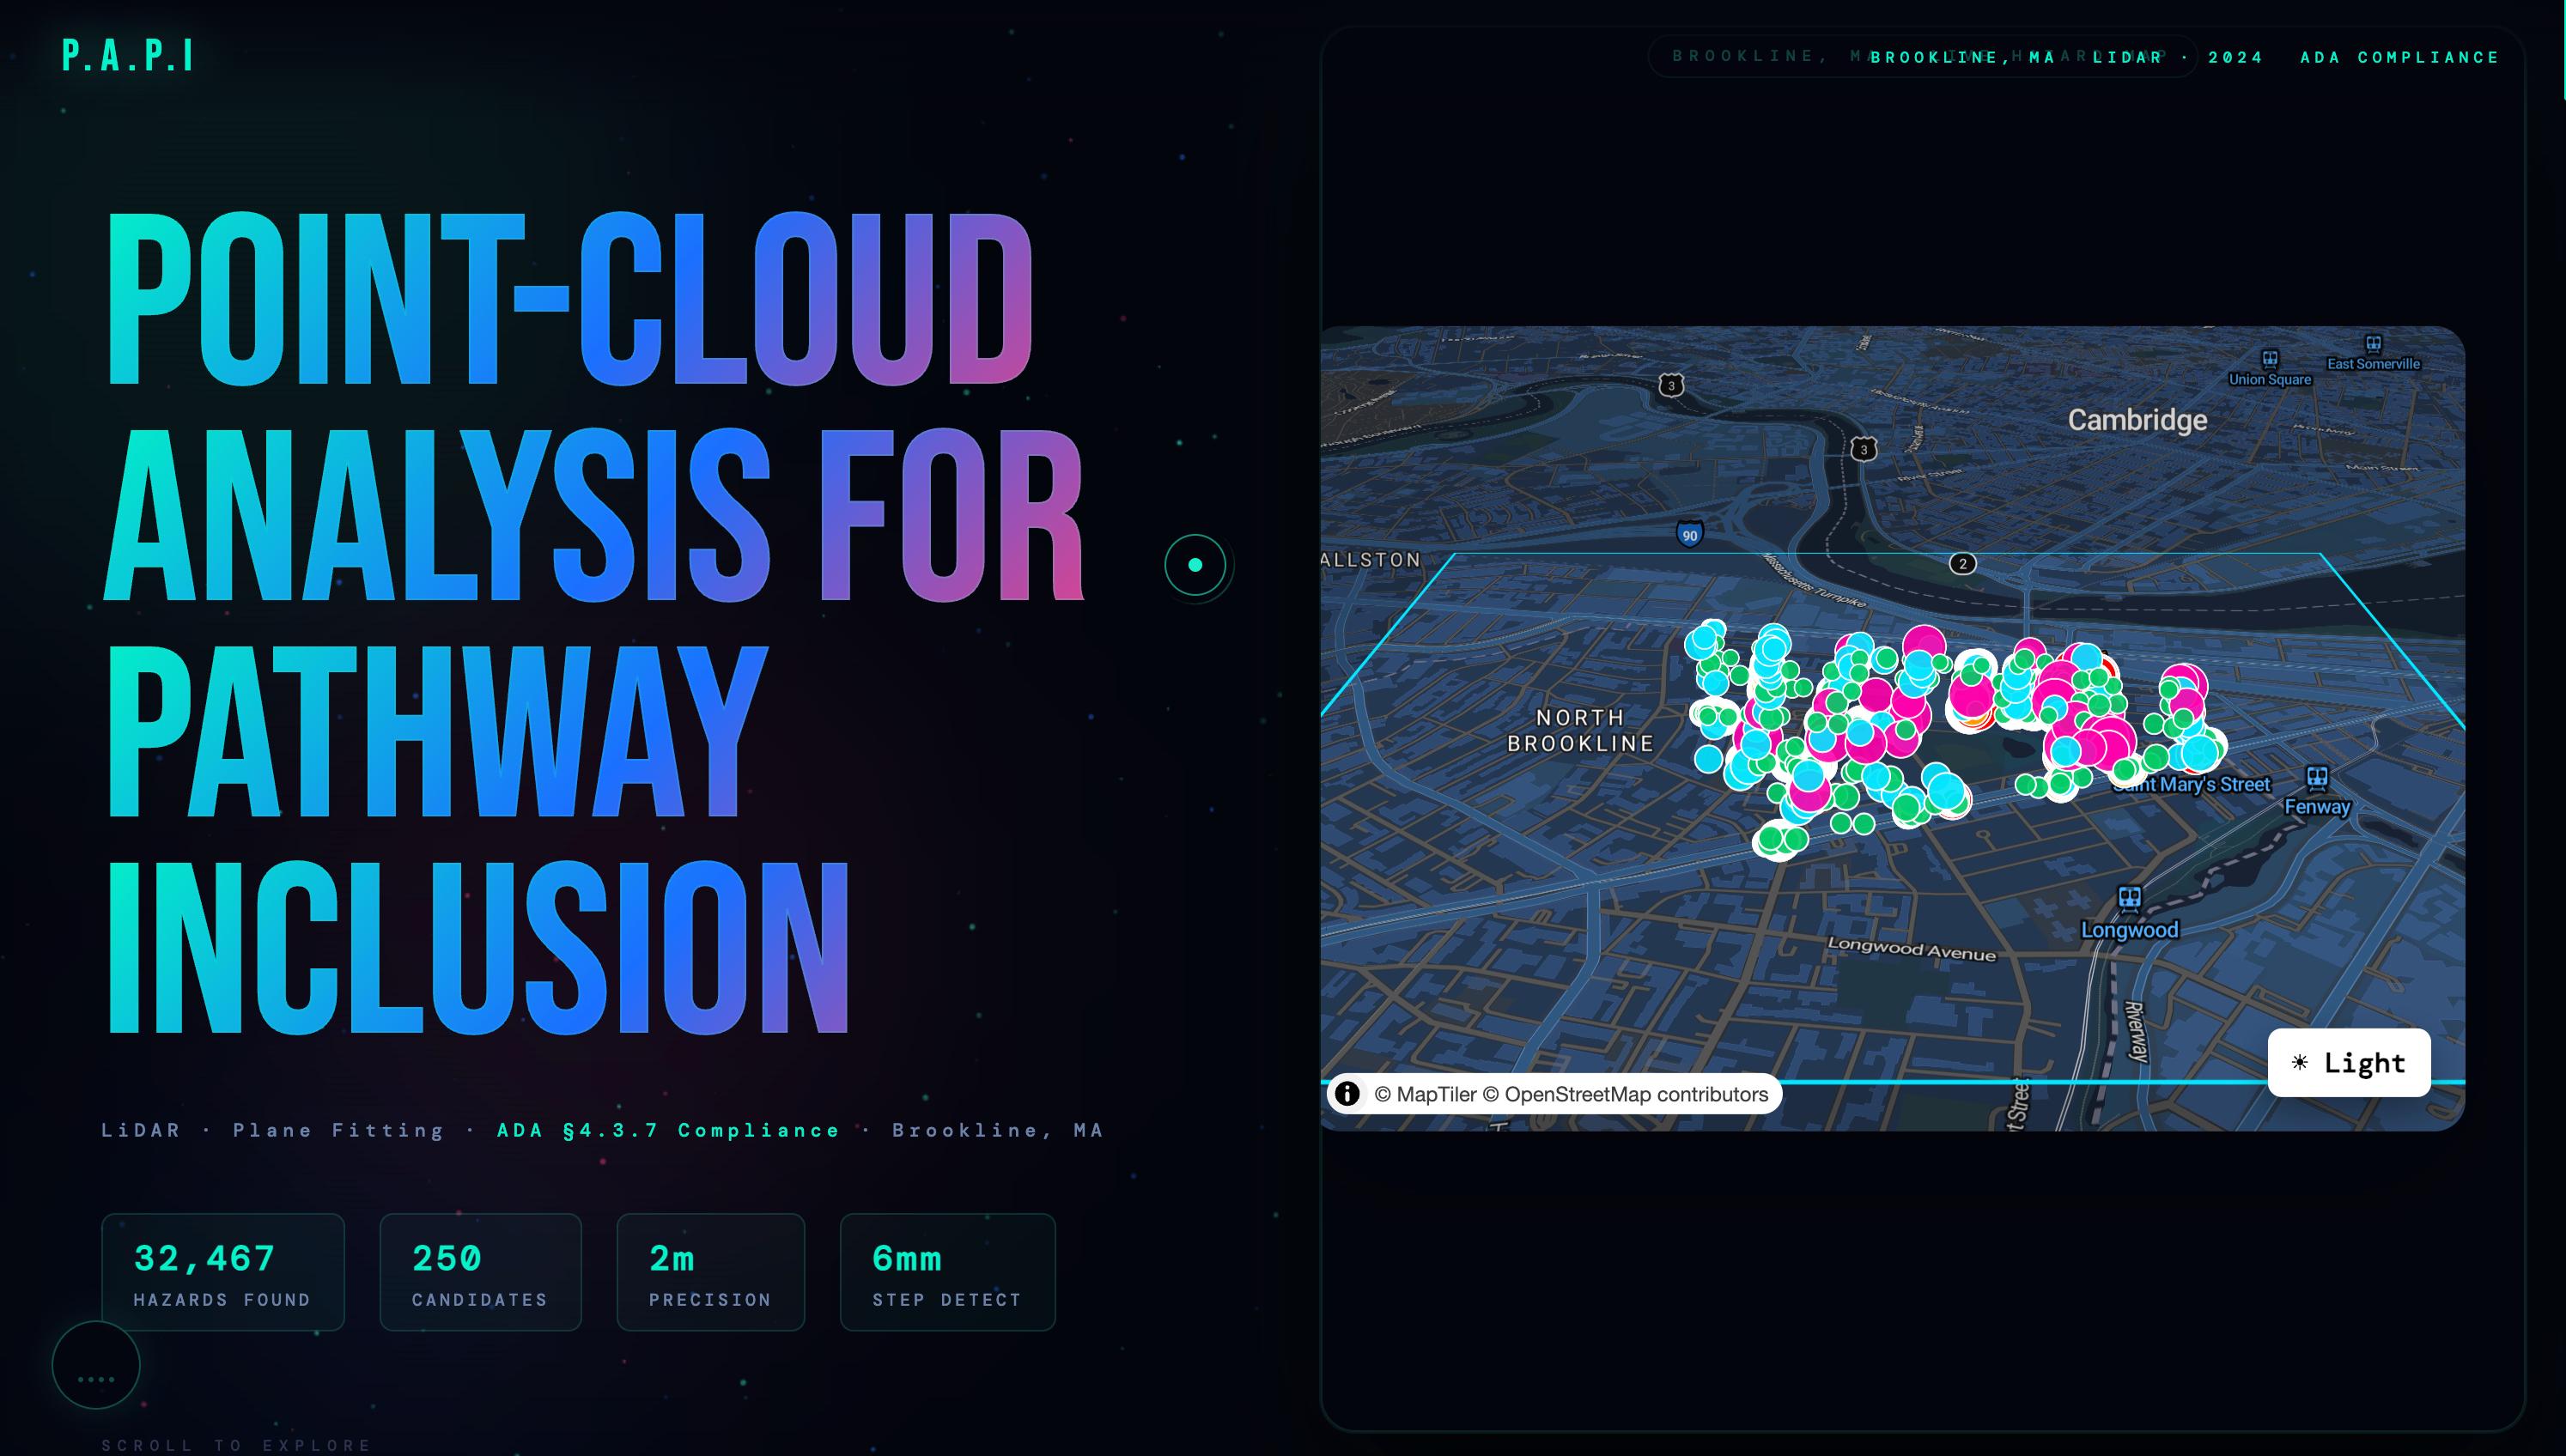
P.A.P.I — Point-cloud Analysis for Pathway Inclusion
Automated ADA sidewalk compliance detection using mobile LiDAR point clouds, plane-fitting mathematics, and real-time web visualization.
The Problem
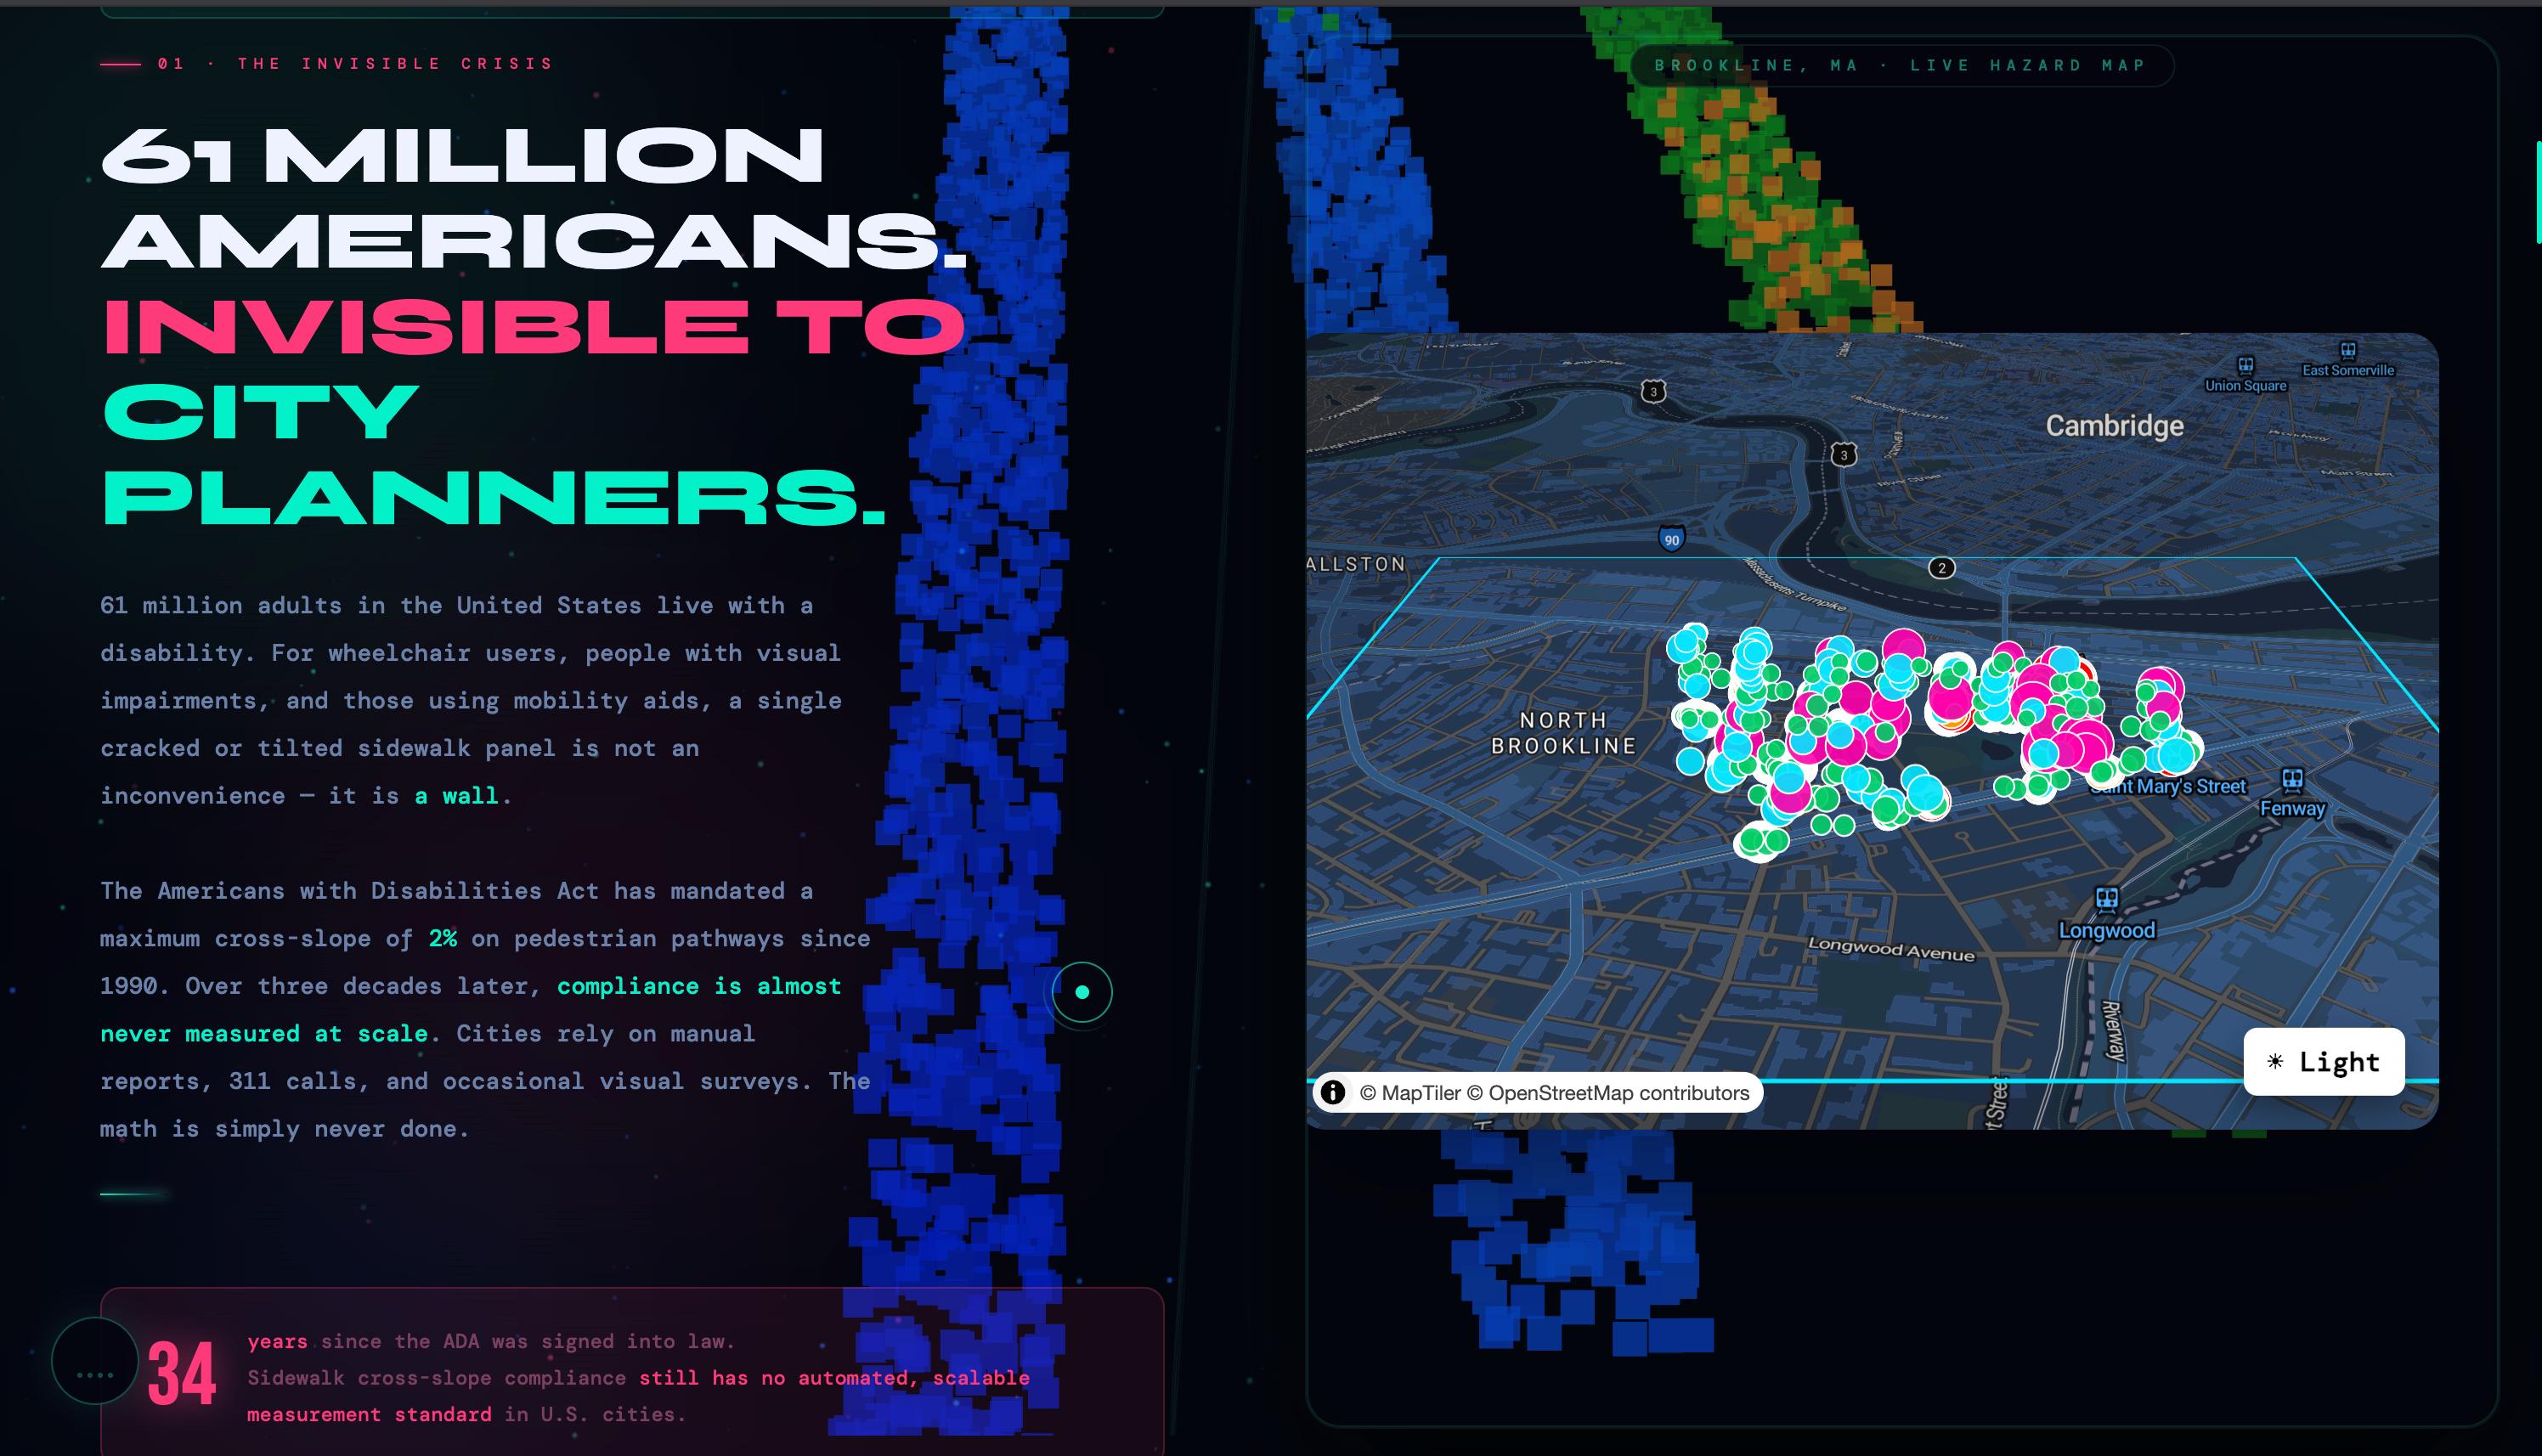
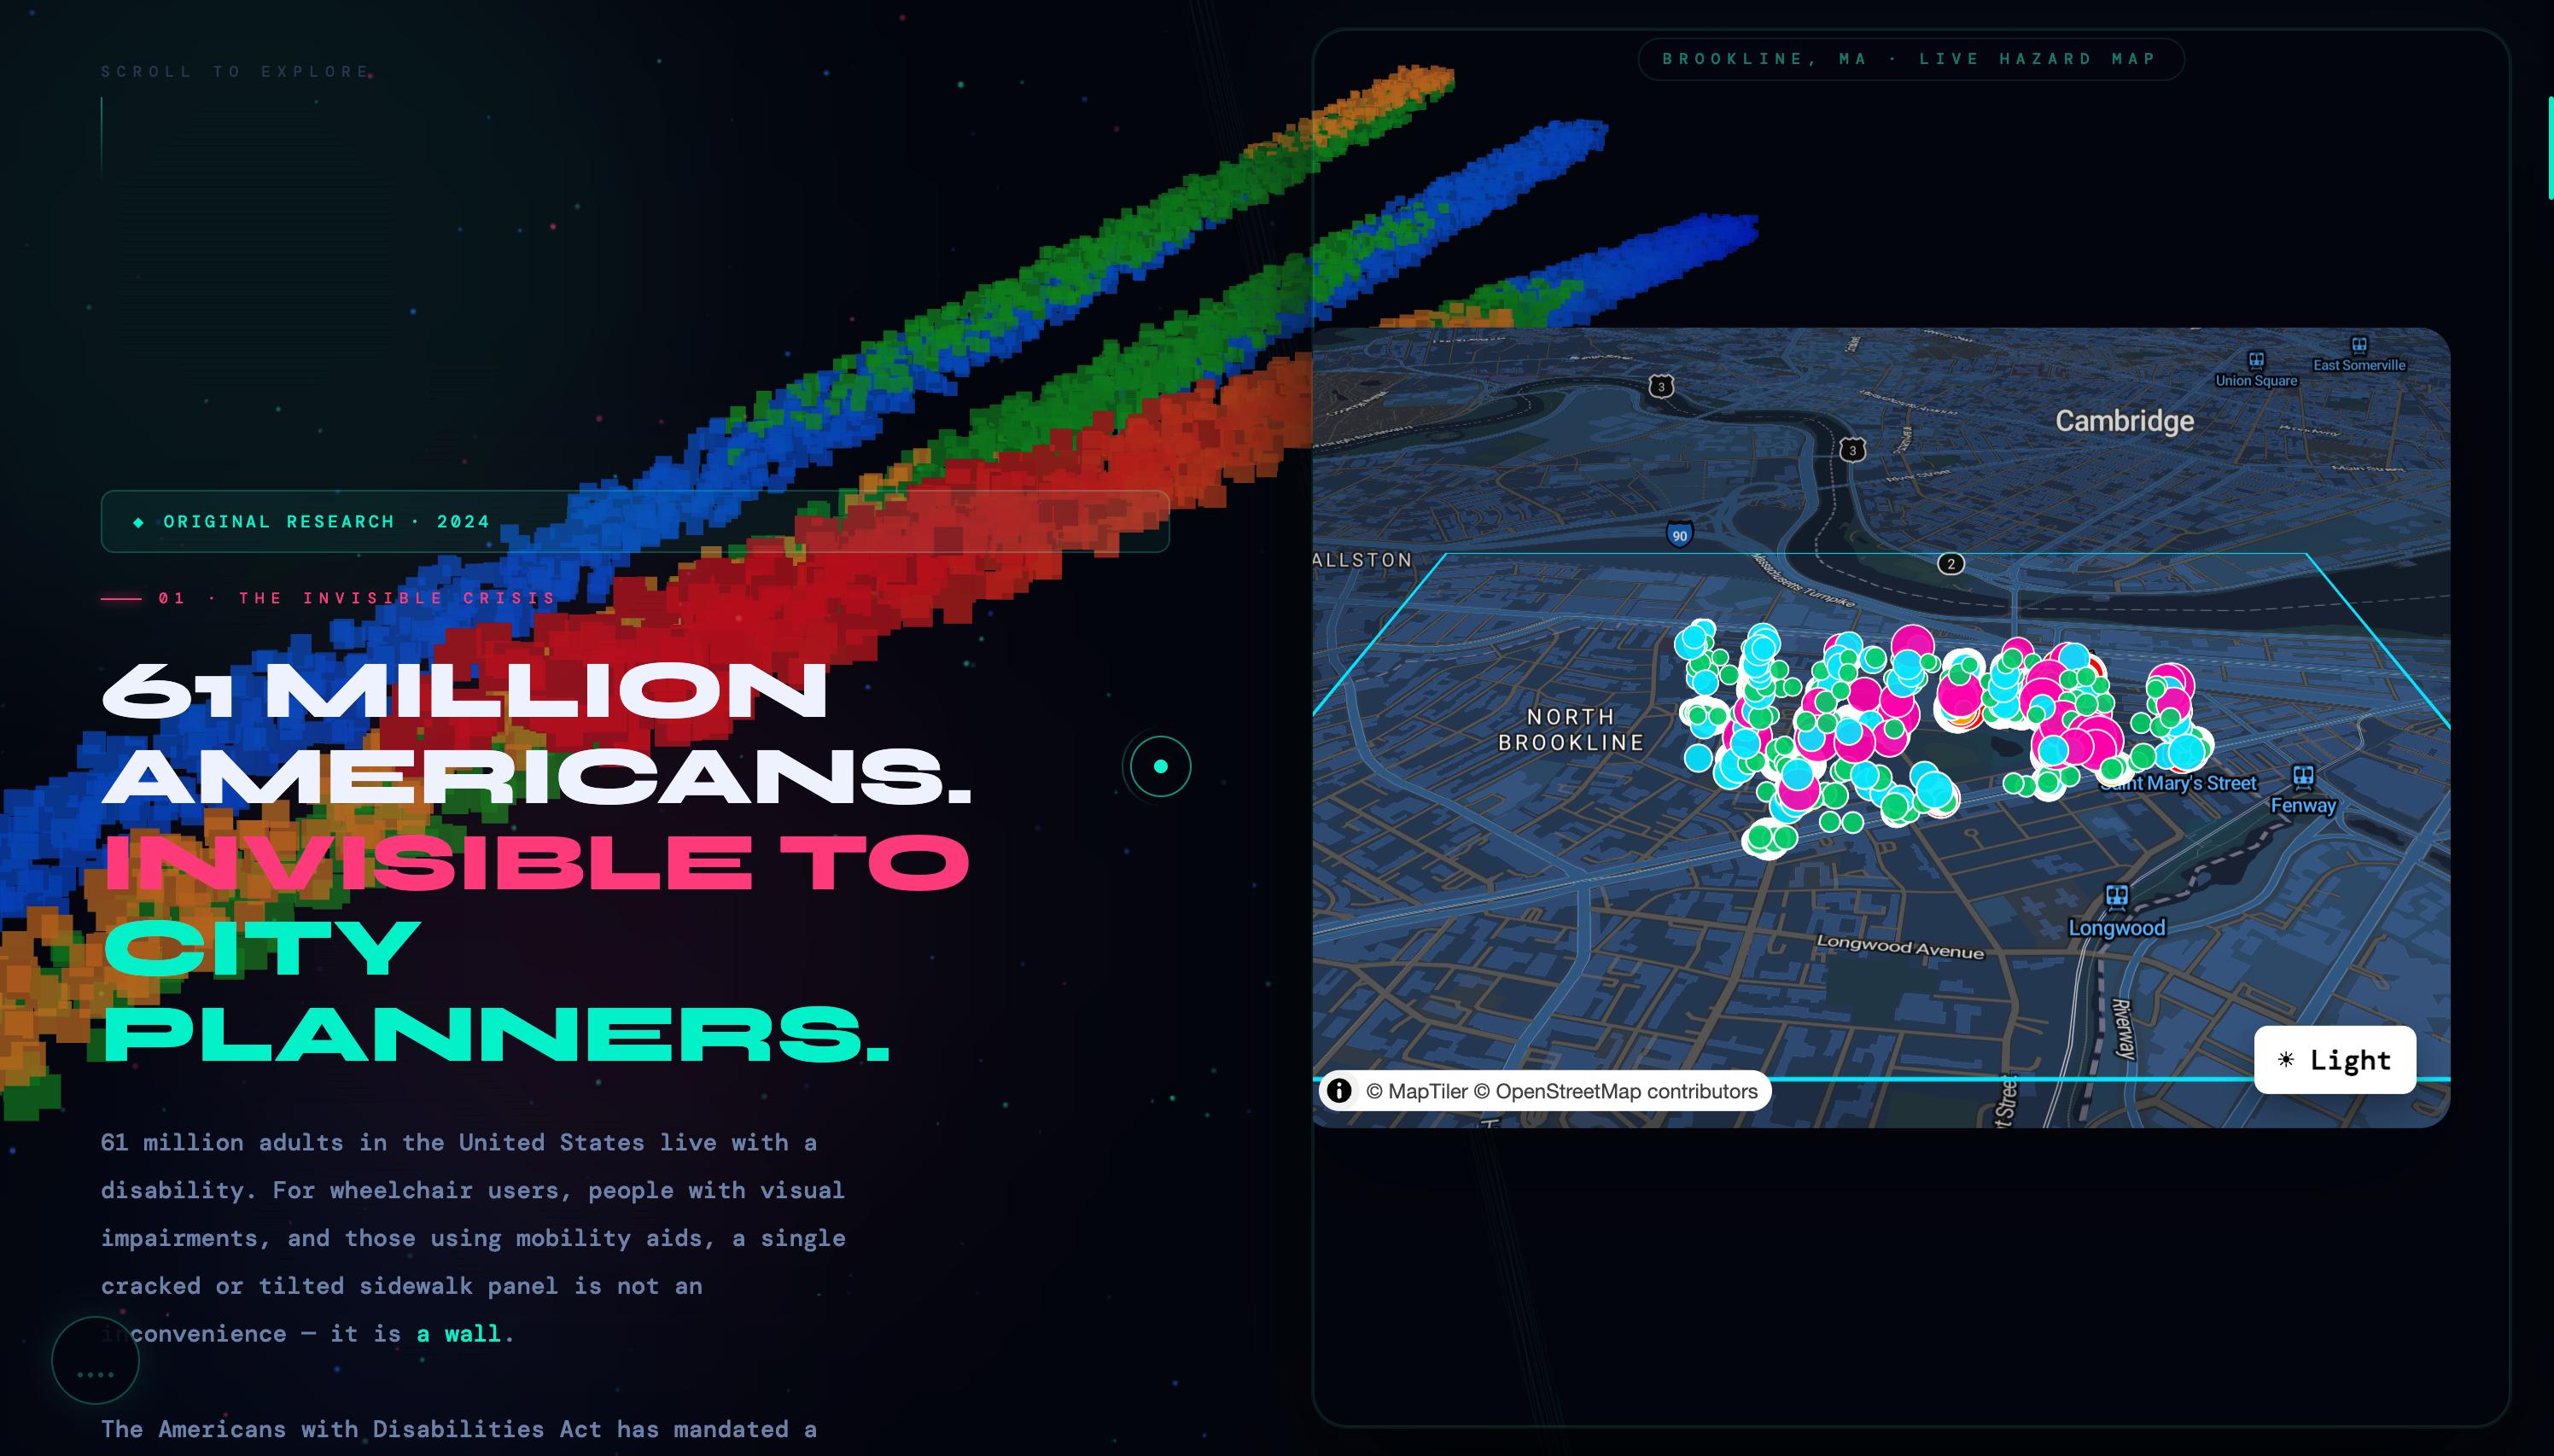
61 million Americans live with a disability. For wheelchair users, people with visual impairments, elderly residents, and unhoused individuals who depend on sidewalks as their primary infrastructure — a single cracked or tilted pavement panel is not an inconvenience. It is a barrier.
The Americans with Disabilities Act has mandated a maximum sidewalk cross-slope of 2% since 1990. Over three decades later, compliance is almost never measured at scale. Cities rely on manual inspection reports, 311 calls, and occasional visual surveys. The math has simply never been done systematically.
P.A.P.I changes that.
By applying least-squares plane-fitting to mobile LiDAR point cloud data, we automatically compute ADA cross-slope compliance and vertical step detection across an entire city district — with sub-millimeter accuracy, at a fraction of the cost of manual inspection.
Results — Brookline, MA
| Metric | Value |
|---|---|
| Sidewalk candidates analyzed | 250 |
| Total hazards detected | 32,467 |
| Corridor spatial precision | 2 meters |
| Minimum step detection threshold | 6 mm |
| Maximum cross-slope detected | 22.24% (ADA limit: 2%) |
| Max slope violation multiplier | 11× the legal maximum |
Table of Contents
- Architecture Overview
- Repository Structure
- The Data Pipeline
- The Mathematics
- Data Sources
- Web Application
- Getting Started
- ADA Compliance Reference
- Ethics & Impact
- Tech Stack
- Contributing
Architecture Overview
┌─────────────────────────────────────────────────────────────────┐
│                        DATA PIPELINE                            │
│                         (Python)                                │
│                                                                 │
│  Raw GeoJSON/LAZ  →  Candidates  →  Buffers  →  Tiles          │
│                                                    ↓            │
│                                              Clip LAZ           │
│                                                    ↓            │
│                                          Plane-fit + Score      │
│                                                    ↓            │
│                                          hazards.geojson        │
└─────────────────────────────────────────────┬───────────────────┘
                                              │
                              ┌───────────────▼───────────────┐
                              │         NODE.JS API           │
                              │    /api/hazards               │
                              │    /api/pointcloud            │
                              │    /api/streetview            │
                              └───────────────┬───────────────┘
                                              │
                              ┌───────────────▼───────────────┐
                              │      REACT + VITE FRONTEND    │
                              │   MapLibre GL map             │
                              │   32,467 hazard markers       │
                              │   Sidebar + filters           │
                              │   📷 Street image viewer      │
                              │   Potree 3D point cloud       │
                              └───────────────────────────────┘
Repository Structure
BU_SPARK/
├── analysis/                      # Python data pipeline
│   ├── extract_sidewalks.py       # Step 1: Filter sidewalk candidates
│   ├── make_candidate_buffers.py  # Step 2: 2m spatial buffer corridors
│   ├── match_buffers_to_tiles.py  # Step 3: Spatial join → tile mapping
│   ├── clip_pointcloud.py         # Step 4: LAZ download + ROI clip
│   ├── detect_hazards.py          # Step 5: Plane-fit + ADA scoring
│   ├── download_brookline.py      # Utility: fetch raw Cyvl datasets
│   └── requirements.txt
│
├── apps/
│   ├── api/                       # Node.js Express backend
│   │   ├── src/
│   │   ├── package.json
│   │   └── .env
│   │
│   └── web/                       # Vite + React + TypeScript frontend
│       ├── public/
│       │   ├── brookline_boundary.geojson
│       │   └── streetviewImages.geojson
│       ├── src/
│       │   ├── App.tsx
│       │   ├── Map.tsx            # MapLibre GL map component
│       │   ├── main.tsx
│       │   └── index.css
│       ├── index.html             # P.A.P.I animated explainer page
│       ├── package.json
│       └── vite.config.ts
│
└── data/
    └── brookline/
        ├── raw/
        │   ├── aboveGroundAssets.geojson
        │   ├── pointcloud_coverage.json
        │   └── streetviewImages.geojson
        ├── processed/
        │   ├── candidates.geojson
        │   ├── candidates_buffer.geojson
        │   ├── candidate_tiles.json
        │   └── tile_index.geojson
        ├── roi/
        │   └── roi_points_CAND_*.npz
        └── pointcloud_tiles/      # Cached .laz files (gitignored)
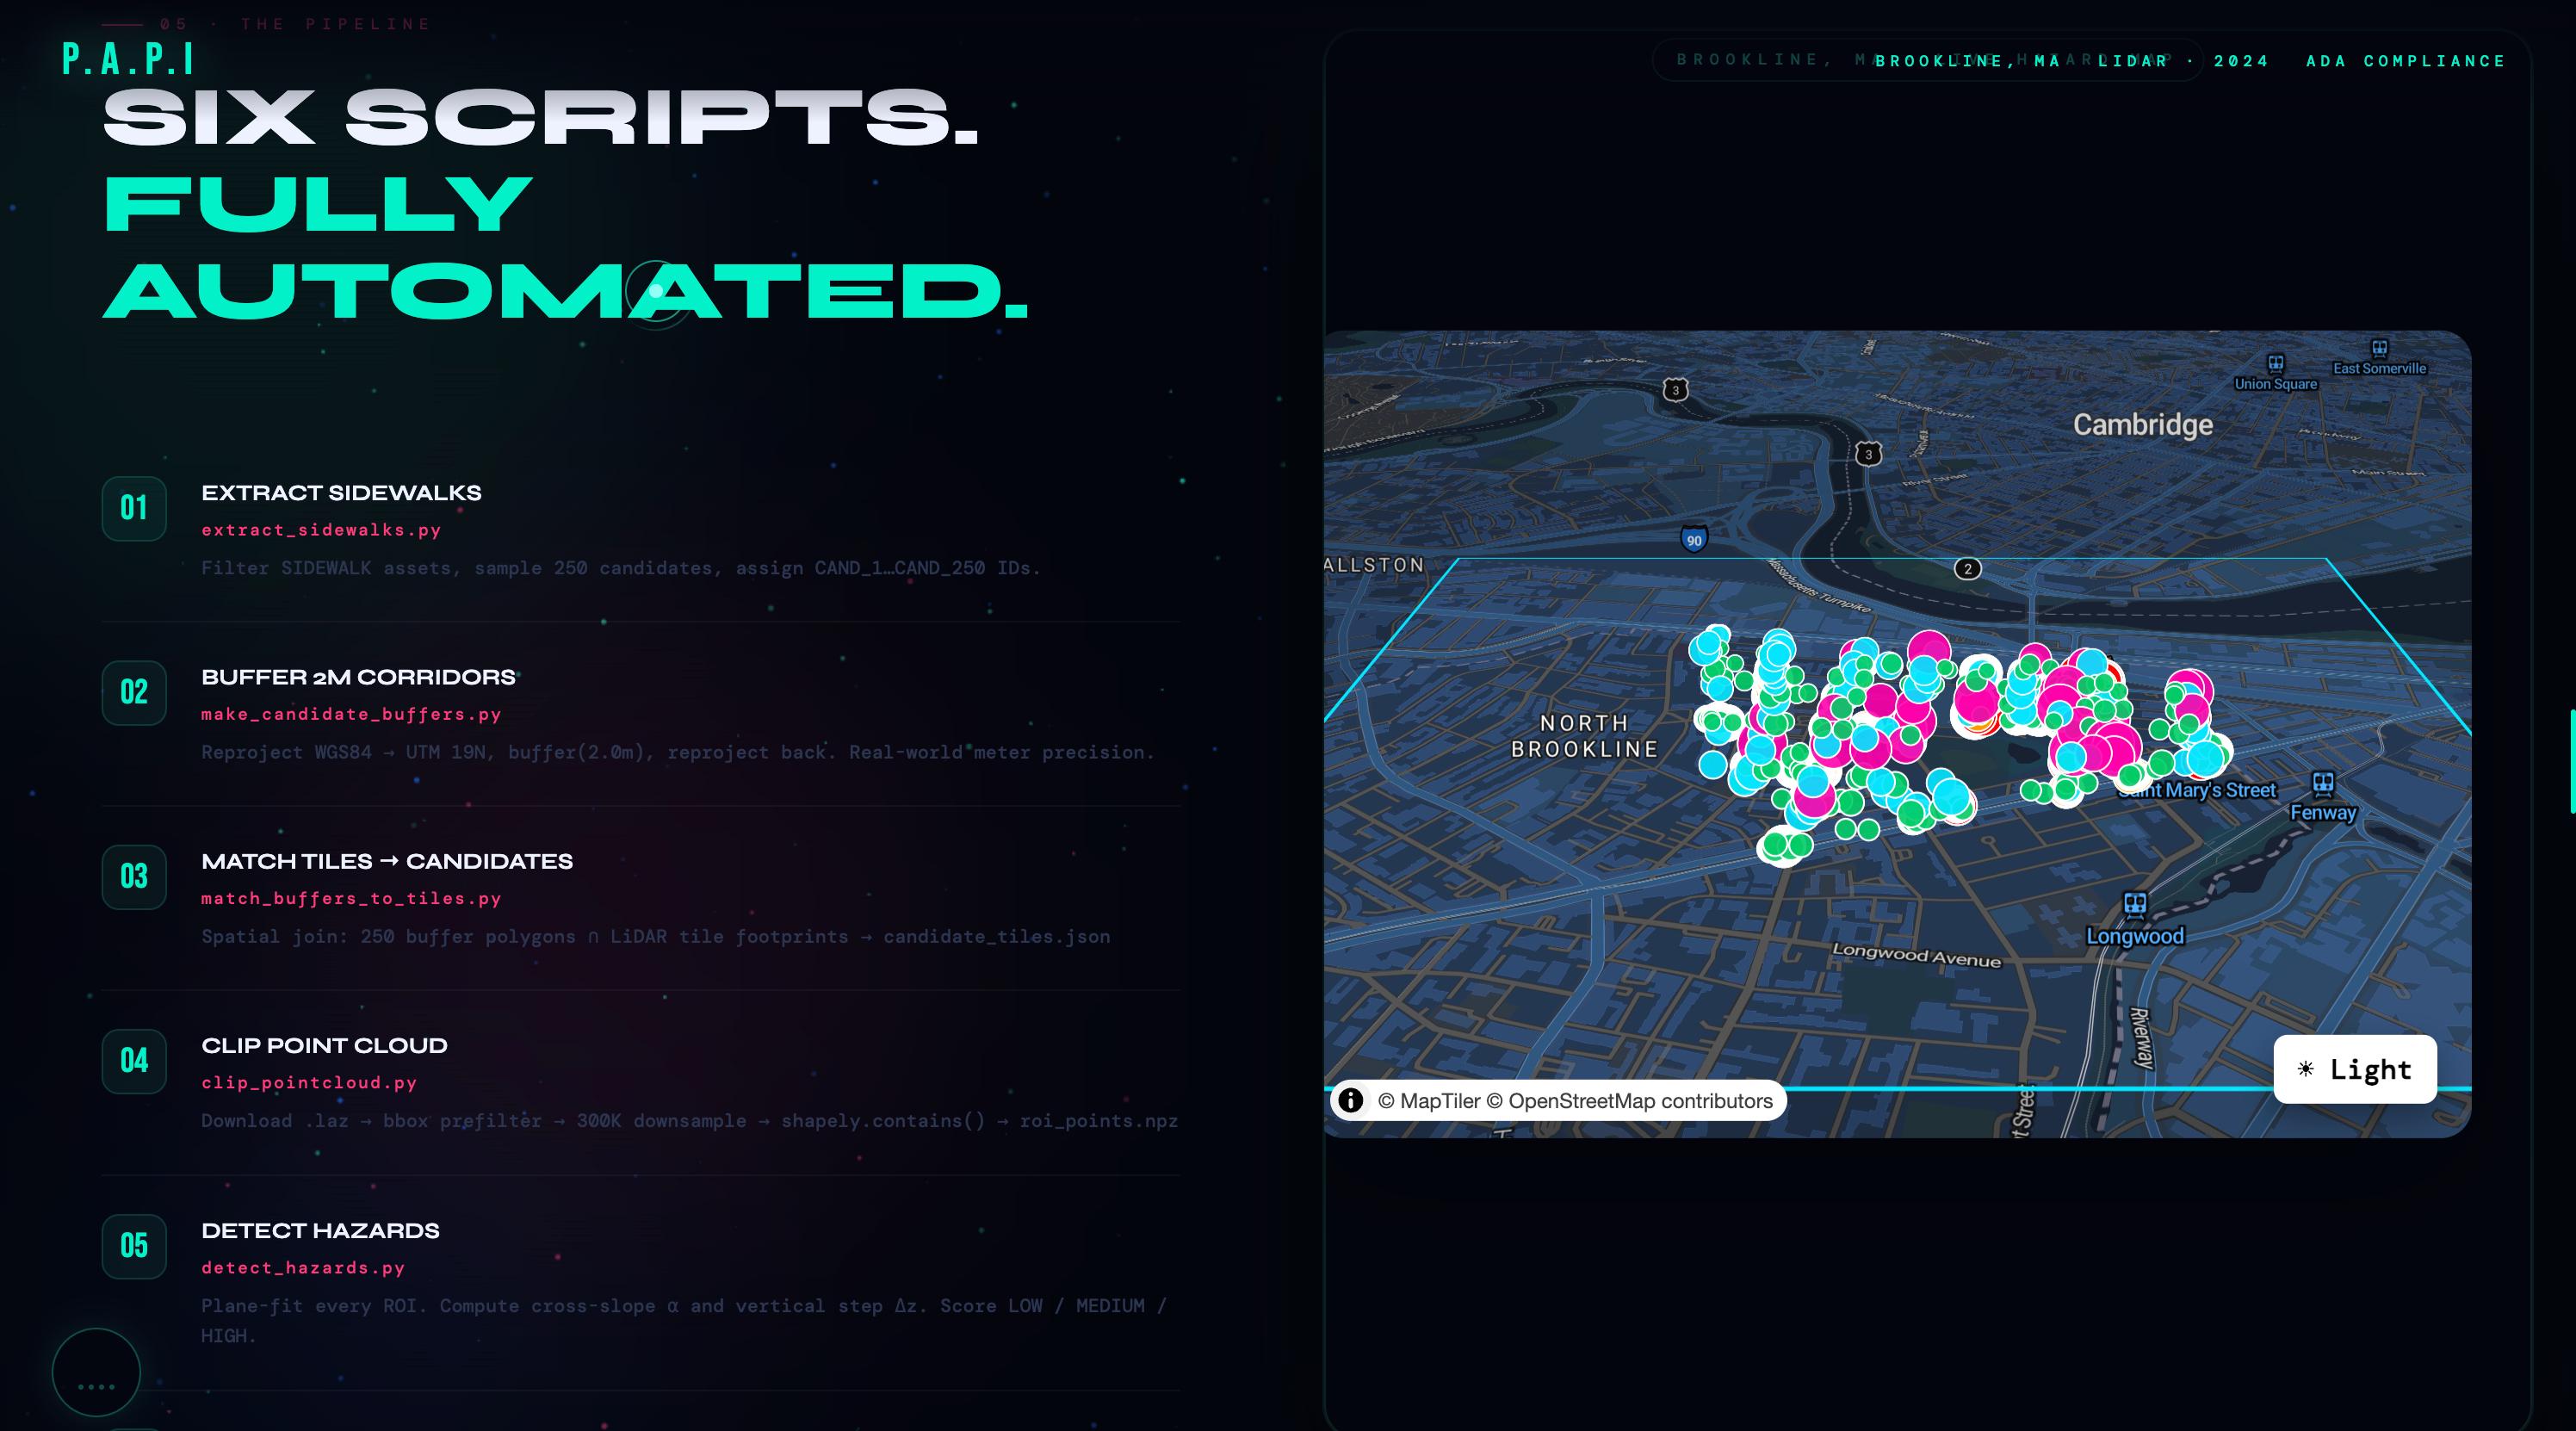
The Data Pipeline
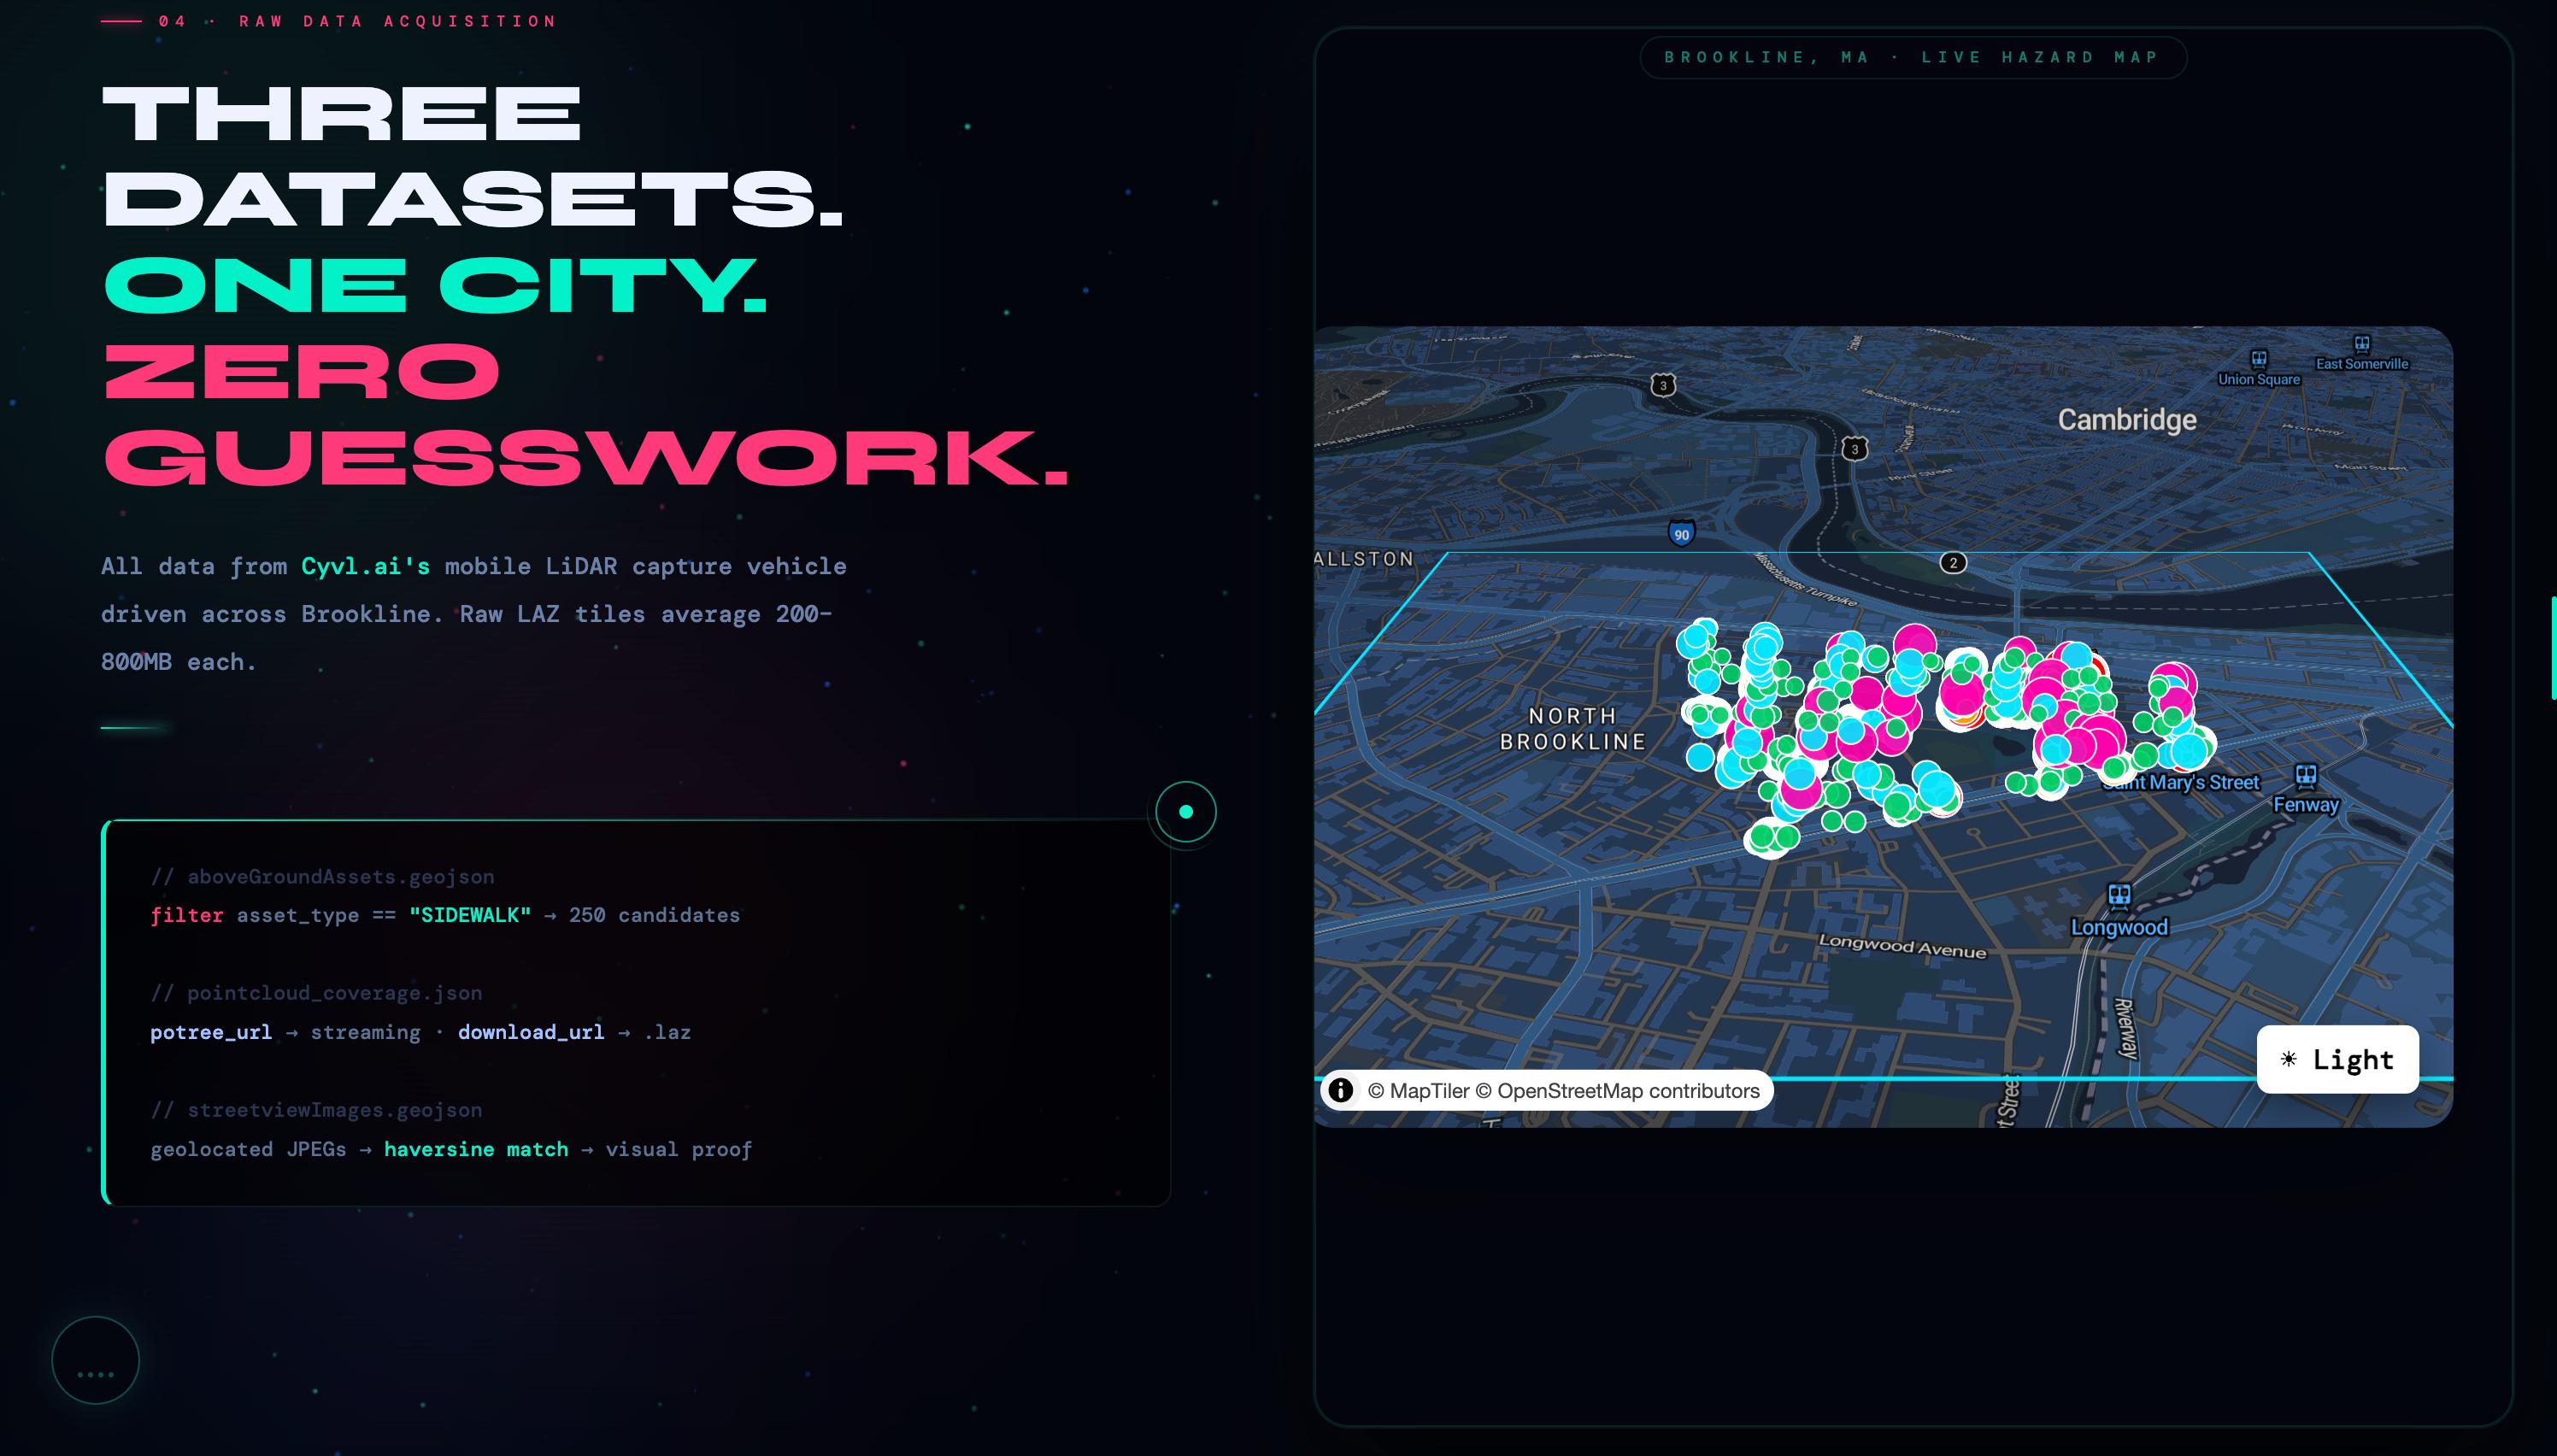
Step 1 — Extract Sidewalk Candidates
Script: analysis/extract_sidewalks.py
Loads aboveGroundAssets.geojson — a city-provided GeoJSON of every mapped above-ground asset in Brookline — and filters to only asset_type == "SIDEWALK". Sidewalks are flagged by condition (Poor or Fair) and a sample of 250 candidates is drawn for analysis. Each candidate receives a unique ID (CAND_1 through CAND_250).
Output: data/brookline/processed/candidates.geojson
sidewalks = gdf[gdf["asset_type"] == "SIDEWALK"].copy()
sidewalks["risk_flag"] = sidewalks["condition"].isin(["Poor", "Fair"])
candidates = sidewalks.sample(n=250, random_state=42).copy()
candidates["candidate_id"] = [f"CAND_{i+1}" for i in range(len(candidates))]
Step 2 — Spatial Buffering
Script: analysis/make_candidate_buffers.py
Sidewalk candidates are line geometries in WGS84 (EPSG:4326). To buffer by real-world meters, we must first reproject to a metric coordinate system:
- Reproject lines from EPSG:4326 (lon/lat degrees) → EPSG:32619 (UTM Zone 19N, meters)
- Apply
shapely.buffer(2.0)— a 2-meter corridor around each line - Reproject back to EPSG:4326 for web compatibility
Why 2 meters? The ADA-defined walkway width is typically 1.2–1.8m. A 2m buffer captures all relevant LiDAR returns for the sidewalk surface without pulling in adjacent road or lawn data.
Output: data/brookline/processed/candidates_buffer.geojson
candidates = candidates.set_crs("EPSG:4326").to_crs("EPSG:32619")
buffers["geometry"] = buffers.geometry.buffer(2.0)
buffers = buffers.to_crs("EPSG:4326")
Step 3 — Tile Matching
Script: analysis/match_buffers_to_tiles.py
Performs a spatial join between the 250 buffer polygons and the LiDAR tile footprints in pointcloud_coverage.json using geopandas.sjoin(predicate="intersects"). This produces a mapping of which LAZ tiles overlap each candidate corridor — some candidates span multiple tiles.
Each tile entry contains:
filename— the tile's LAZ filenamedownload_url— direct URL to the raw.lazfilepotree_url— URL to the pre-converted Potree-streamable version
Output: data/brookline/processed/candidate_tiles.json
[
  {
    "candidate_id": "CAND_1",
    "tiles": [
      {
        "filename": "tile_001.laz",
        "download_url": "https://cdn.cyvl.ai/.../tile_001.laz",
        "potree_url": "https://cdn.cyvl.ai/.../tile_001.laz.potree"
      }
    ]
  }
]
Step 4 — Point Cloud Clipping
Script: analysis/clip_pointcloud.py
The most computationally intensive step. For each candidate:
- Download the relevant
.laztile(s) from Cyvl's CDN (cached locally to avoid re-downloading) - Read the LAZ file using
laspy, extractingx,y,zarrays in UTM meters - Pass 1 — Bounding box filter (fast): eliminate ~95% of points outside the candidate's rectangular bounds
- Downsample to max 300,000 points per tile using random sampling
- Pass 2 — Precise polygon containment (vectorized):
shapely.contains()against all surviving points - Save clipped arrays as compressed
.npz:roi_points_CAND_X.npz
Optional fields preserved if present: intensity, red, green, blue
Output: data/brookline/roi/roi_points_CAND_*.npz
# Pass 1 — bounding box
bbox_mask = (x >= minx) & (x <= maxx) & (y >= miny) & (y <= maxy)
idx = np.nonzero(bbox_mask)[0]

# Optional downsample
if idx.size > max_points:
    idx = rng.choice(idx, size=max_points, replace=False)

# Pass 2 — vectorized polygon containment
pts = points(x[idx], y[idx])
inside = contains(roi_poly, pts)
idx2 = idx[inside]
CLI usage:
python analysis/clip_pointcloud.py \
  --candidate-id CAND_1 \
  --max-tiles 2 \
  --max-points 300000 \
  --max-download-gb 5.0
| Flag | Default | Description |
|---|---|---|
--candidate-id |
required | Which candidate to process |
--max-tiles |
1 | Max tiles to download per candidate |
--max-points |
300,000 | Cap on points per tile (for speed) |
--max-download-gb |
5.0 | Cache budget before skipping downloads |
--no-download |
false | Use cached tiles only |
Step 5 — Hazard Detection
Script: analysis/detect_hazards.py
Loads each roi_points_CAND_*.npz file and runs the mathematical hazard detection pipeline. See The Mathematics section for full derivations.
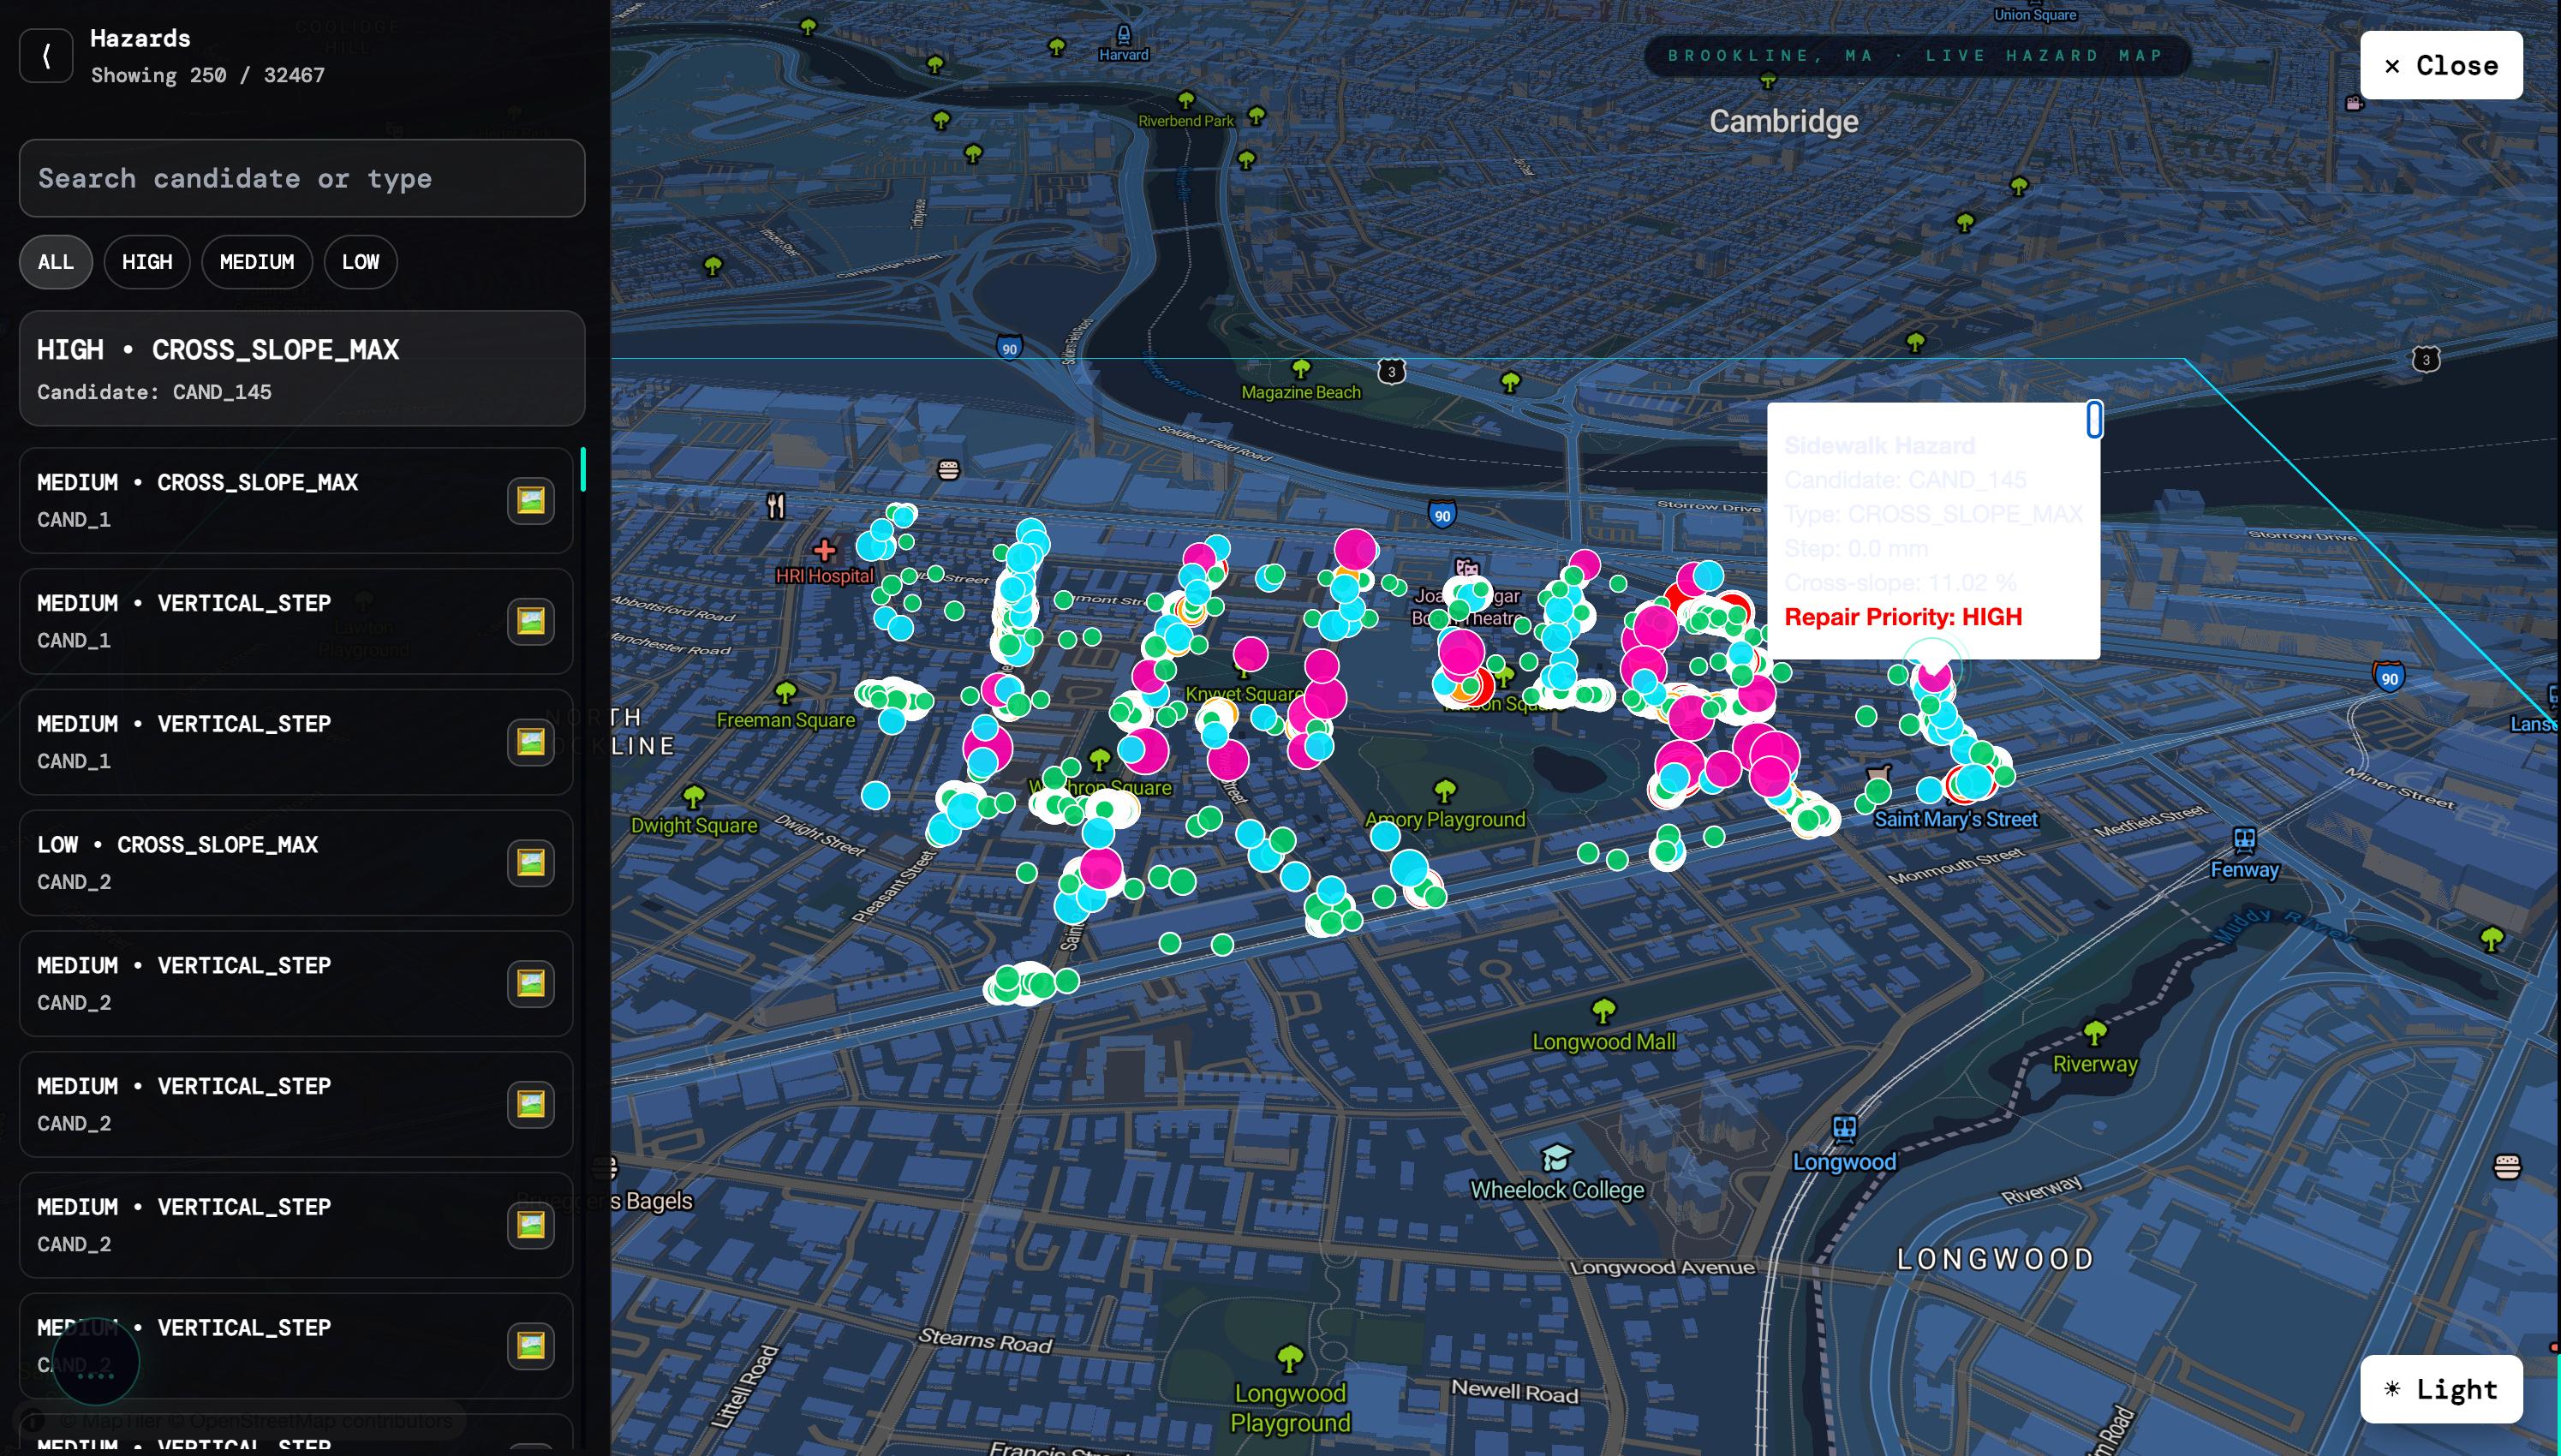
Output: data/brookline/processed/hazards.geojson — 32,467 records, each with:
{
  "candidate_id": "CAND_44",
  "type": "CROSS_SLOPE_MAX",
  "severity": "HIGH",
  "cross_slope_pct": 22.24,
  "vertical_step_mm": 0.0,
  "lat": 42.3317,
  "lon": -71.1284
}
The Mathematics
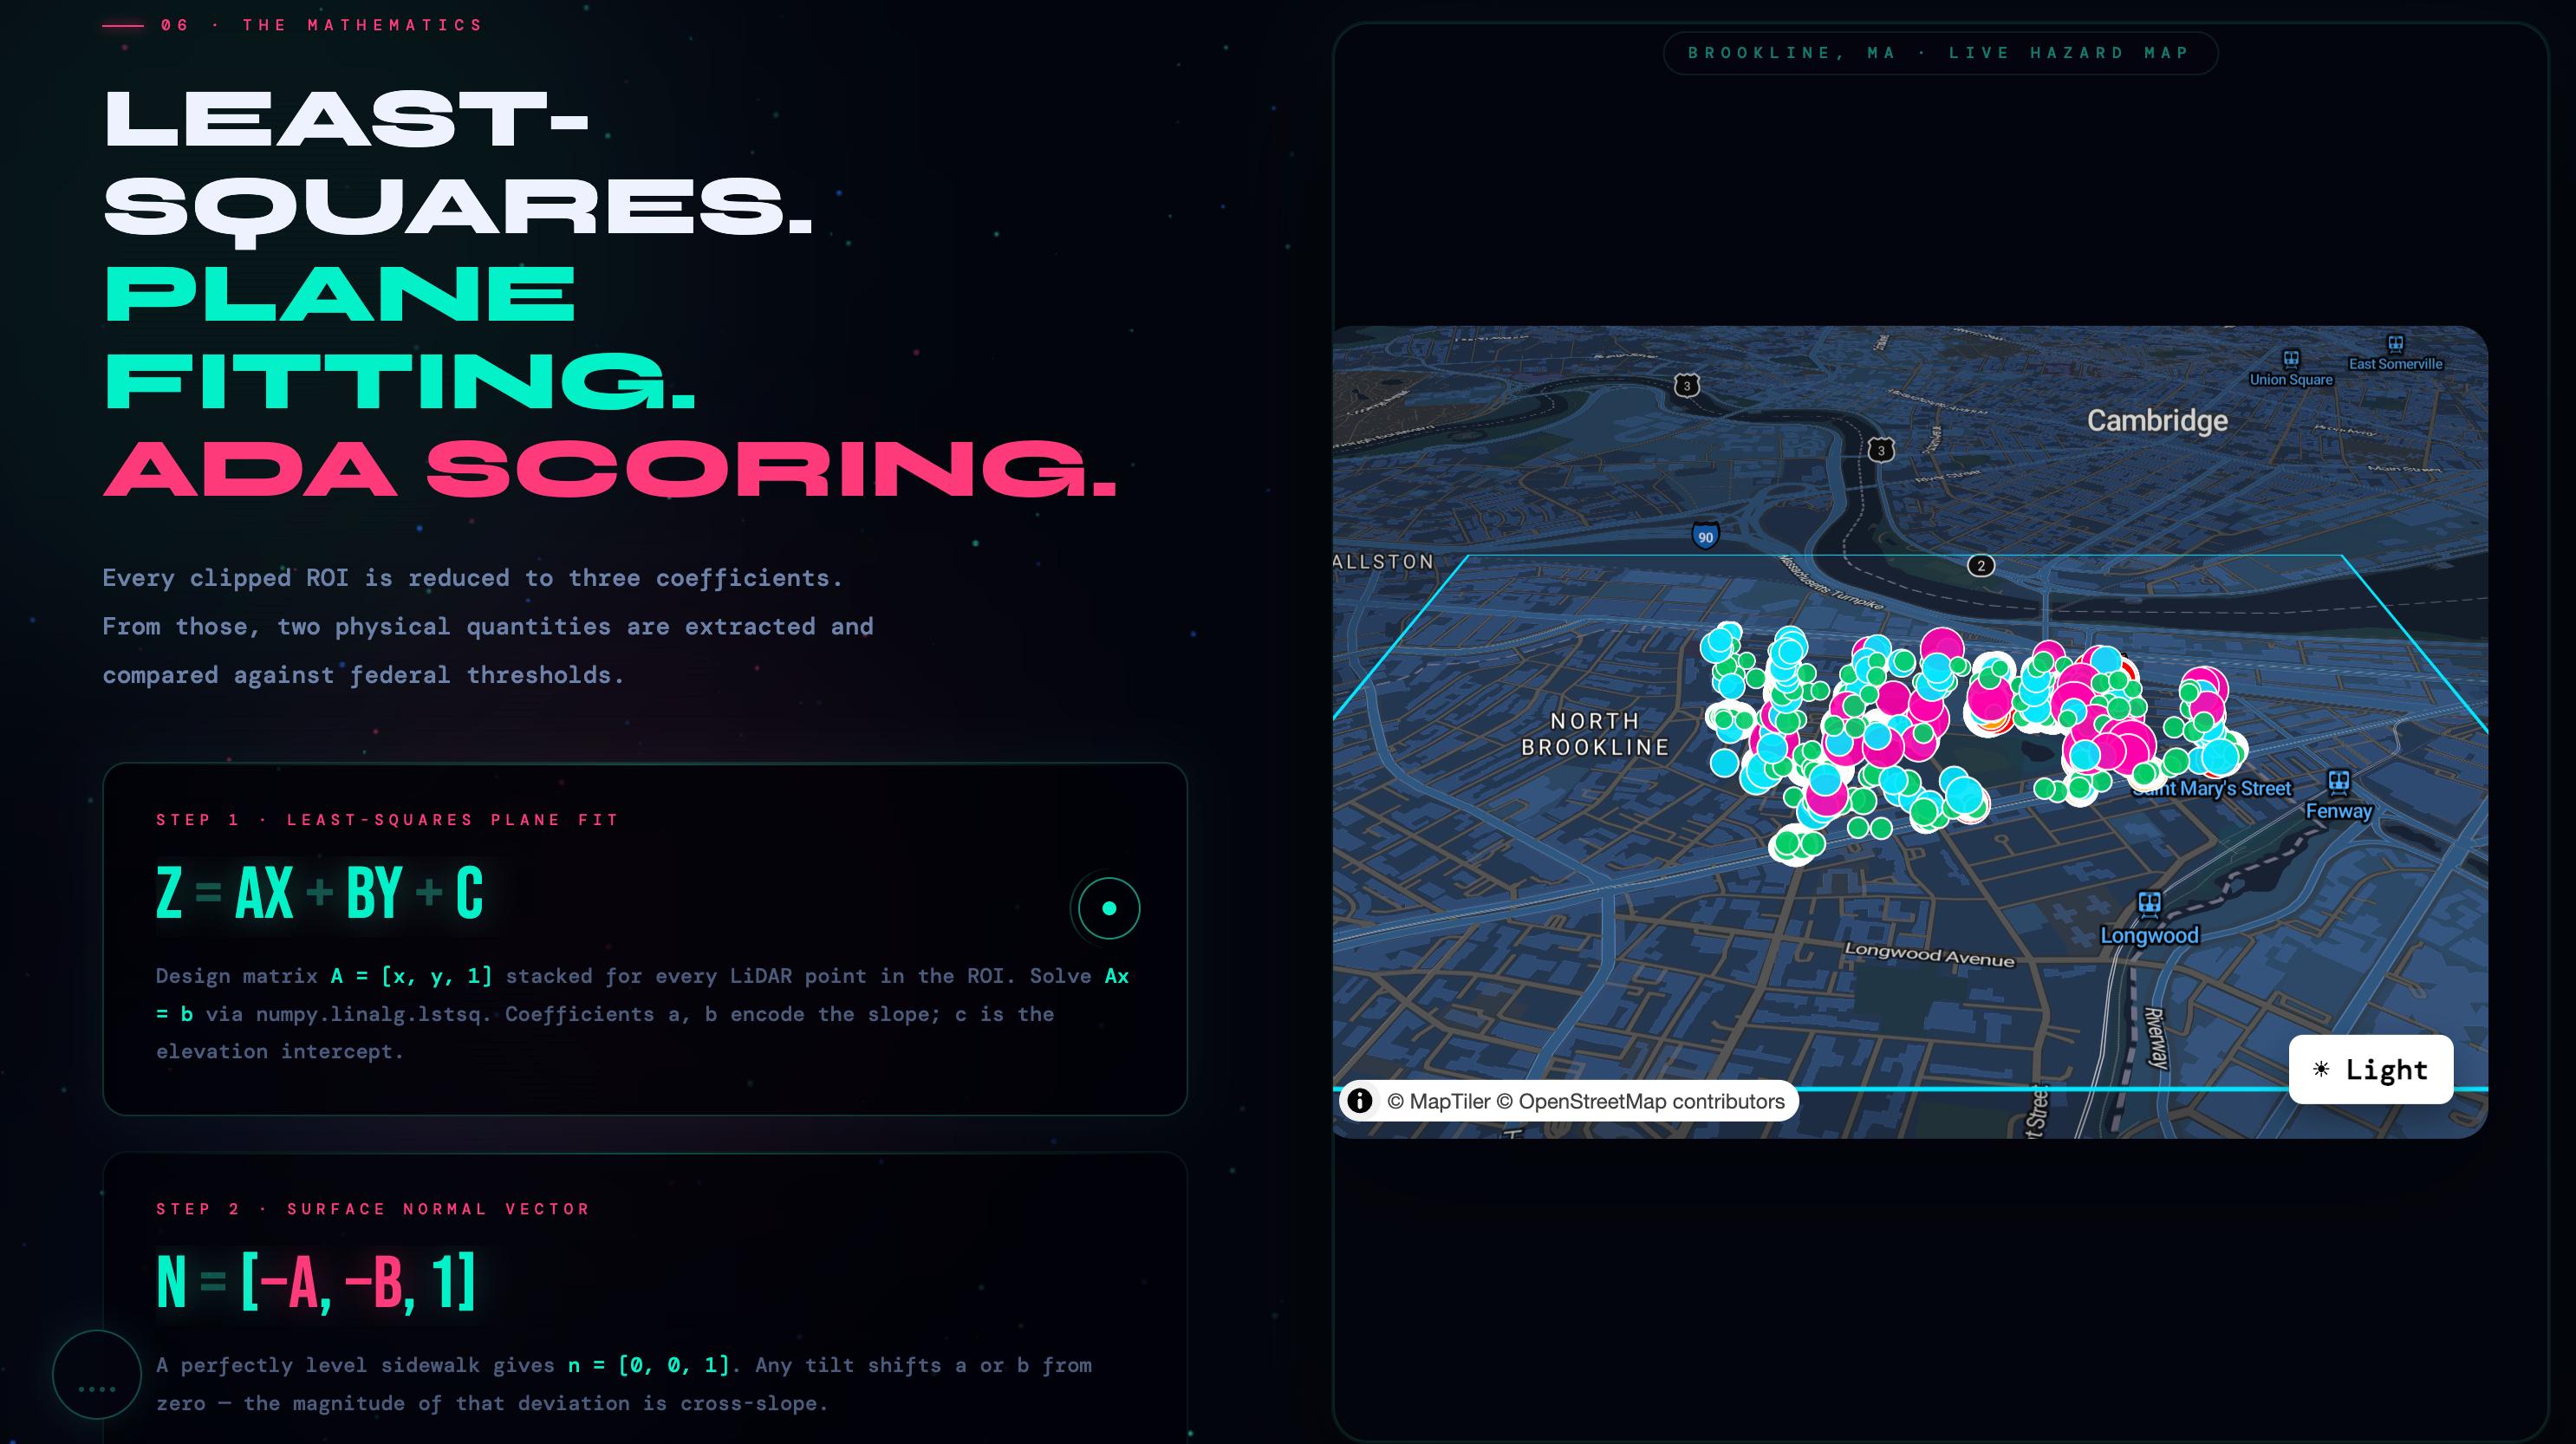
Plane Fitting
For each candidate's clipped point cloud $(x_i, y_i, z_i)$, we fit a plane using ordinary least-squares regression. The model is:
$$z = ax + by + c$$
We construct the design matrix $\mathbf{A}$ and solve:
$$\mathbf{A} = \begin{bmatrix} x_1 & y_1 & 1 \ x_2 & y_2 & 1 \ \vdots & \vdots & \vdots \ x_n & y_n & 1 \end{bmatrix}, \quad \mathbf{b} = \begin{bmatrix} z_1 \ z_2 \ \vdots \ z_n \end{bmatrix}$$
$$[a, b, c] = \arg\min |\mathbf{A}\mathbf{x} - \mathbf{b}|^2$$
Solved via numpy.linalg.lstsq(). The thousands of LiDAR returns per segment make this statistically robust — far more accurate than any manual slope measurement.
A = np.column_stack([x, y, np.ones(len(x))])
result = np.linalg.lstsq(A, z, rcond=None)
a, b, c = result[0]
Cross-Slope Extraction
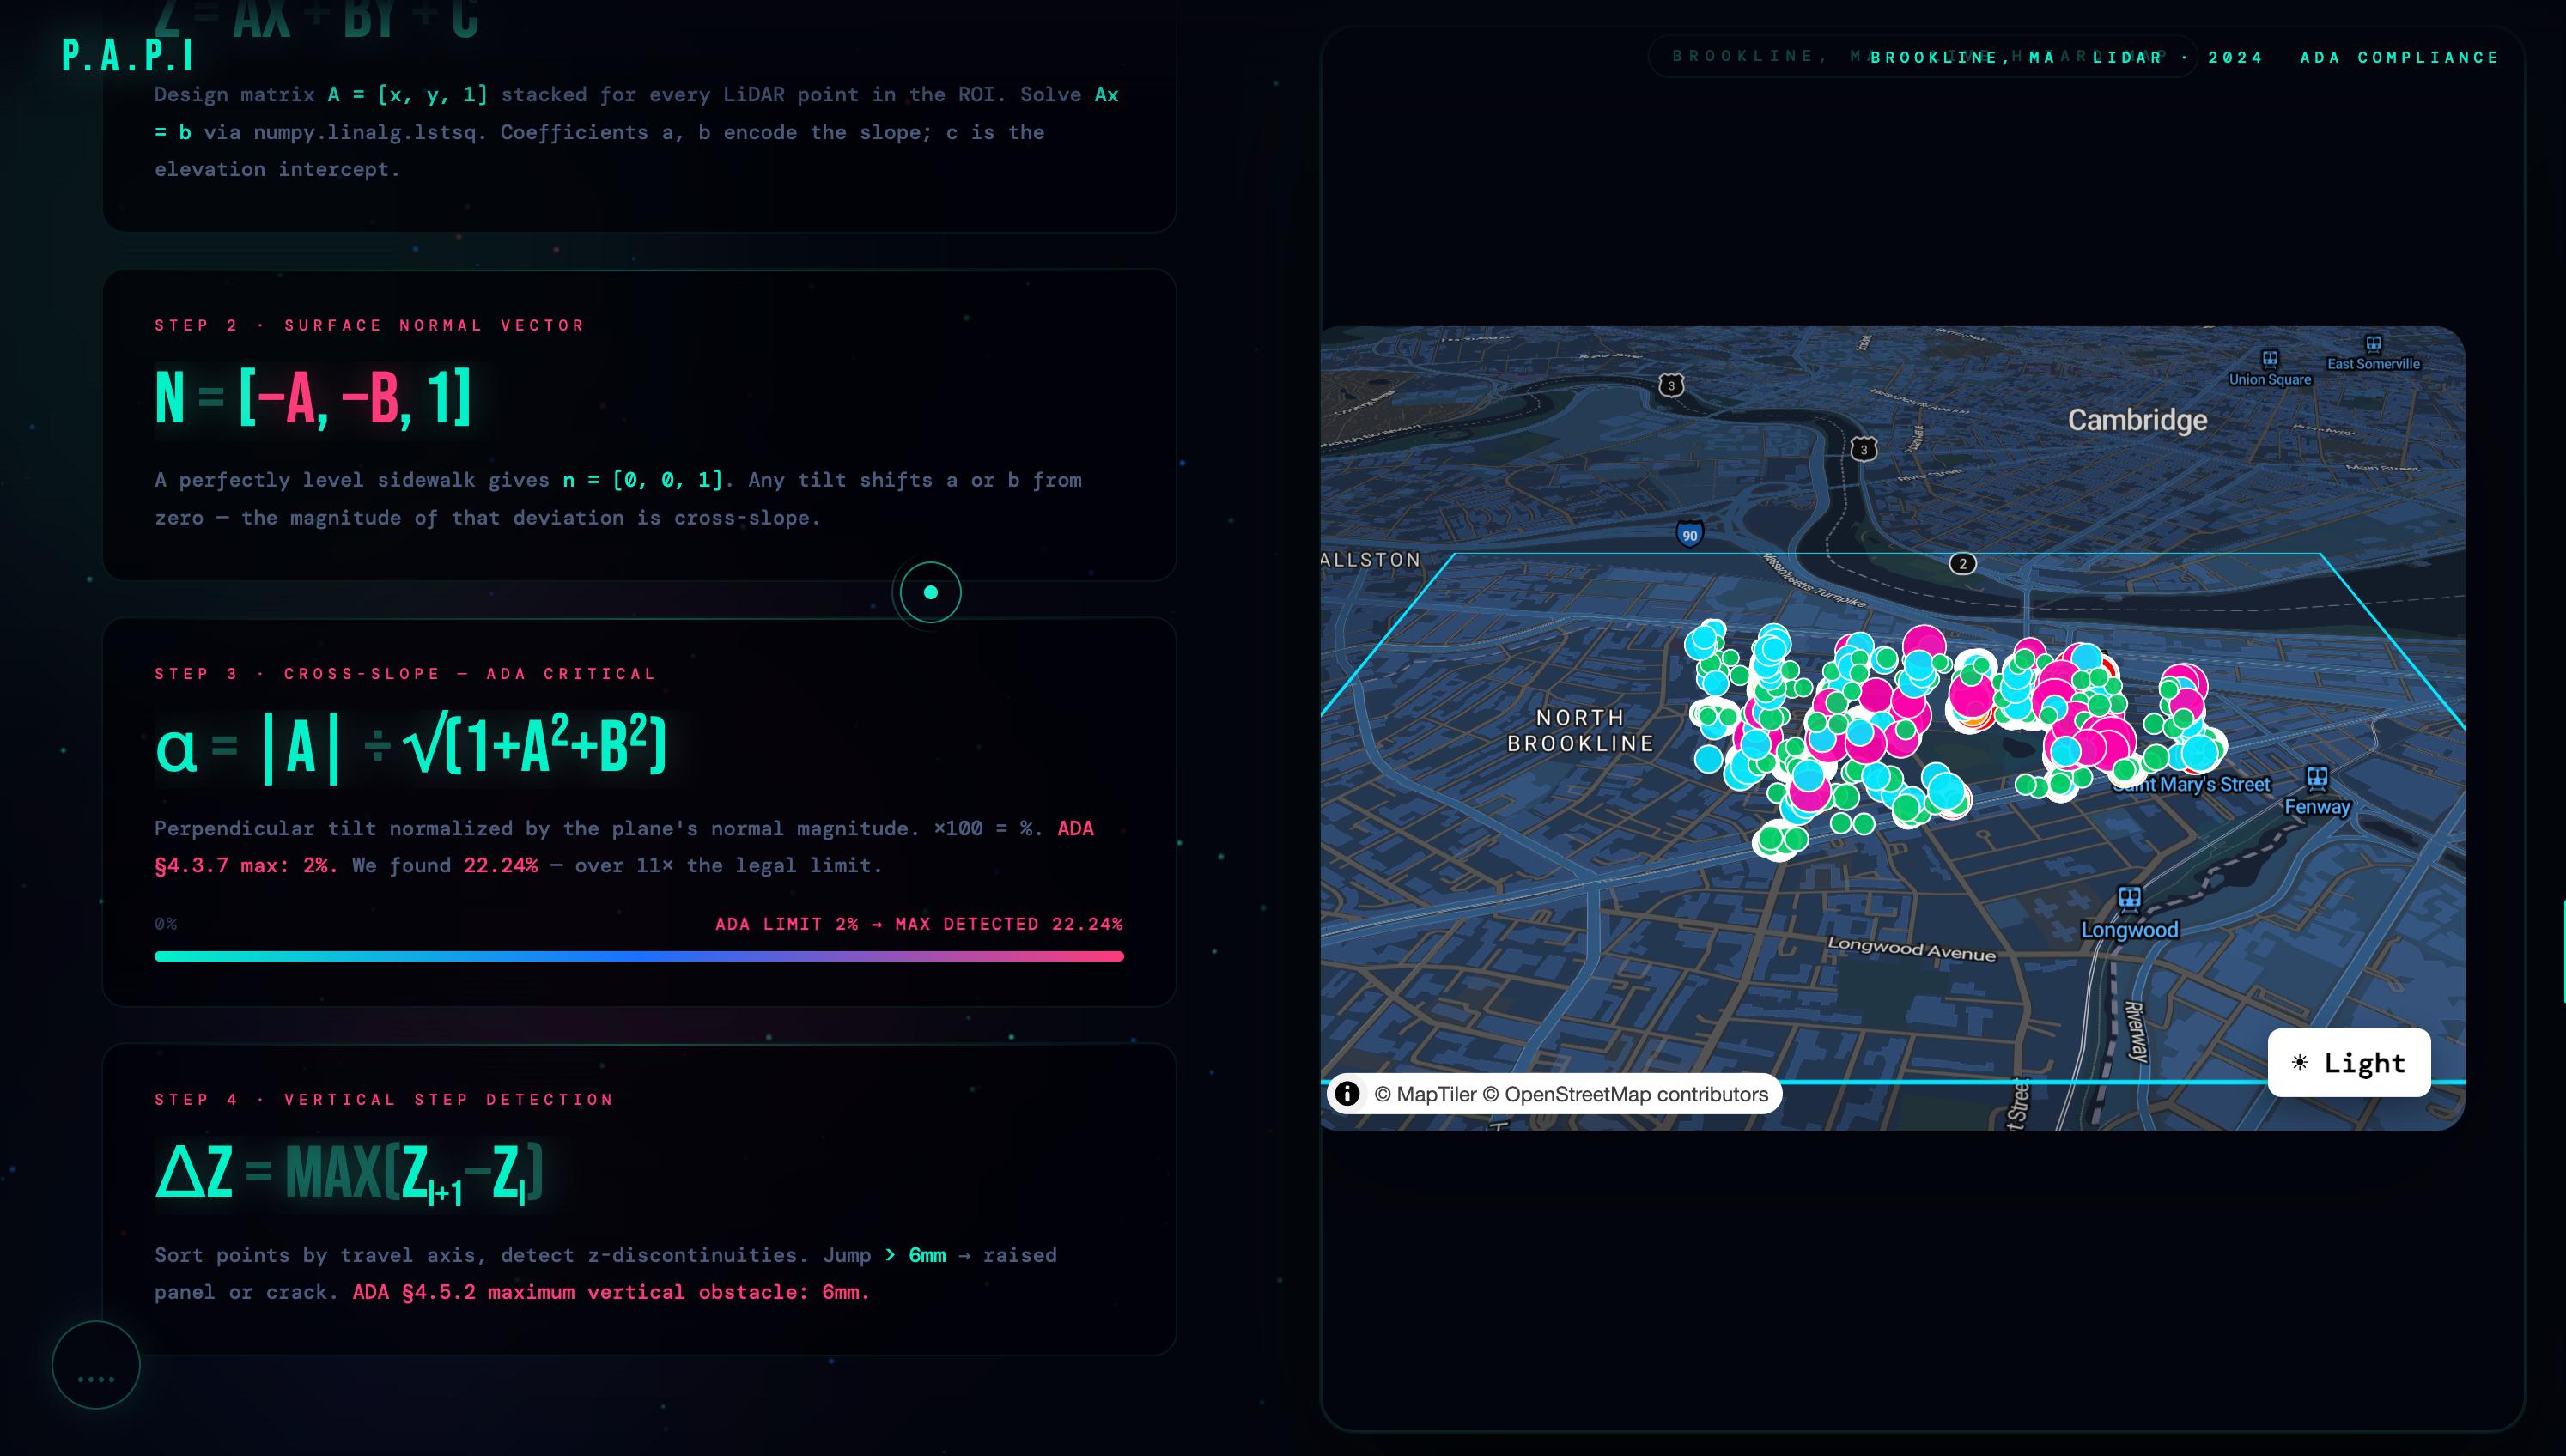
The fitted plane has a normal vector:
$$\mathbf{n} = [-a, -b, 1]$$
A perfectly level sidewalk has $\mathbf{n} = [0, 0, 1]$. Any deviation in $a$ or $b$ represents surface tilt.
Cross-slope (the tilt perpendicular to the direction of travel) is:
$$\alpha = \frac{|a|}{\sqrt{1 + a^2 + b^2}}$$
Multiply by 100 to express as a percentage.
ADA §4.3.7 maximum: 2.0%
We detected a maximum of 22.24% — over 11× the legal limit.
Vertical Step Detection
Points are projected onto the travel direction axis and sorted by position. We then scan for discontinuities in $z$:
$$\Delta z = \max_{i}(z_{i+1} - z_i)$$
A jump greater than 6mm indicates a raised panel edge, crack, or lip — the ADA §4.5.2 threshold for vertical obstacles in pedestrian pathways.
sorted_idx = np.argsort(travel_axis_projection)
z_sorted = z[sorted_idx]
dz = np.diff(z_sorted)
max_step_mm = np.max(np.abs(dz)) * 1000  # convert m → mm
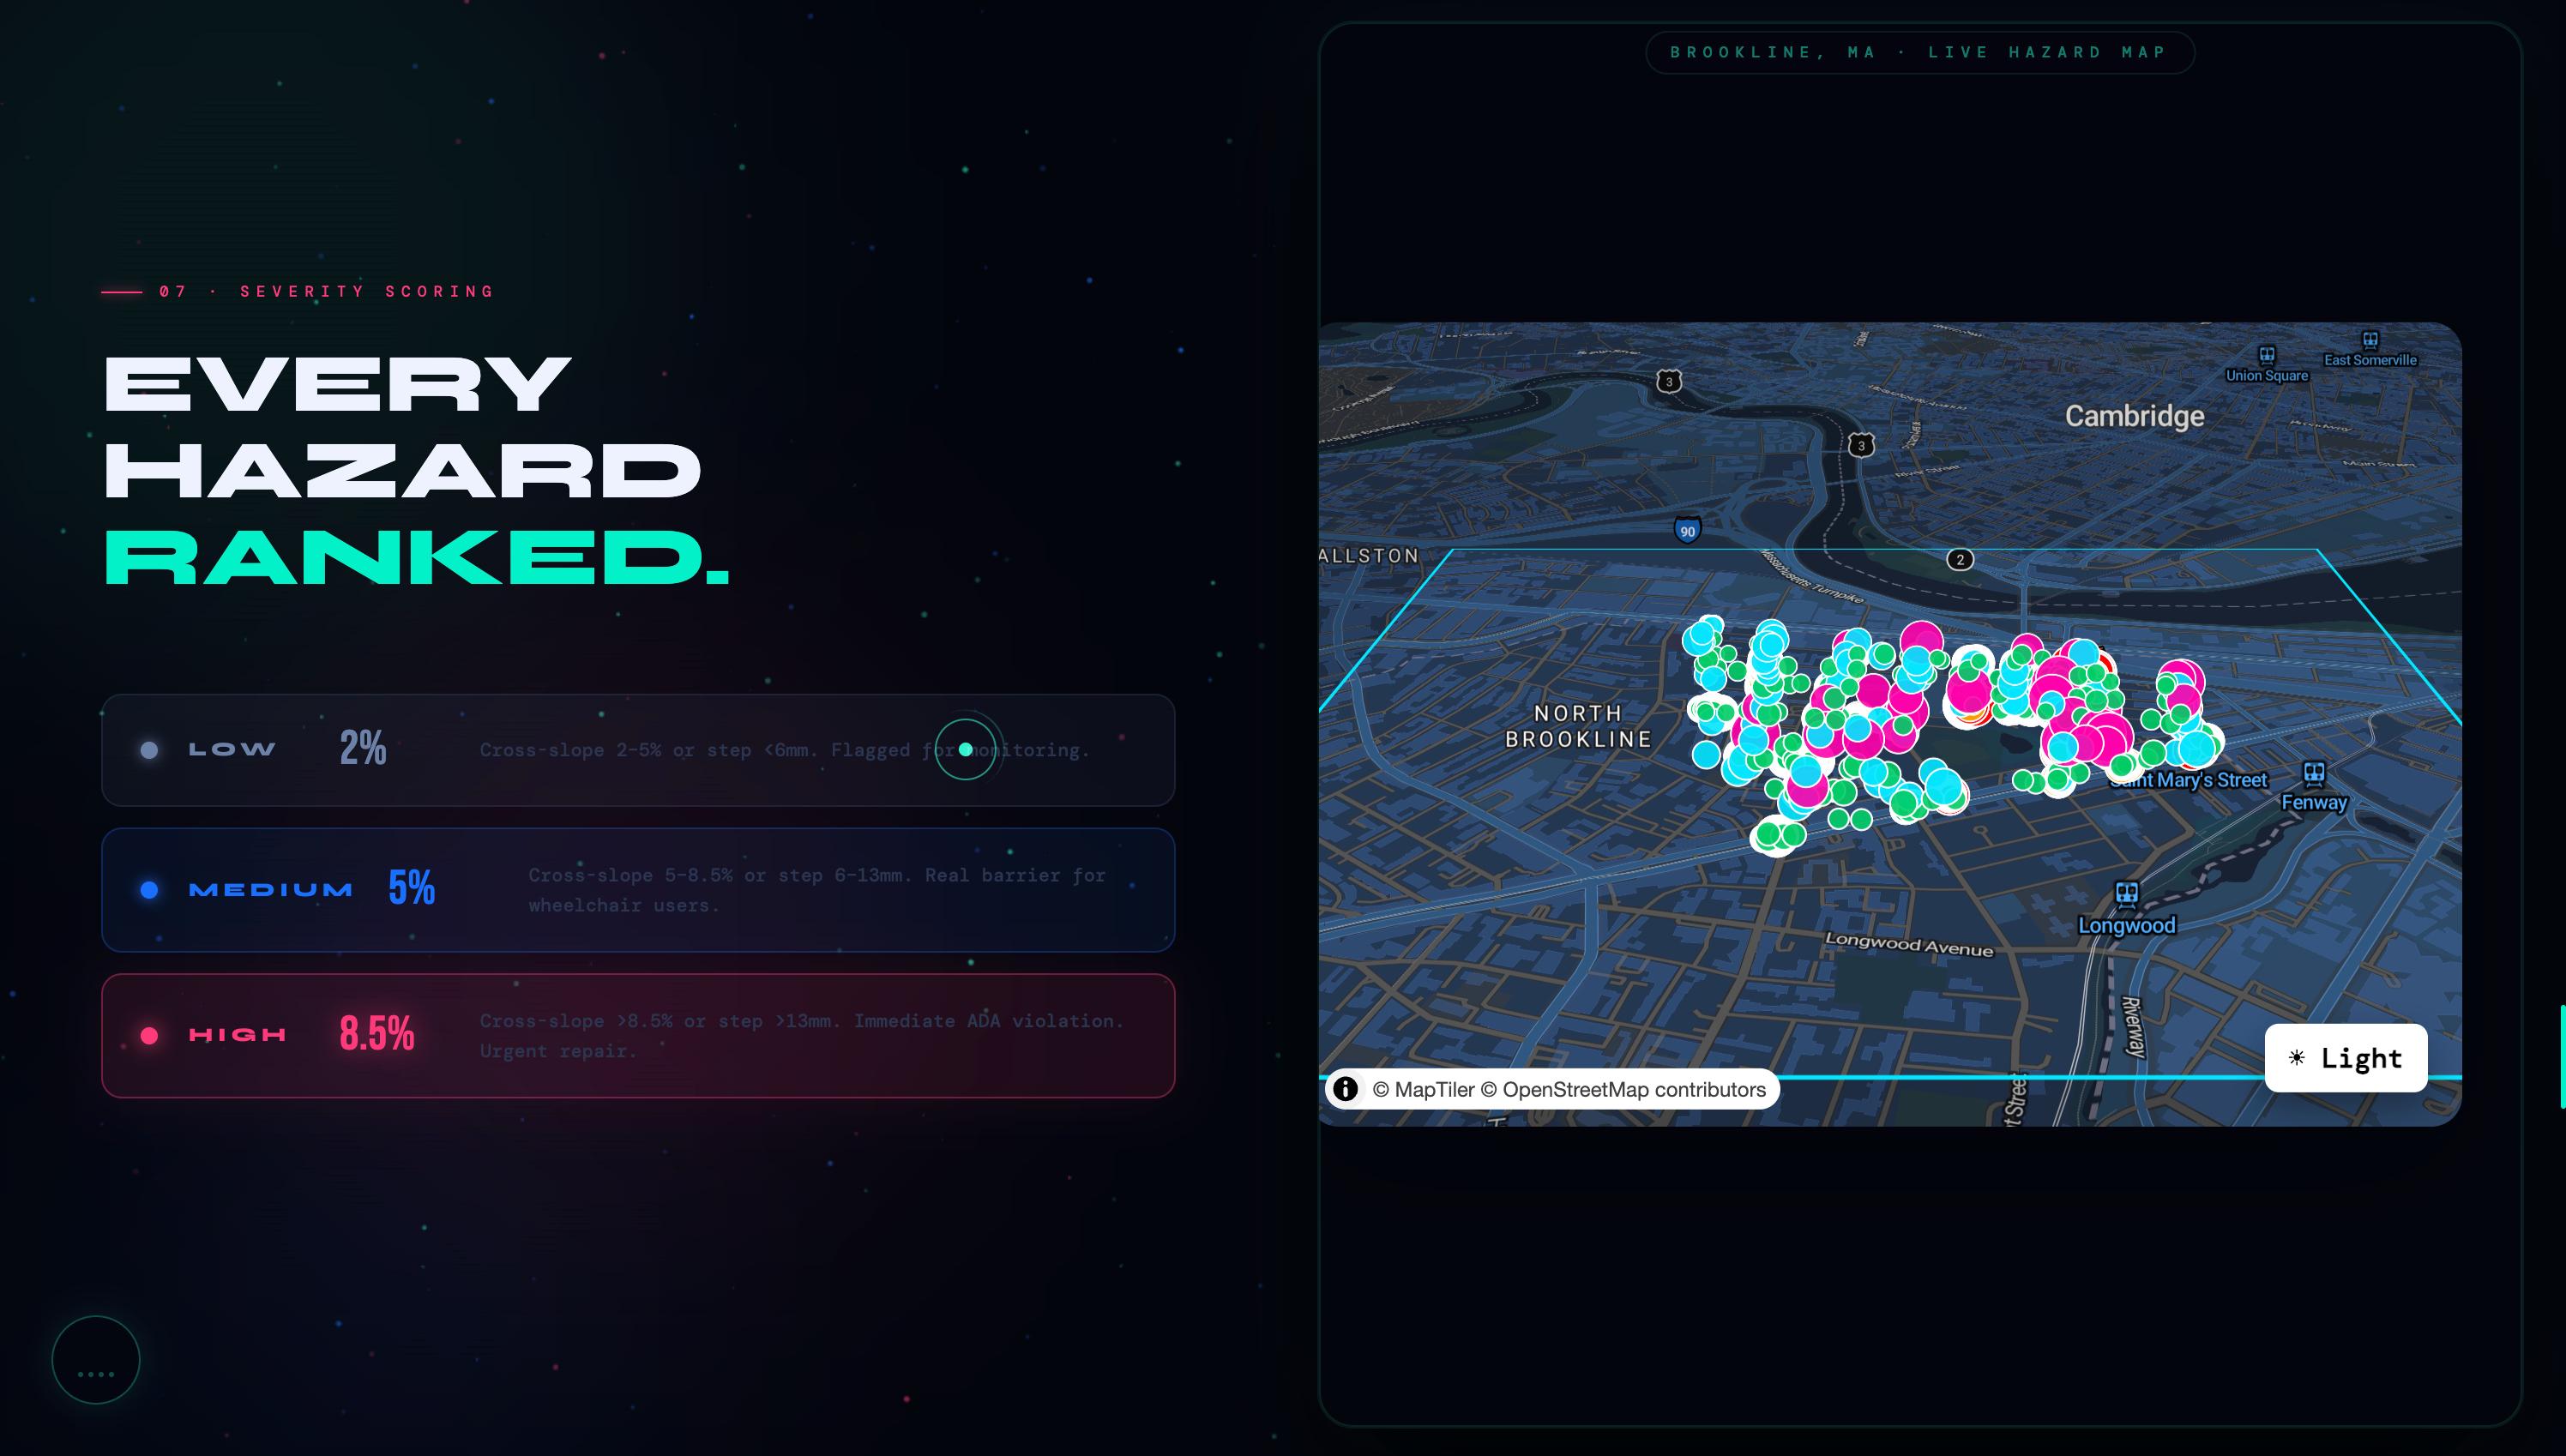
Severity Scoring
| Severity | Cross-Slope | Vertical Step | ADA Reference |
|---|---|---|---|
| LOW | 2% – 5% | 0 – 6mm | §4.3.7 |
| MEDIUM | 5% – 8.5% | 6mm – 13mm | §4.3.7, §4.5.2 |
| HIGH | > 8.5% | > 13mm | §4.3.7, §4.5.2 |
A hazard is scored at the highest tier triggered by either metric.
Data Sources
All data provided by Cyvl.ai via their mobile LiDAR capture vehicle surveying Brookline, MA.
| File | Format | Contents |
|---|---|---|
aboveGroundAssets.geojson |
GeoJSON | Every mapped above-ground asset (sidewalks, curbs, ramps) |
pointcloud_coverage.json |
GeoJSON | LiDAR tile footprints with potree_url and download_url per tile |
streetviewImages.geojson |
GeoJSON | Geolocated JPEG frames from the survey vehicle |
Point Cloud Tile Schema
{
  "type": "Feature",
  "geometry": { "type": "Polygon", "coordinates": [[...]] },
  "properties": {
    "filename": "tile_001.laz",
    "filename_no_ext": "tile_001",
    "dataset": "brookline_2024",
    "baseUrl": "https://cdn.cyvl.ai/f6ee4cf76c80.../",
    "lasPath": "laz/tile_001.laz",
    "potreePath": "potree/tile_001.laz.potree",
    "lon": -71.1284,
    "lat": 42.3317,
    "alt": 12.4
  }
}
Web Application
Frontend
Stack: Vite 5 · React 18 · TypeScript · MapLibre GL · Tailwind CSS
The frontend is a split-panel layout:
- Left (50%) — scrolling explainer page with animated sections covering the problem statement, pipeline, mathematics, and research impact
- Right (50%) — fixed interactive hazard map of Brookline
Key components:
| Component | Description |
|---|---|
Map.tsx |
MapLibre GL map with 32,467 hazard markers, sidebar, popups |
index.html |
Animated P.A.P.I explainer with Three.js point cloud, GSAP scroll animations, Web Audio ambient engine |
Map features:
- Color-coded markers by severity (pink = HIGH, cyan = MEDIUM, green = LOW)
- Sidebar with search, severity filter (ALL / HIGH / MEDIUM / LOW)
- Hazard popup showing: candidate ID, type, step height, cross-slope %, repair priority
- 📷 button opens the nearest Cyvl street image in a new tab
- Map auto-rotates on a slow bearing orbit (pauses on user interaction)
Backend API
Stack: Node.js · Express · TypeScript
| Endpoint | Description |
|---|---|
GET /api/hazards |
All 32,467 hazard records as GeoJSON |
GET /api/hazards?candidate_id=CAND_1 |
Hazards filtered by candidate |
GET /api/pointcloud?candidate_id=CAND_1 |
Returns potree_url for 3D viewer |
GET /api/streetview?lat=42.33&lon=-71.12 |
Nearest street image URL by coordinates |
Point Cloud Visualization
Each hazard candidate's LiDAR tile is available as a Potree-streamable point cloud via potree_url. Potree streams massive point clouds to the browser using an octree format — no local conversion required since Cyvl pre-converts all tiles.
The frontend embeds a Potree viewer in an iframe:
<iframe src="/potree/viewer.html?src=<encoded_potree_url>"></iframe>
viewer.html loads the Potree library and initializes with the candidate's tile URL:
Potree.loadPointCloud(src, "Sidewalk", e => {
  viewer.scene.addPointCloud(e.pointcloud);
  viewer.setEDLEnabled(true);
  viewer.fitToScreen();
});
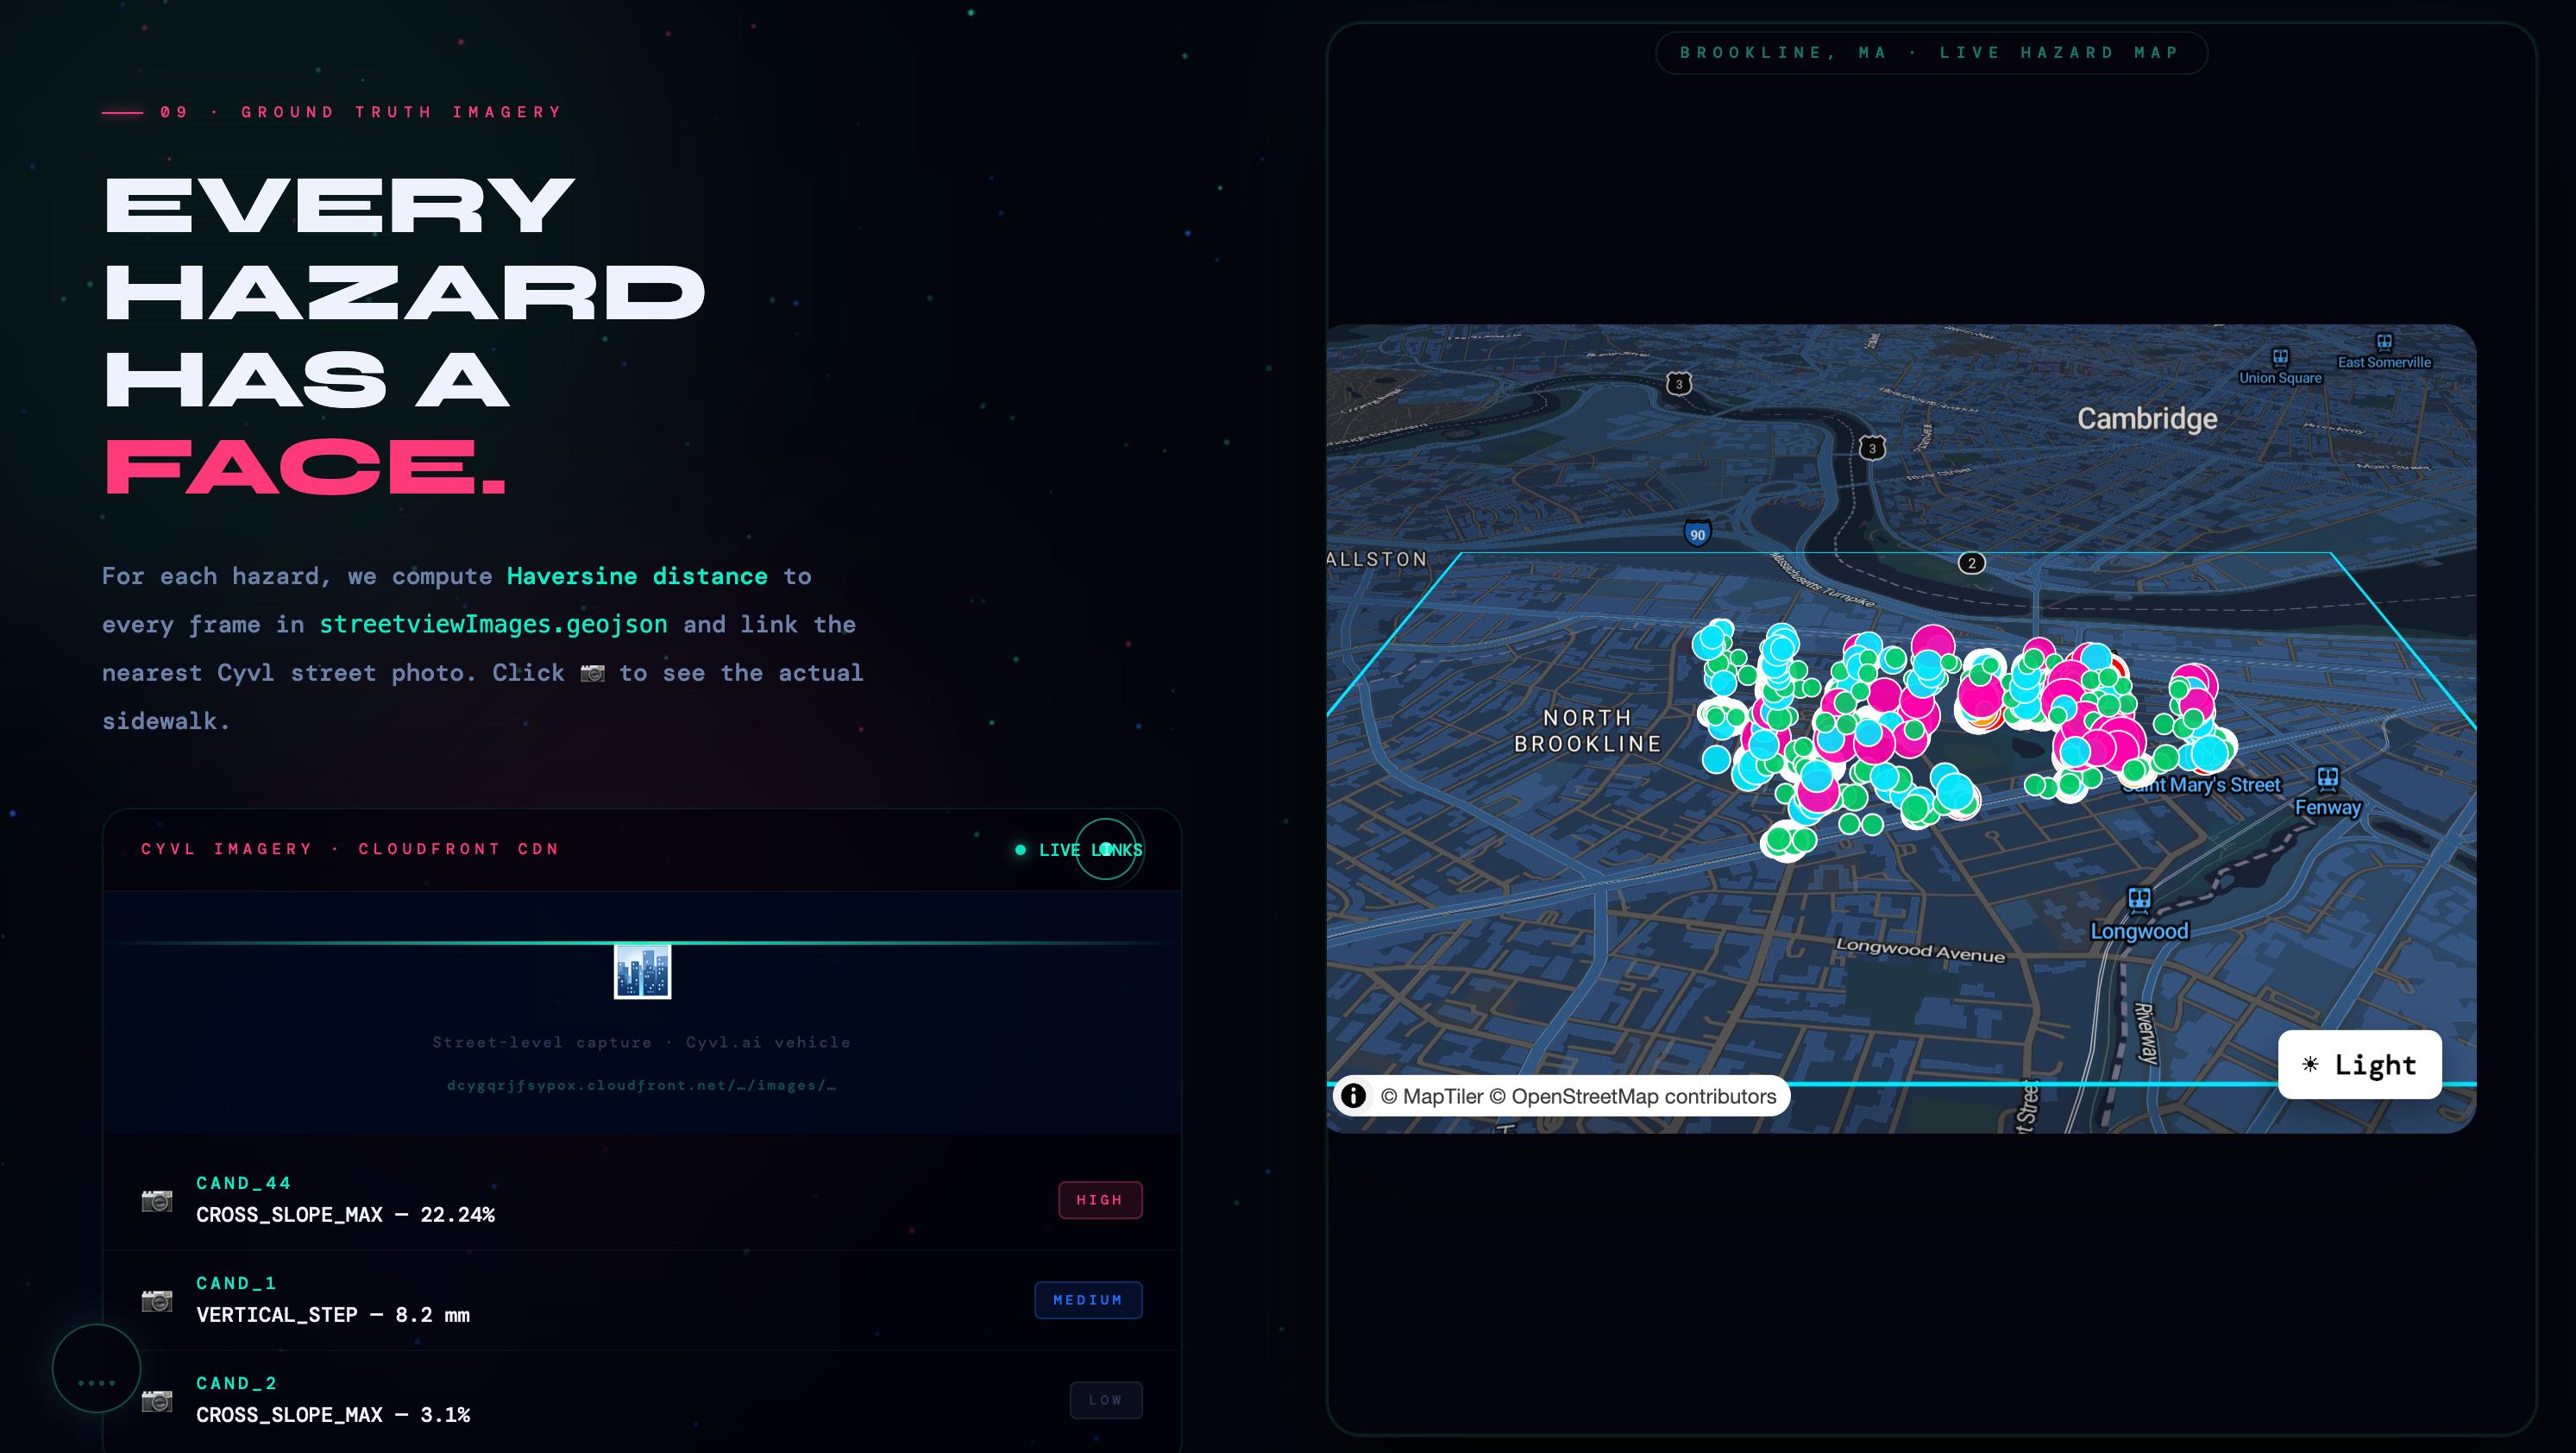
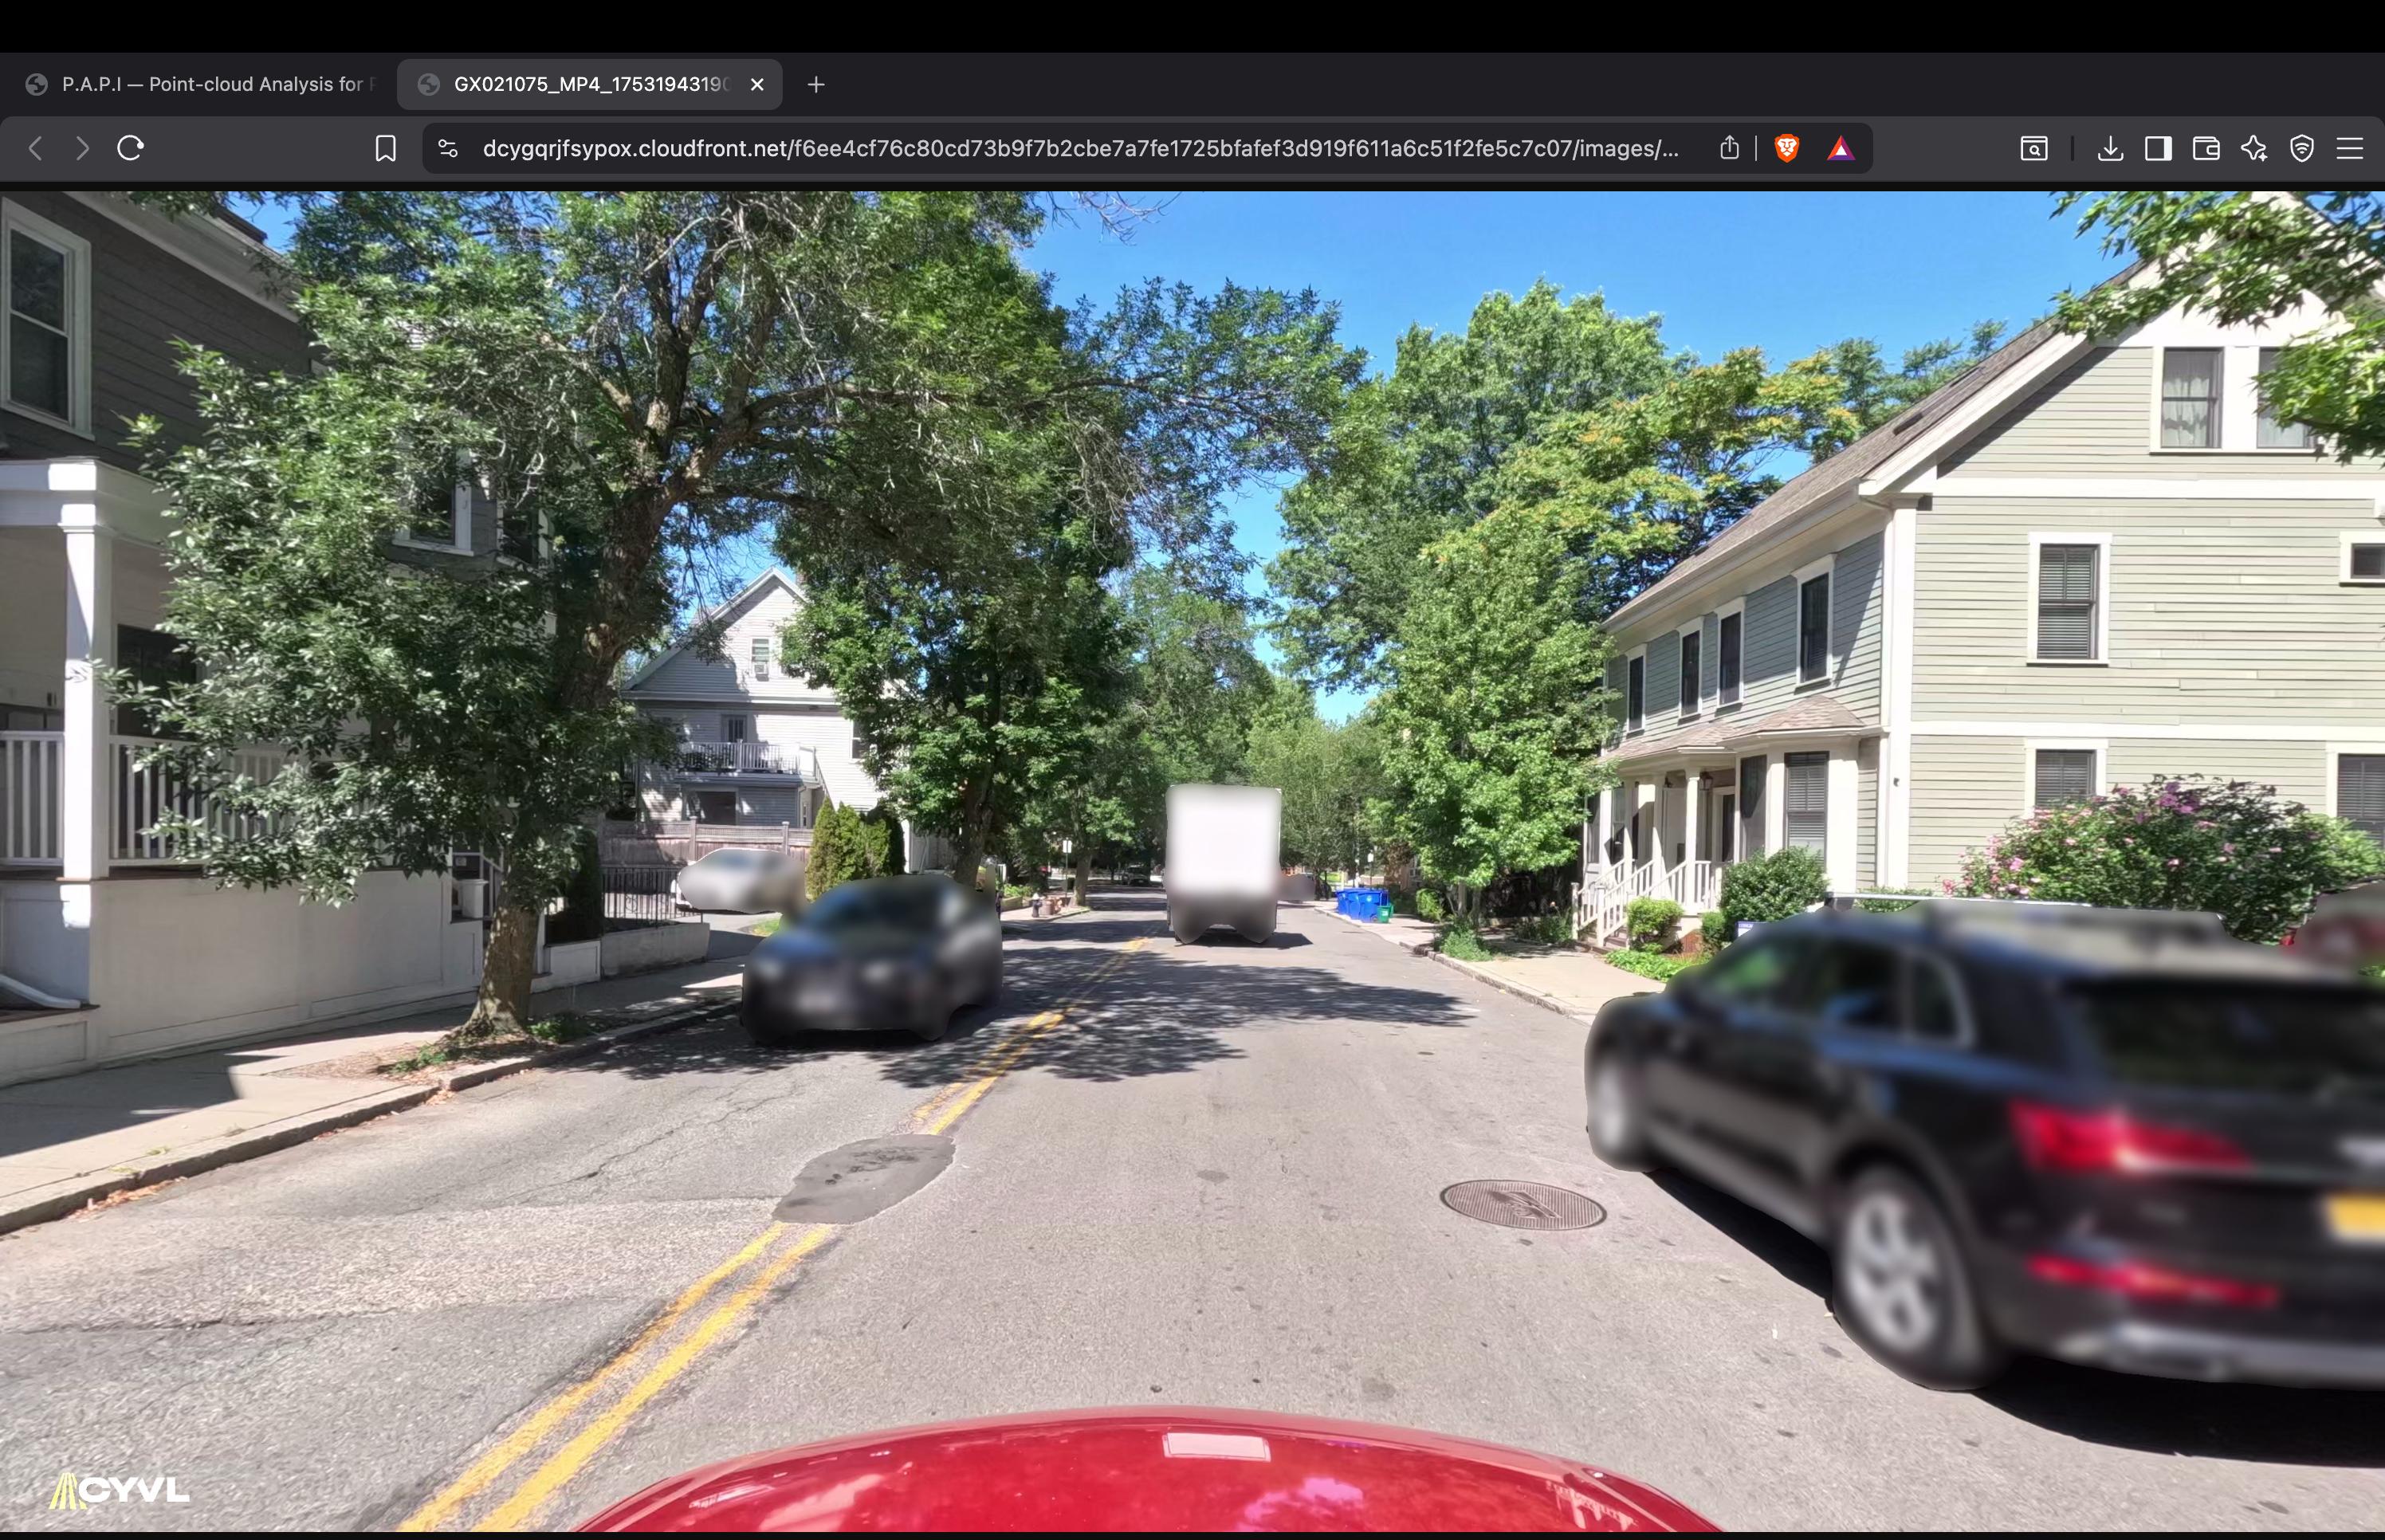
Street Image Integration
For every detected hazard, we find the nearest Cyvl street image using Haversine distance computed across all frames in streetviewImages.geojson:
$$d = 2r \arcsin!\left(\sqrt{\sin^2!\left(\frac{\phi_2-\phi_1}{2}\right) + \cos\phi_1 \cos\phi_2 \sin^2!\left(\frac{\lambda_2-\lambda_1}{2}\right)}\right)$$
The matched image URL (hosted on Cyvl's CloudFront CDN) is stored per hazard and surfaced via the 📷 button in the map sidebar — giving inspectors immediate visual confirmation of what the mathematics flagged.
Getting Started
Prerequisites
- Python 3.10+
- Node.js 20+
- npm 9+
rtreeorpygeosfor geopandas spatial indexing
Installation
1. Clone the repository
git clone https://github.com/your-org/bu_spark_papi.git
cd bu_spark_papi
2. Set up the Python environment
cd analysis
python -m venv venv
source venv/bin/activate        # Windows: venv\Scripts\activate
pip install -r requirements.txt
requirements.txt includes:
geopandas
laspy[lazrs]
numpy
shapely
requests
scipy
3. Install the API
cd apps/api
npm install
cp .env.example .env            # add your Cyvl API credentials if required
4. Install the frontend
cd apps/web
npm install
Running the Pipeline
Note: Steps 1–3 can be run without Cyvl credentials. Step 4 requires network access to download LAZ tiles.
# From the project root
cd analysis
source venv/bin/activate

# Step 1 — extract candidates
python extract_sidewalks.py

# Step 2 — buffer corridors
python make_candidate_buffers.py

# Step 3 — match tiles
python match_buffers_to_tiles.py

# Step 4 — clip point clouds (downloads LAZ tiles, may take time)
python clip_pointcloud.py --candidate-id CAND_1 --max-tiles 2

# Step 5 — detect hazards
python detect_hazards.py
To run the full pipeline across all 250 candidates:
for i in $(seq 1 250); do
  python clip_pointcloud.py --candidate-id CAND_$i --max-tiles 1 --no-download
  python detect_hazards.py --candidate-id CAND_$i
done
Running the Web App
Start the API:
cd apps/api
npm run dev
# Runs on http://localhost:3001
Start the frontend:
cd apps/web
npm run dev
# Runs on http://localhost:5174
To enable map auto-rotation, add one line to Map.tsx inside your map load callback:
map.on('load', () => {
  window.__papiMap = map;   // ← enables auto-rotate from index.html
  // ... rest of your load code
});
ADA Compliance Reference
| ADA Section | Requirement | P.A.P.I Metric |
|---|---|---|
| §4.3.7 | Cross-slope of accessible routes ≤ 2% | cross_slope_pct |
| §4.5.2 | Vertical changes in level ≤ 6mm without bevel | vertical_step_mm |
| §4.3.8 | Running slope ≤ 5% (1:20) on accessible routes | (future work) |
| §4.13 | Door threshold max 13mm | (future work) |
Reference: ADA Standards for Accessible Design (2010)
Ethics & Impact
Who This Research Serves
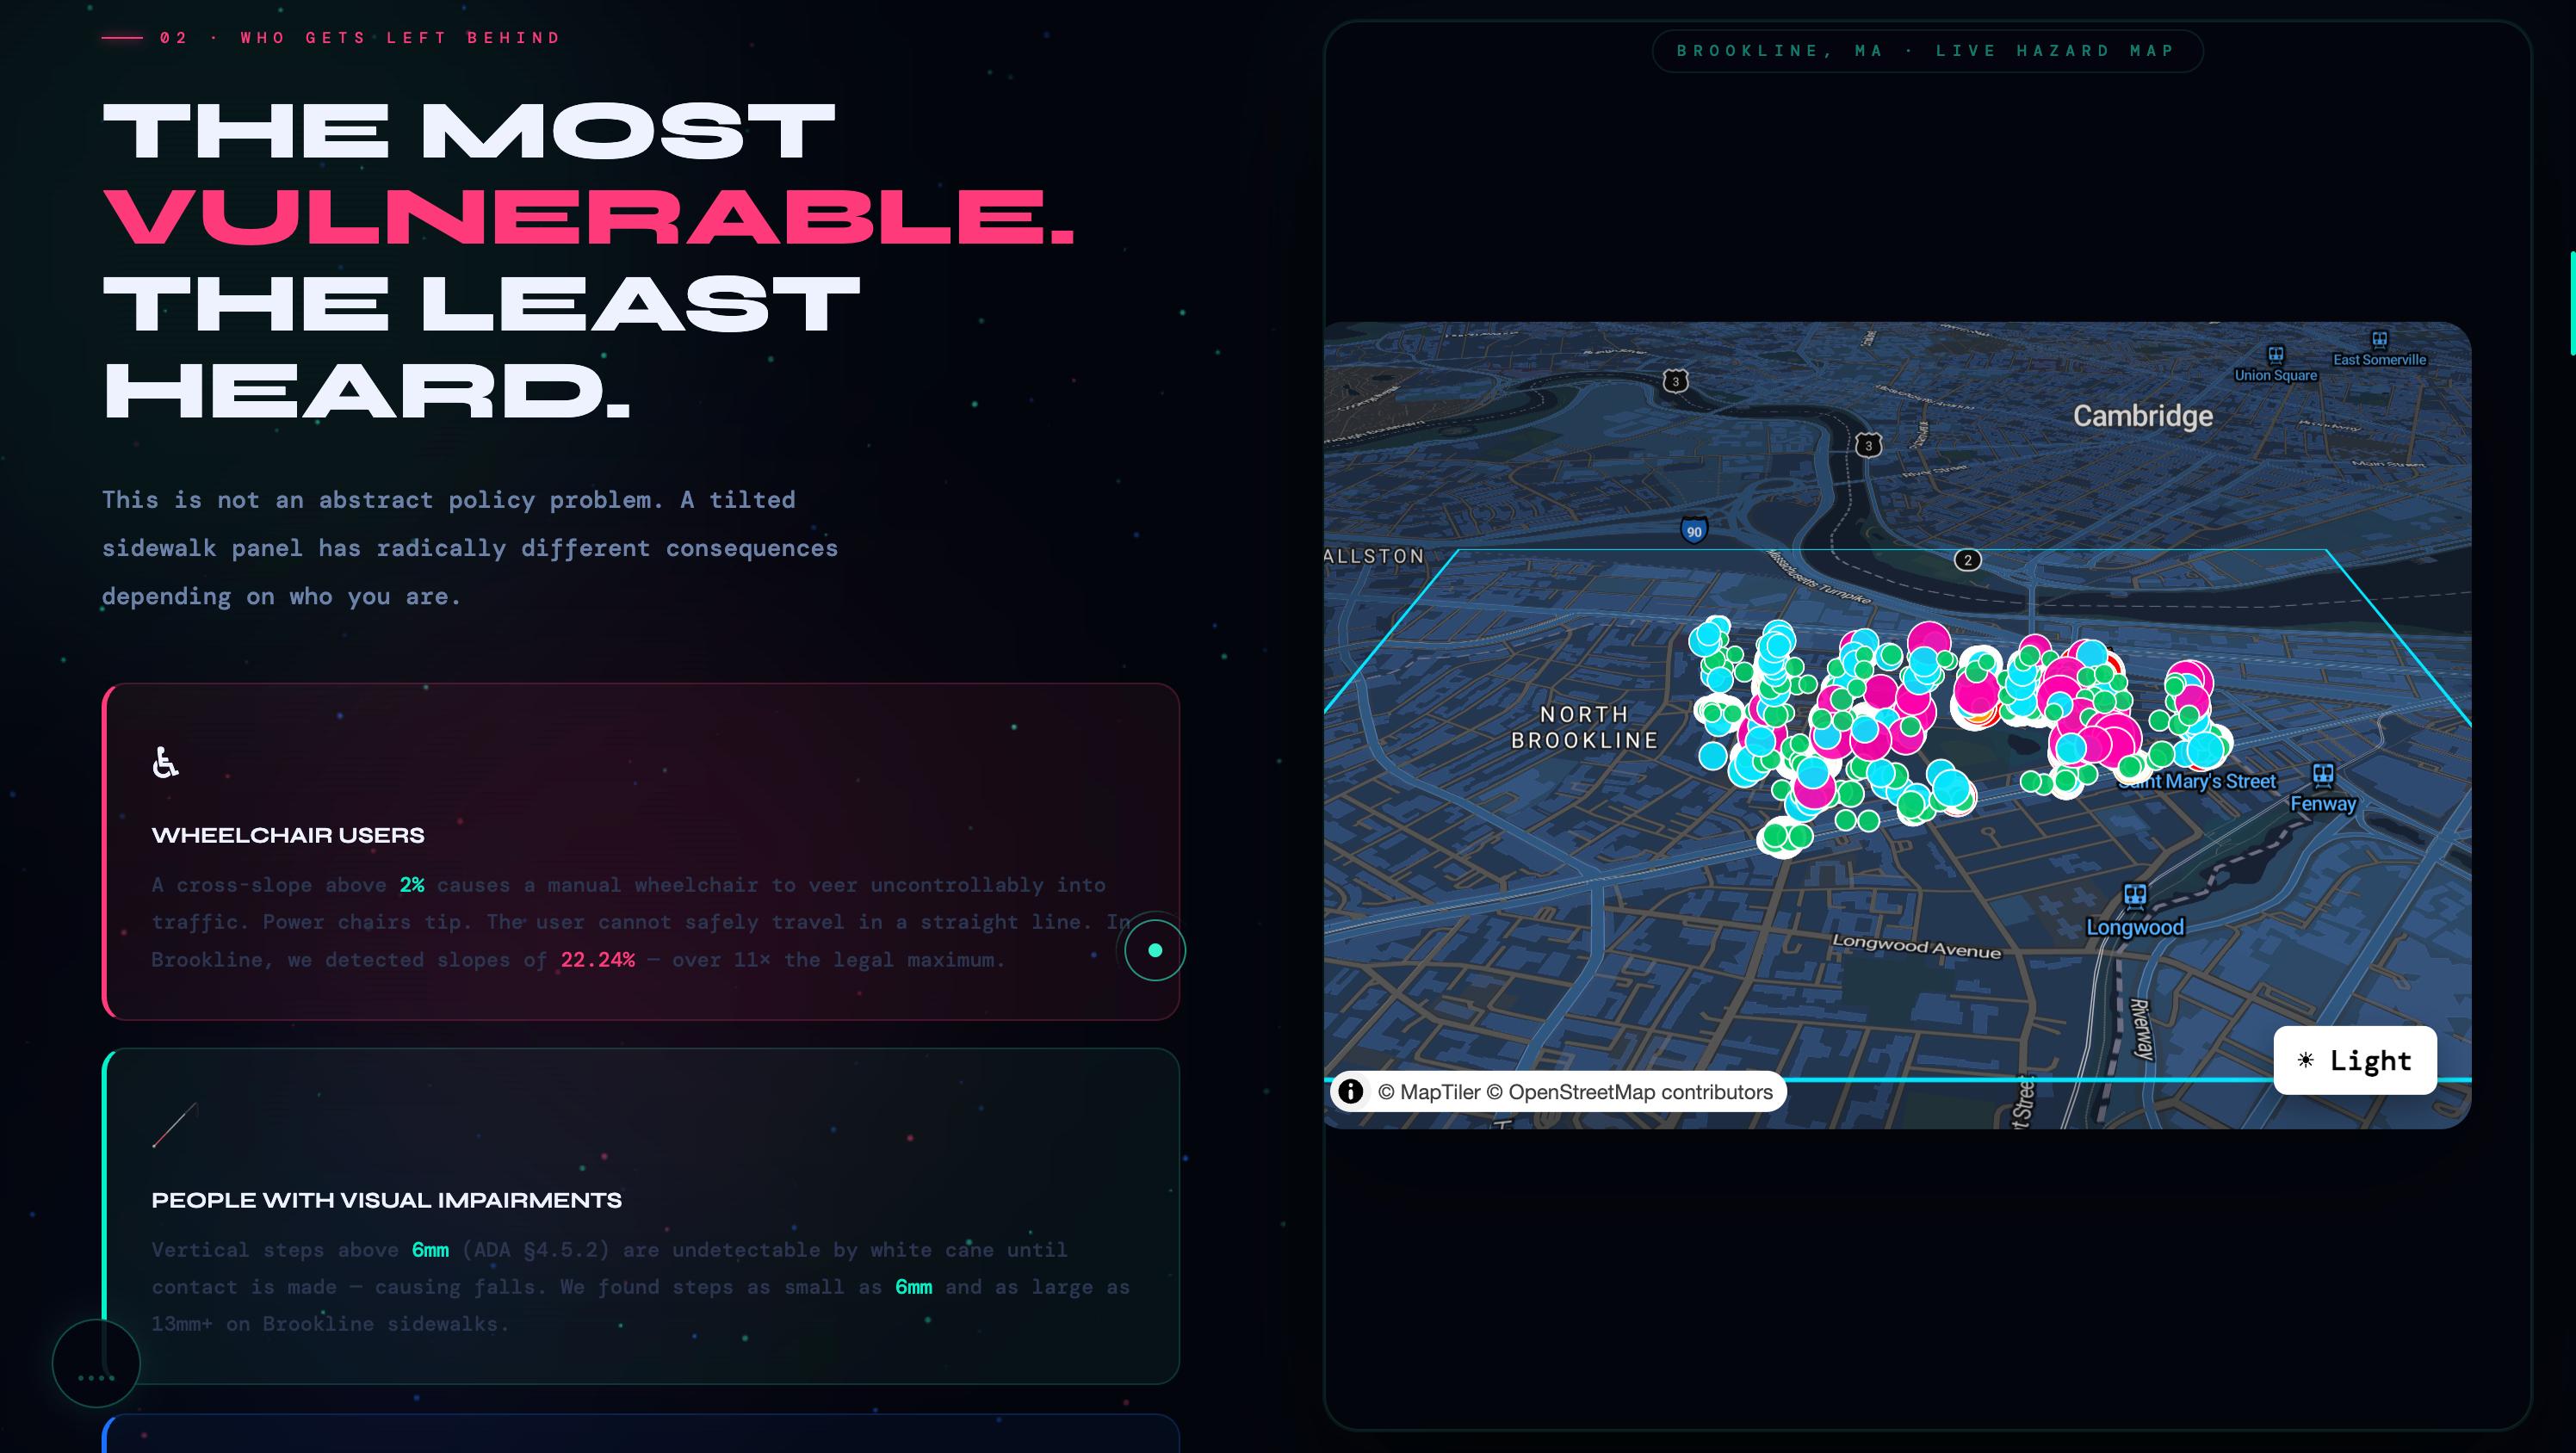
Manual sidewalk inspection is expensive, slow, and fundamentally reactive — cities only fix what gets reported. The populations who most depend on accessible sidewalks are also those least likely to have their complaints acted on:
- Wheelchair users — a cross-slope above 2% causes manual chairs to veer uncontrollably toward traffic
- People with visual impairments — vertical steps above 6mm are undetectable by white cane until contact, causing falls
- Unhoused individuals — sidewalks are primary infrastructure for people without vehicles; hazards are disproportionately concentrated in areas with higher unhoused populations
- Elderly residents — falls on uneven pavement are a leading cause of hospitalization for adults over 65
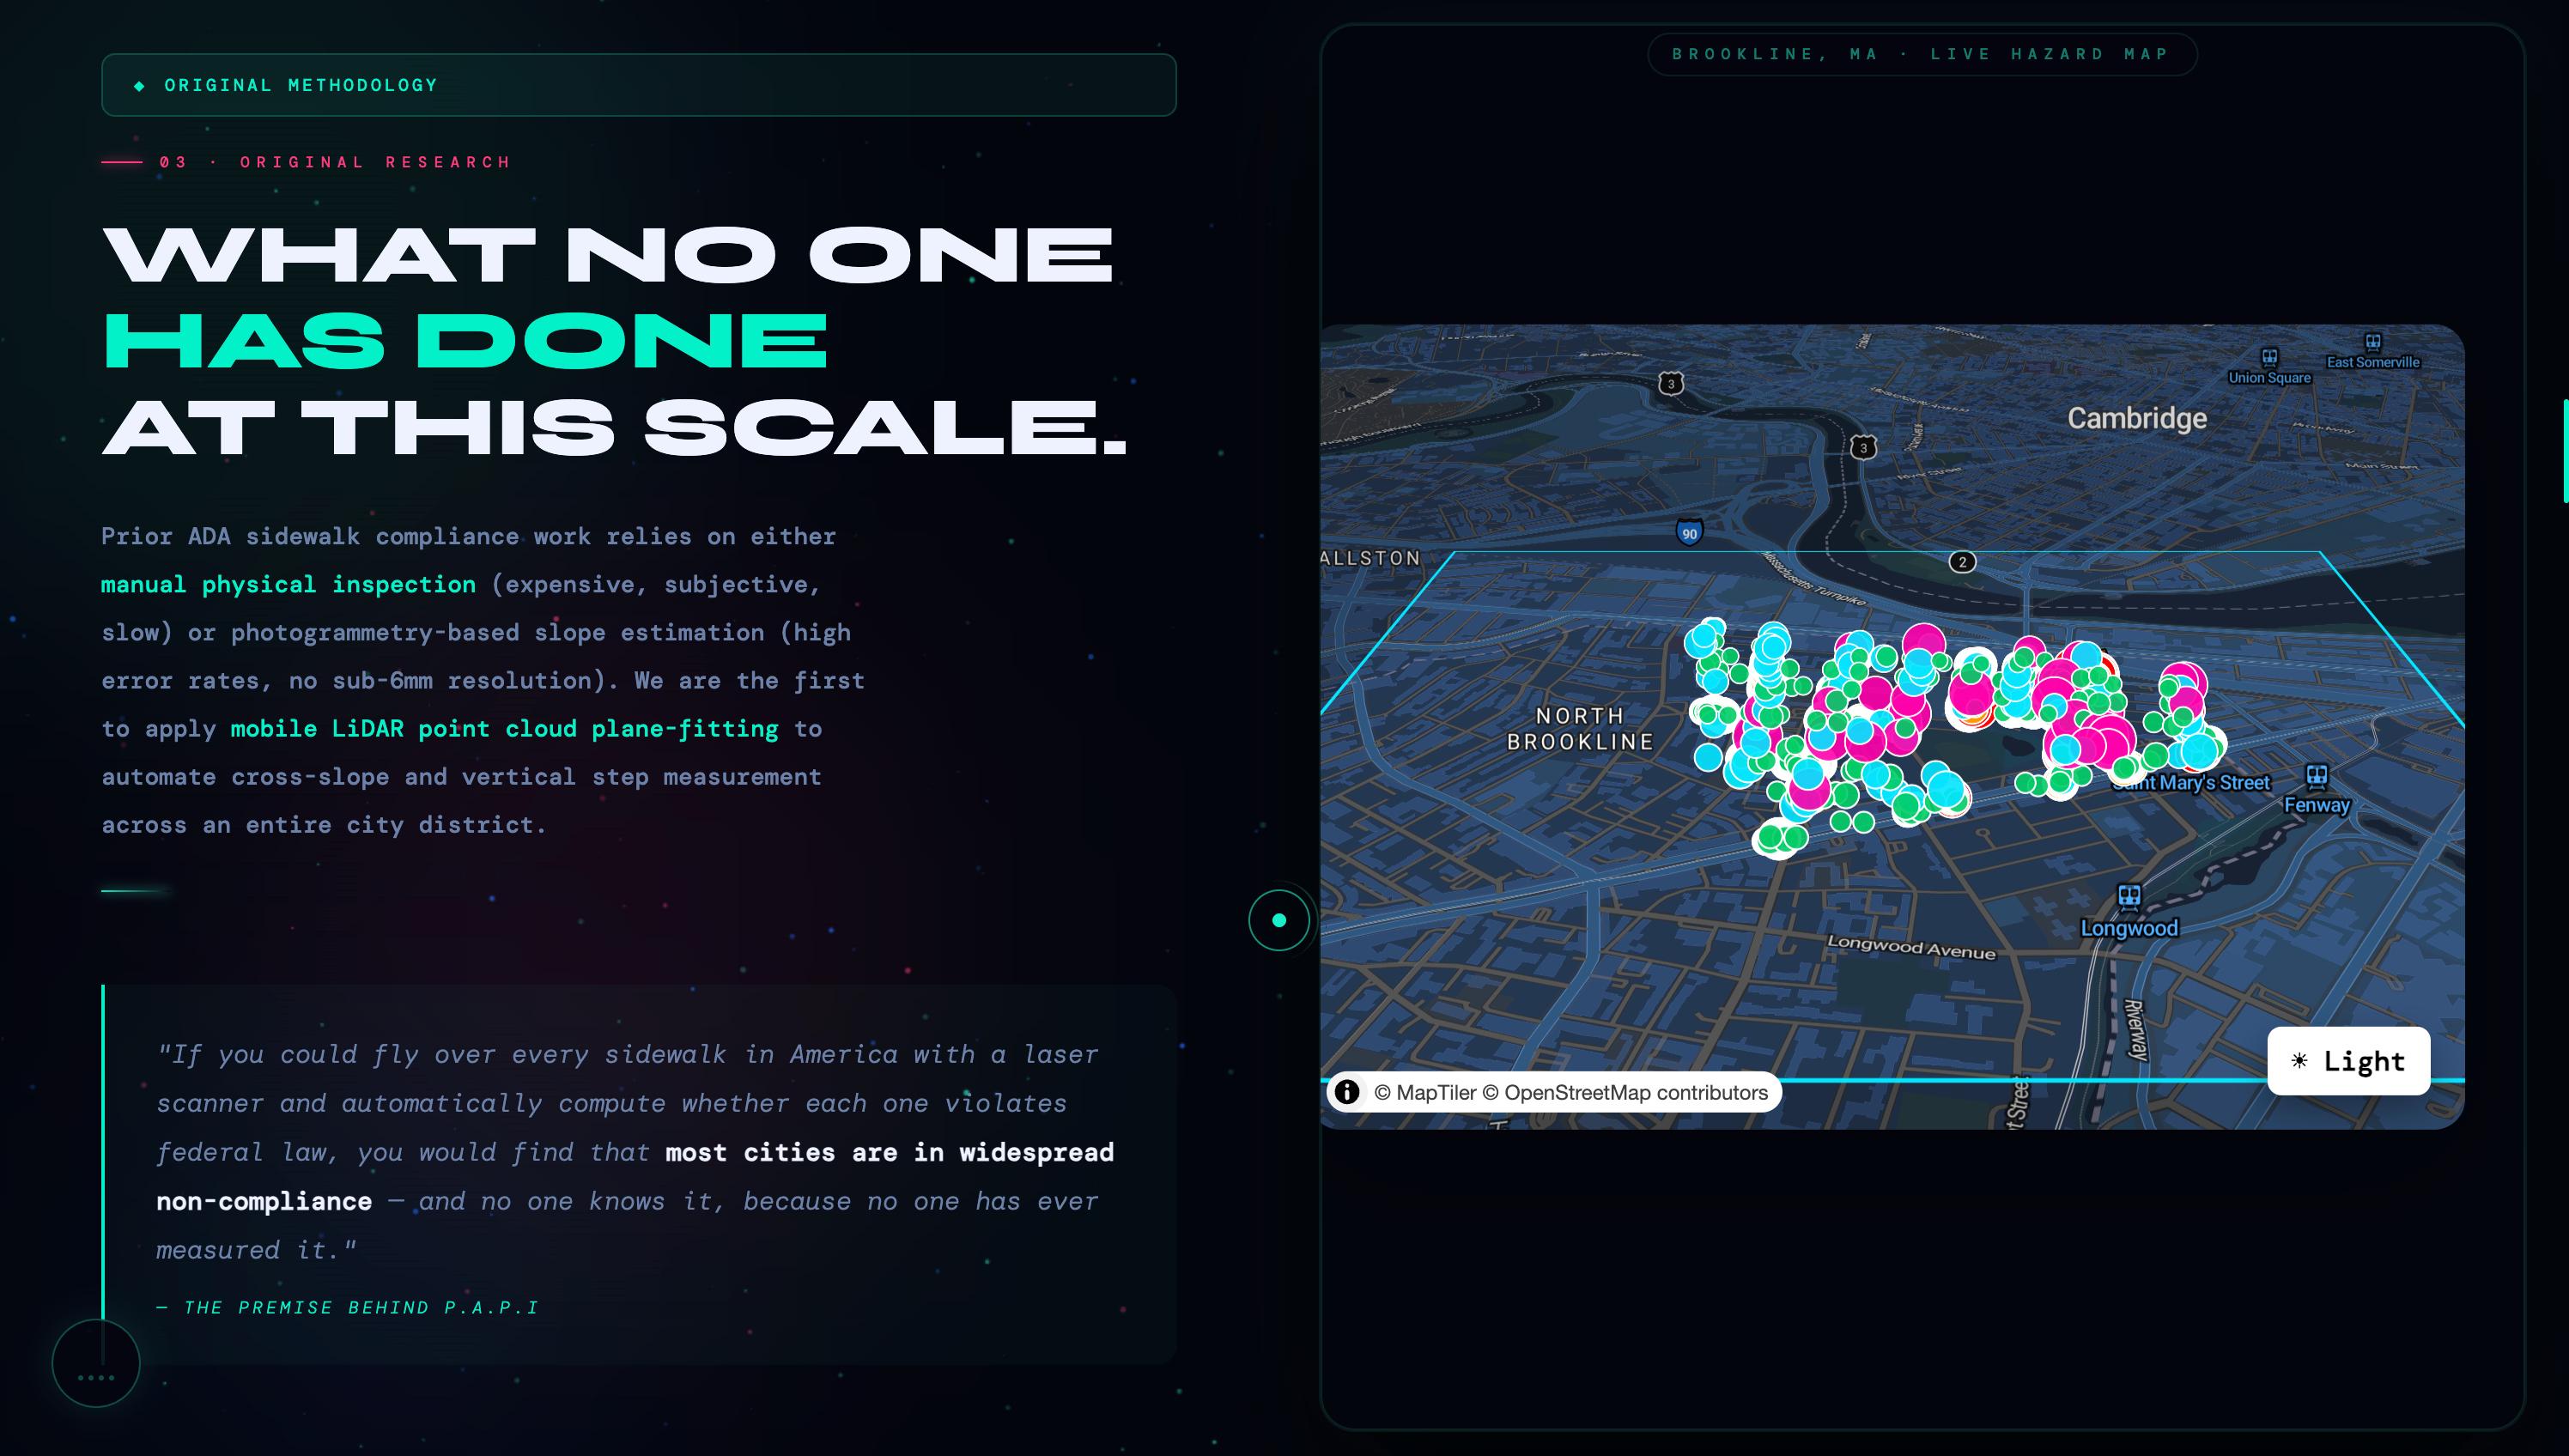
Why This Is Original Research
Prior ADA sidewalk compliance work relies on manual physical inspection or photogrammetry-based estimation. P.A.P.I is the first pipeline to:
- Apply mobile LiDAR point cloud plane-fitting to automate cross-slope measurement at citywide scale
- Combine geometric math, spatial clipping, and image evidence into a single reproducible pipeline
- Produce a web-deployable, interactive hazard map tied to real street photography for each flagged location
Scalability
This pipeline is not specific to Brookline. Any city with Cyvl coverage can be analyzed by swapping the input GeoJSON files. The same six scripts, the same mathematics, a different city — sidewalk equity scoring could become a municipal standard.
Tech Stack
Data Pipeline (Python)
| Library | Purpose |
|---|---|
geopandas |
Spatial data loading, CRS reprojection, spatial join |
shapely |
Geometry buffering, polygon containment |
laspy |
Reading and parsing .laz / .las point cloud files |
numpy |
Array operations, least-squares solver (linalg.lstsq) |
scipy |
Additional spatial utilities |
requests |
LAZ tile downloading from CDN |
Backend (Node.js)
| Package | Purpose |
|---|---|
express |
HTTP API server |
typescript |
Type safety |
cors |
Cross-origin resource sharing for frontend |
Frontend (Web)
| Library | Purpose |
|---|---|
react |
UI component framework |
vite |
Build tool and dev server |
typescript |
Type safety |
maplibre-gl |
Interactive WebGL map |
three.js |
3D point cloud visualization in hero section |
tailwindcss |
Utility CSS |
| Web Audio API | Procedurally synthesized ambient audio (no files) |
Contributing
Contributions are welcome, particularly in these areas:
- Running slope detection (ADA §4.3.8) — currently only cross-slope is computed
- Multi-city support — abstracting city-specific paths into a config file
- Performance — parallelizing the clip + detect pipeline across all 250 candidates
- Potree viewer — deeper React integration replacing the iframe approach
- Export — generating city-submission-ready PDF reports per candidate
To contribute:
git checkout -b feature/your-feature-name
# make changes
git commit -m "feat: describe your change"
git push origin feature/your-feature-name
# open a pull request
License
MIT License — see LICENSE for details.
Data provided by Cyvl.ai. LiDAR tiles and street imagery remain property of Cyvl and are used under research agreement.
**P.A.P.I** · Point-cloud Analysis for Pathway Inclusion Brookline, MA · 2024 Built with LiDAR, mathematics, and the belief that public space should be accessible to everyone. *The data has always been there. We just finally did the math.*
Built With
- 18
- api
- audio
- css
- cyvl.ai
- data
- express.js
- geopandas
- html
- javascript
- laspy
- lidar
- maplibre
- maptiler
- node.js
- numpy
- python
- react
- shapely
- tailwind
- three.js
- typescript
- vite
- web
- webgl

Log in or sign up for Devpost to join the conversation.