-
-
-
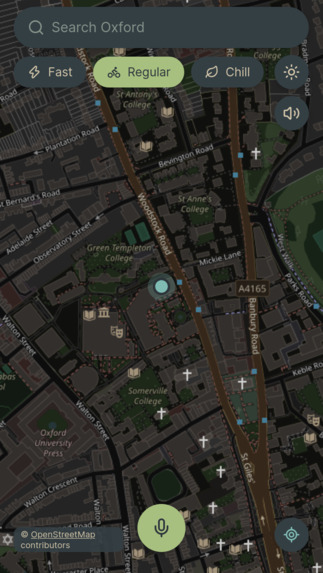
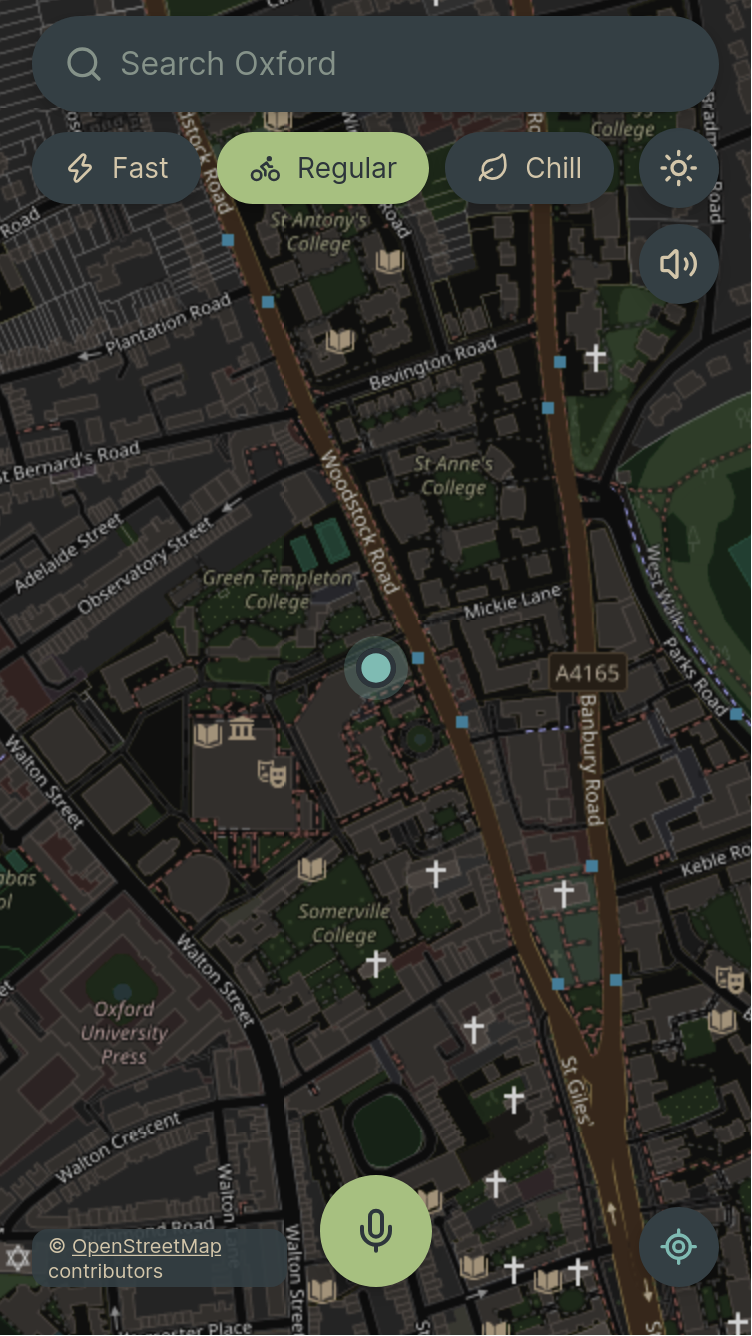
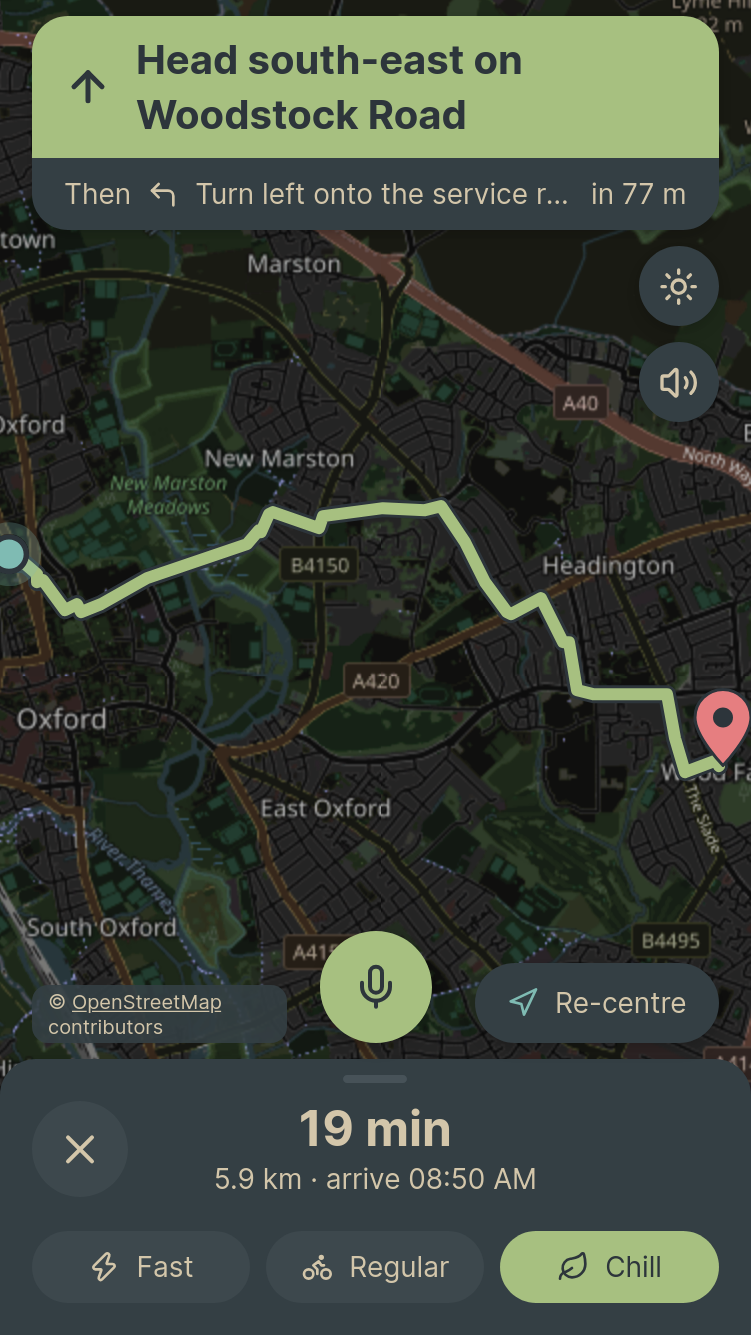
Dark UI
-
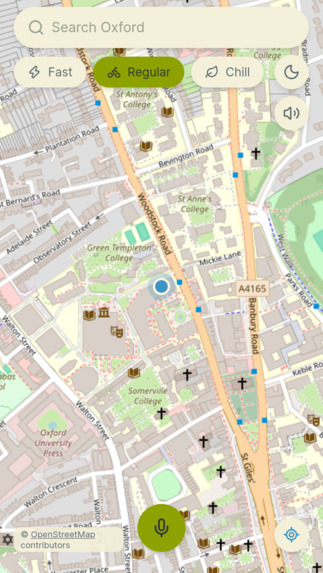
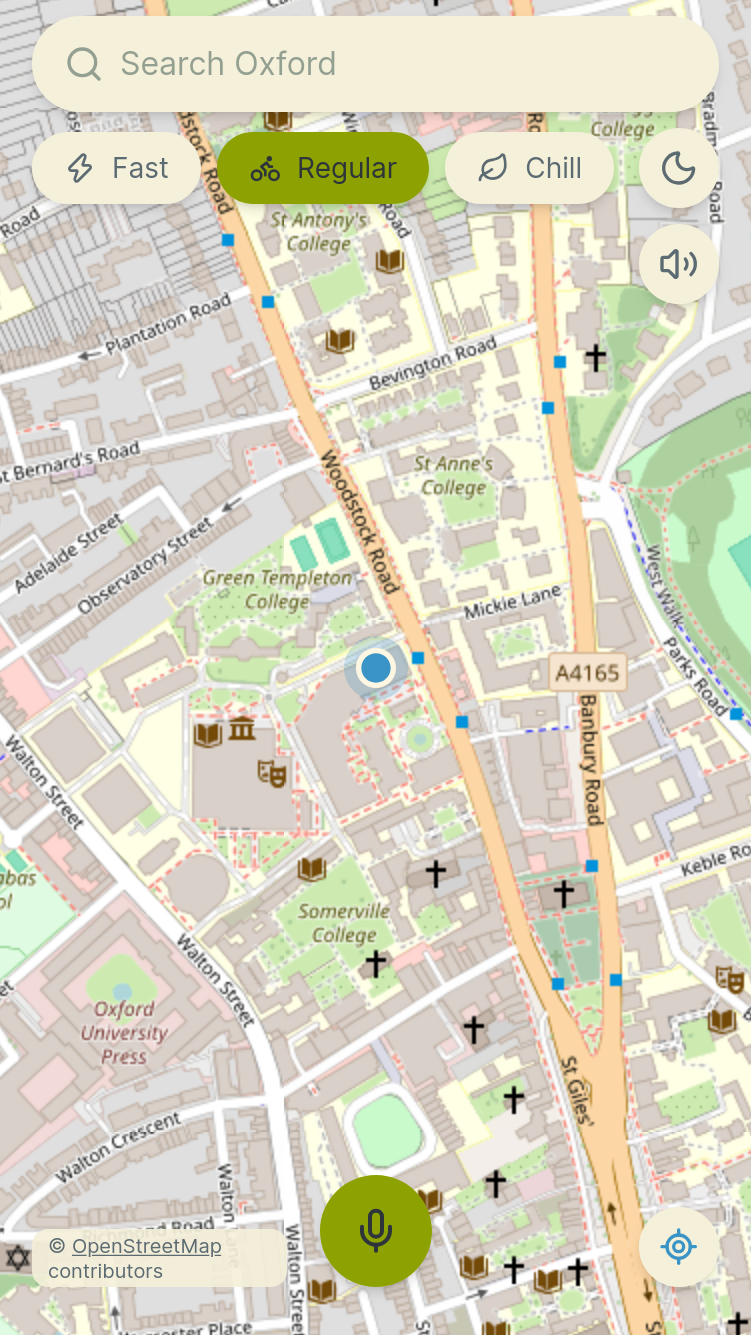
Light UI
-
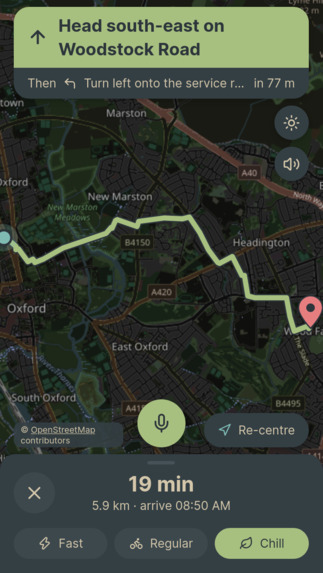
Looking at a long route
-
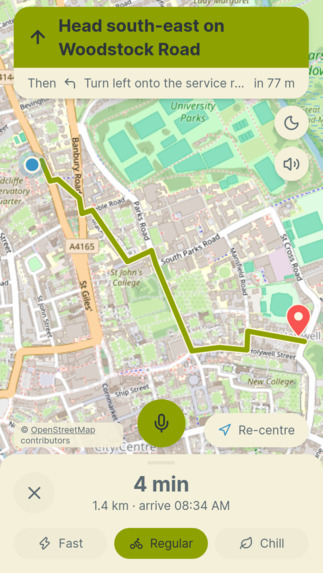
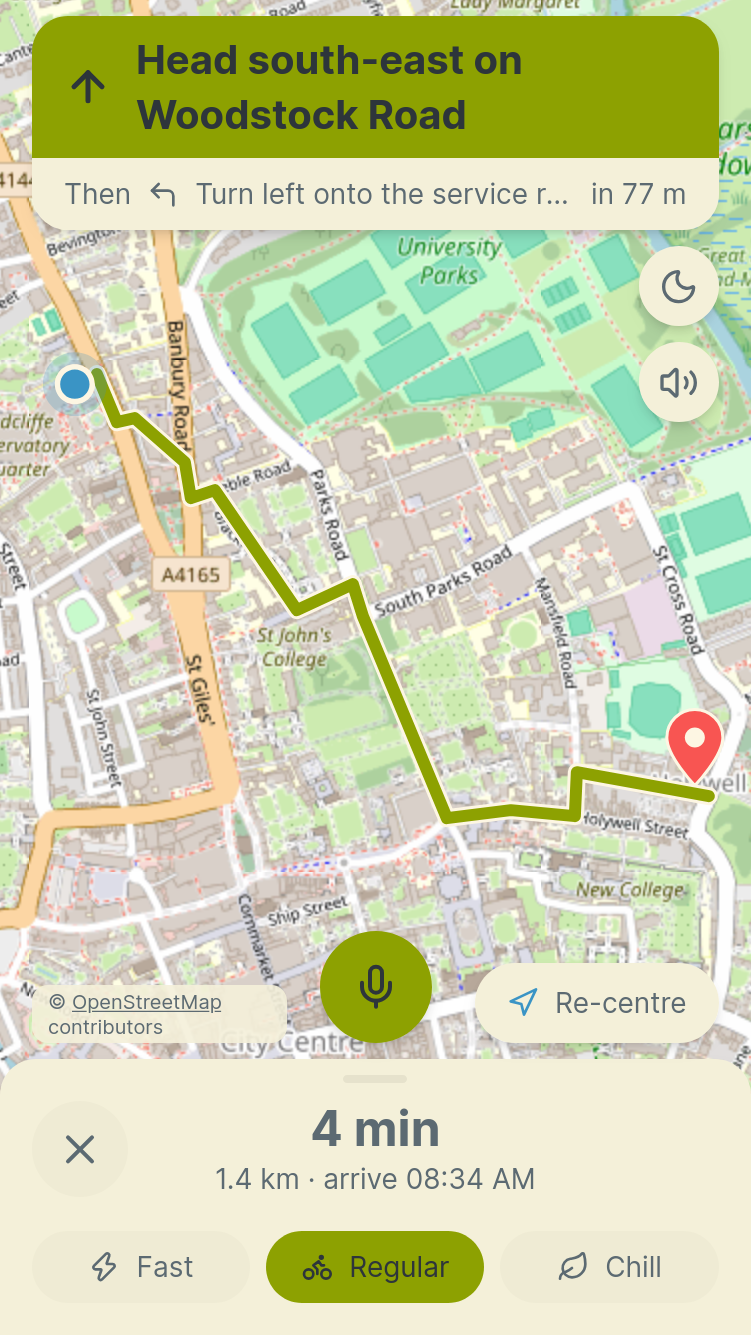
Looking at a short route
-
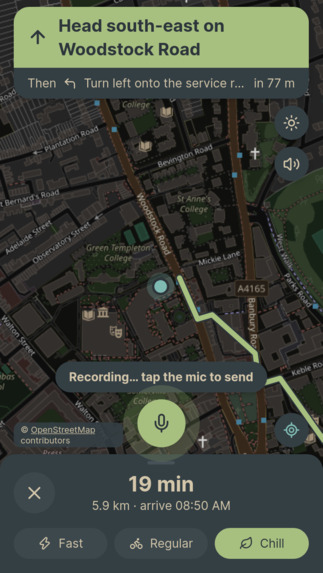
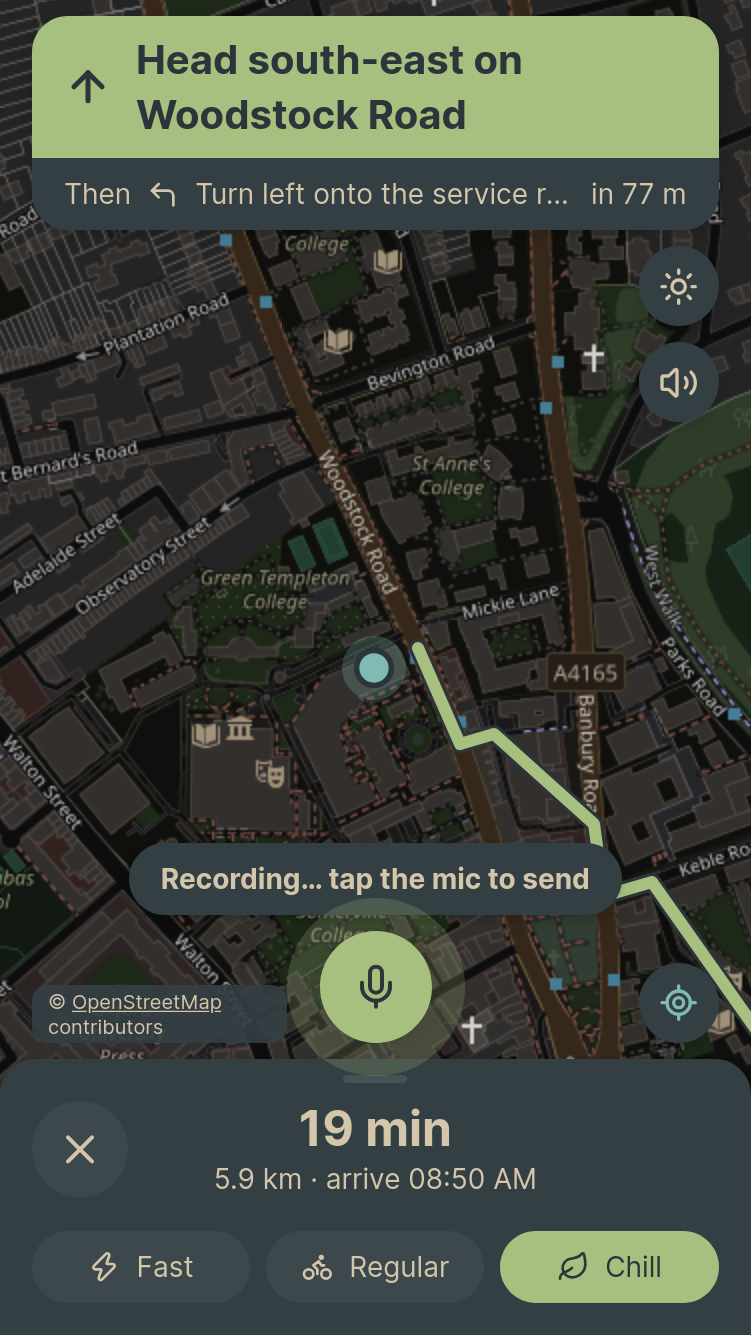
Speaking to Gemini
Inspiration
Google Maps finds the shortest path. For a cyclist, that is often the wrong answer. A route that is two minutes faster on paper can be steep, unlit, full of traffic or covered in gravel, and then it is not faster at all. Maps also gives the same route at 2pm and at 11pm, in dry weather and in a downpour.
The hackathon theme was TIME, and that gave us the angle: the best route depends on when you ride. After dark you want lit streets. At rush hour you want to stay off the main roads. In the rain you want to avoid gravel. And you cannot type while cycling, so you should be able to just talk to the app.
What it does
OxRide plans bike routes in Oxford for the time you actually ride.
- Time changes the route. Darkness, rush hour and rain all change the cost of each road, so the same trip can follow a different route at night than at noon.
- Three ride types. Fast one stays close to the shortest route. Regular prefers cycle paths and avoids repeated climbs. Chill takes cycle paths and quiet roads even when they are longer.
- When to leave. One line under the route tells you if waiting helps, for example "rain stops in 20 minutes", or if sunset, ice or the end of rush hour is coming.
- Voice. Hold the mic button and say "take me to the Ashmolean, quiet roads please". Gemini listens to the audio, works out what you want and shows its reply on screen. ElevenLabs speaks every turn-by-turn direction.
- Navigation. The same screen shows the next turn, time and distance left. If you leave the route, it reroutes from where you are.
- It learns from rides. An anonymous ride log in Tiger Data records how fast people really ride each street at each hour. Those speeds feed the ETA, and streets where several riders keep turning back are treated as possible closures and avoided.
How we built it
- Map. We downloaded Oxford's cycling network from OpenStreetMap with osmnx and kept each road's length, type, surface and lighting. Heights come from OpenTopoData, which gives us a gradient for every road. This runs once and is saved as a graph file the server loads at startup.
- Routing. The search is our own A* written with
heapq. We use networkx only to store the graph. The cost of a road is
$$ \text{cost} = \big(L \cdot f_{\text{road}} \cdot f_{\text{surface}} + w_{\text{hill}} \cdot \text{climb}\big) \cdot P_{\text{time}} $$
where L is the length in metres, the road factor and the surface factor come from the ride type, the hill weight sets how much climbing costs, and P is the time penalty. At night, unlit roads get P = 1.6. At rush hour, trunk, primary and secondary roads get P = 1.5. Gravel in rain gets P = 1.4. A street riders keep turning back on gets P = 5.
- ETA. Each road has a speed from a model based on TU Delft cycling research: a base of 15 mph, adjusted for gradient, surface, road type and wind, plus time at junctions. When we have enough real GPS points for a street at that hour, we use the measured speed instead.
- Weather and time. Open-Meteo gives an hourly forecast (wind, rain, temperature, day or night), cached for 30 minutes with a saved snapshot as backup. The "when to leave" hint reads that forecast at +15, +30, +45 and +60 minutes, so it needs no extra route searches.
- Voice. The phone records a short WAV and sends it with the rider's position and current route. Gemini returns structured JSON with an action, settings and a reply. If Gemini fails, a simple command parser still handles phrases like "quieter please". ElevenLabs turns the turn-by-turn directions into audio, and the browser voice takes over if it is unavailable.
- Ride log. Tiger Data (TimescaleDB on Postgres) holds rides, GPS points, route events and an hourly speed summary per street. Points are matched to the nearest street. Raw points are kept for 30 days, and the hourly averages stay after that.
- App. The backend is FastAPI in Python. The frontend is Next.js with a Leaflet map, installable as a PWA, in Everforest light and dark themes. Everything runs as one Vercel project, and every push to
maindeploys. A/debugpage shows the cost of every road, the A* search, and a comparison with the shortest and Google routes.
Challenges we ran into
- Mic and phones. Recording audio in the browser behaves differently on iPhone and Android, so we added a debug log for the mic and converted everything to 16 kHz WAV before sending it to Gemini.
- Services that fail. Gemini, ElevenLabs, the weather API and the database can all be slow or down. We made each one optional with a fallback, so the app keeps routing.
- Wind barely matters. The research table says wind changes cycling speed by under 2%. We expected it to reshape routes. It only changes the ETA, so we kept it small.
- Data takes time to collect. Learned speeds need several real GPS points per street. With a short hackathon, most streets still use the speed model. Simulated rides are stored with a flag and never train anything.
- Missing roads. Cornmarket and Queen Street are no-cycling in OpenStreetMap, so they are not in the graph at all.
- Fitting a map and controls on a phone while keeping every button at least 48 px to tap.
Accomplishments that we're proud of
- A hand-written A* that we can explain and trace line by line on
/debug. - A route that visibly changes between day, night, rush hour and rain.
- A full loop: you speak, Gemini understands and the route appears, ElevenLabs speaks the directions, and your ride makes the next one better.
- A live, installable app with automated backend and frontend tests running on every push.
What we learned
- Time can be a cost in a routing graph just as distance is, and a few multipliers are enough to change the route in a way you can see.
- Measured research data is more useful than a guess. It also told us which ideas not to oversell, like wind.
- A language model that takes audio directly and returns structured JSON is simpler than chaining speech-to-text and a separate parser.
- Every outside service needs a fallback if you want a demo that survives bad Wi-Fi.
- Time-series data fits a ride log well, and a continuous aggregate keeps the useful part after the raw points expire.
What's next for OxRide
- A "leave later" picker and a departure chart (the API already accepts a departure time).
- An elevation chart for the route.
- A suffer score for hard rides.
- Keeping the screen awake while riding.
- More cities, by running the graph build for a new area.
- More real rides, so more streets use measured speeds.
Built with
Python, FastAPI, OpenStreetMap and osmnx, OpenTopoData, Open-Meteo, Gemini API, ElevenLabs, Tiger Data (TimescaleDB), Next.js, React, Leaflet, Vercel
Built With
- fastapi
- next.js
- postgresql
- python


Log in or sign up for Devpost to join the conversation.