Overseer — Local Intrusion Detection
Inspiration
Our team wanted to build something a security-conscious person could actually run on their own laptop and trust — not another cloud dashboard that phones home with your data. We started as a Chrome extension that flagged suspicious in-browser behavior (cross-origin form submissions, hidden iframes, clipboard access). It worked, but we quickly hit a wall: a browser extension can only ever see what happens inside a tab. It has zero visibility into what's connecting to the network from other apps, or what just got plugged into a USB port. If we wanted to answer "is my laptop compromised right now," we needed to leave the browser sandbox entirely and watch the OS itself.
What it does
Overseer is a local background daemon that polls real OS-level signals — network connections, running processes, and USB devices — and scores them against a transparent, additive rule engine. Every point in a risk score traces back to a named rule; there's no black-box model deciding whether you're compromised.
It watches for things like a process listening on a port with a history of malware/backdoor use, unsigned processes making network connections, binaries launched from staging directories like /tmp or ~/Downloads, beaconing patterns (many new destinations in quick succession), and newly attached USB devices — classified and scored by type, with network-adapter USB devices (a classic MITM implant vector) scored highest.
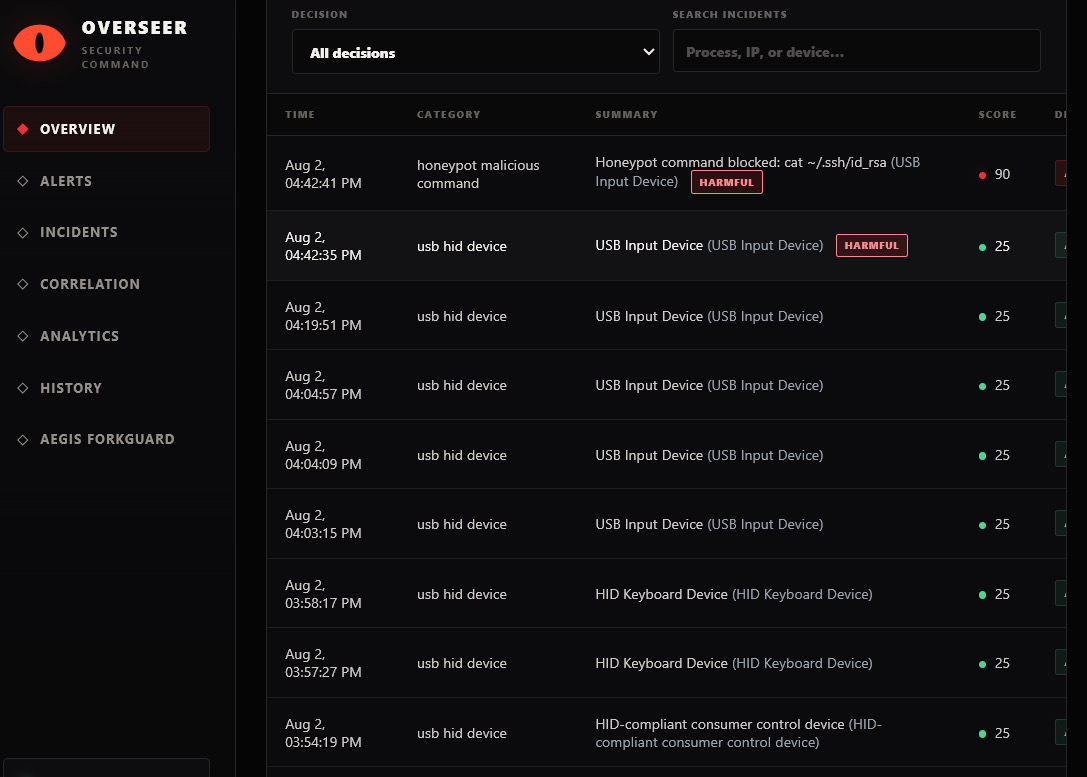
Every incident lands in a local command-center dashboard (localhost:4100, loopback-only) with a live risk score, incident timeline, and filters by category/severity/decision. Remediation (killing a process, ejecting a USB drive) is real and verified — but never automatic. Nothing happens without an explicit click in the dashboard.
How we built it
The agent is a single Node/TypeScript process. On macOS, network-monitor.ts polls lsof -i -P -n every 5 seconds and diffs against the last snapshot; usb-monitor.ts polls system_profiler SPUSBDataType every 3 seconds. process-info.ts cross-references code-signing status (codesign -dv) and executable path for each connection. Everything funnels into risk/engine.ts, which applies eight additive rules and clamps a score into a three-tier decision: allow (0–39), warn + log (40–69), action available (70–100). On Windows, pnputil and PowerShell DriveInfo handle USB discovery, newly mounted storage triggers a Microsoft Defender custom scan, and the agent runs from the system tray via a scheduled task.
Remediation is gated by isSafeToTerminate, which refuses to touch root-owned or known-critical system processes. The dashboard is a single client-side bundle built with esbuild and served by an Express backend, refreshing every five seconds. We split the work three ways: one person on OS integration and monitors, one on the risk engine and remediation safety logic, one on the dashboard, and API integration
Challenges we ran into
- The pivot itself. Rebuilding from a browser extension to a native OS daemon wasn't a refactor — it was a different technical domain (process introspection, code-signing checks, platform-specific APIs) with almost nothing reusable except the rule-engine philosophy.
- A real false positive. While dogfooding the live daemon against our own machine's traffic, a legitimate Cloudflare
workerdprocess got flagged because an early version of the suspicious-path rule matched any dot-prefixed directory — and our own project happened to live under a dot-directory. We had to narrow the rule to genuine staging locations instead of a naive pattern match. - Windows long-path failures. Installing the Jac environment inside a deeply nested repo path blew past Windows' path length limits; we relocated it to a short
%LOCALAPPDATA%path to fix it. - Deciding what not to build. We deliberately kept an unprivileged permission boundary (no root, no full network payload capture, no keystroke logging) even though it limits visibility — because a laptop security tool that demands root and reads everything is a worse tradeoff than one that's honest about its limits.
What we learned
Real intrusion signals live at the OS level, not the browser level — and the two require completely different tooling. We also learned the value of an additive, fully transparent scoring model during a live demo: when the false positive showed up, we could point at the exact rule and line that fired instead of debugging a black box under time pressure. Verifying remediation against disposable test processes (rather than trusting it blindly) also surfaced edge cases in process-path resolution we wouldn't have caught from unit tests alone.
What's next
File-system integrity monitoring (LaunchAgents/LaunchDaemons, login items), event-driven USB monitoring via IOKit instead of polling, a signed allowlist to cut down false-positive review over time, pf firewall integration for real network-layer blocking, and full Windows network telemetry via Get-NetTCPConnection/ETW.
Built With
- claude
- codex
- debugging
- github
- teamwork


Log in or sign up for Devpost to join the conversation.