-
-
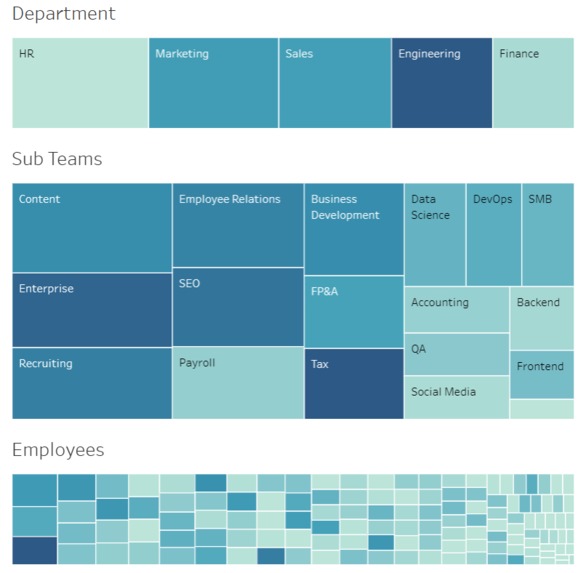
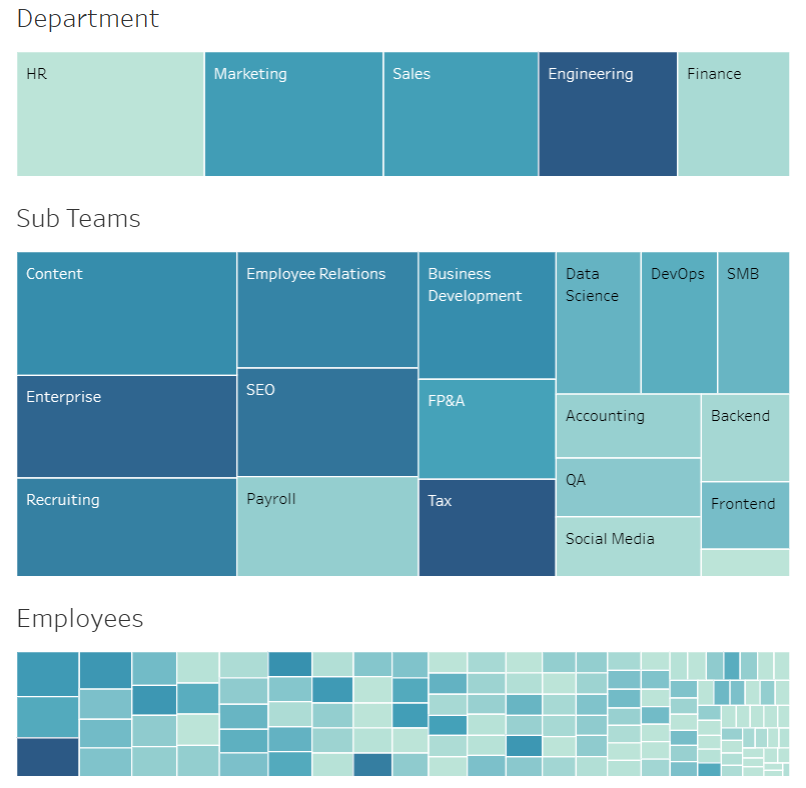
Dasboard
-
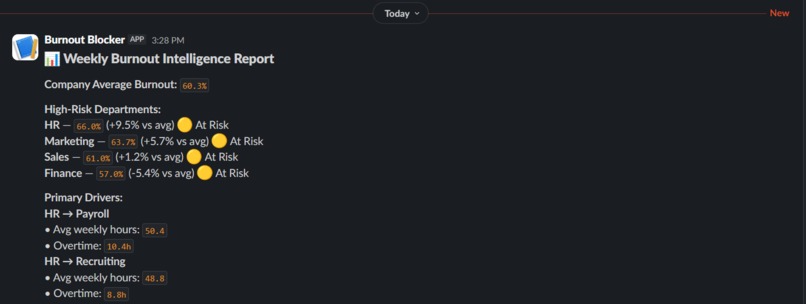
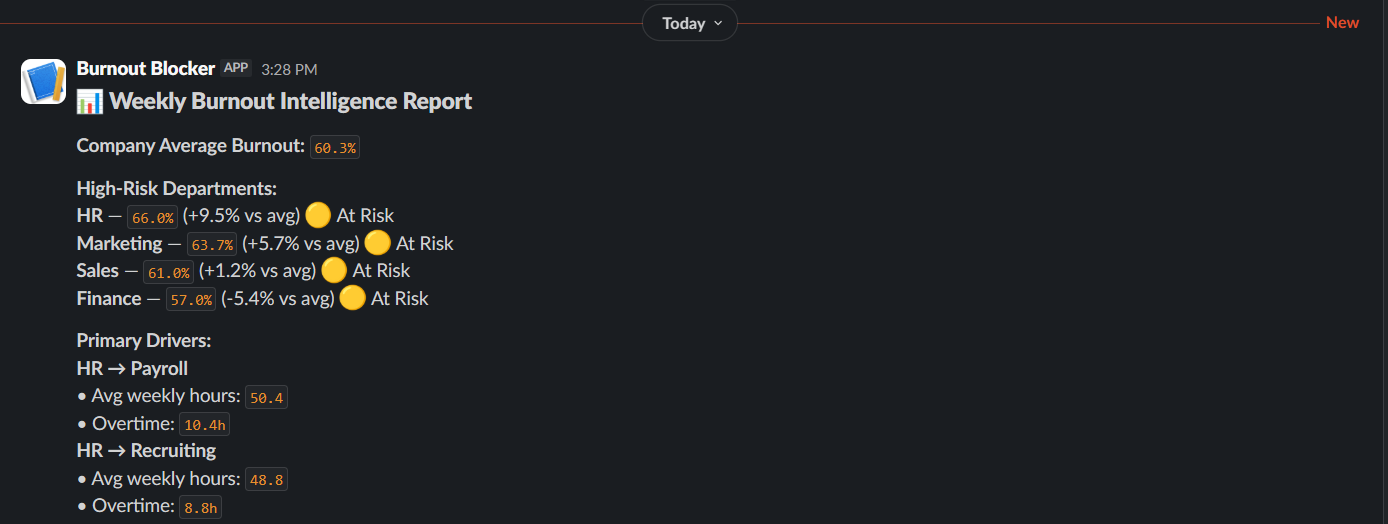
Slack Alert
Inspiration
Burnout seldom occurs suddenly. It typically builds in organizations, invisibly accumulating in the areas where the most value is being added. We were inspired by the fact that a common way that organizations identify cases of burnout is after performance has dipped or people have left. Overload Radar was designed to help this transition from a reactive process that attempts to fix the problem after the fact.
What it does
Overload Radar is a workforce intelligence system that uses agents to identify a risk of overload around the most valuable members of an organization. Rather than treating each workload the same, it looks at the value contribution and identifies the top-performing groups or individuals who may be overloaded. Delivering the insights directly to Slack, with explanations of the risk rationale and its sources through Tableau-risk analytic explanations, the system is ready to make decisions.
How we built it
The project follows a realistic, production-inspired architecture:
- Data Layer A structured dataset capturing workload and performance telemetry such as total weekly hours, overtime, delivery pressure, and value contribution.
- Agent Layer (Python) A lightweight agent derives an explainable burnout signal from work patterns using the following formula:
Burnout Score=(Total Weekly Hours)+3×(Overtime Hours)−2×(Average Days Early)
The agent aggregates results by department and sub-team, prioritizes high-value contributors, and generates a single intelligence report instead of noisy alerts.
- Visualization Layer (Tableau Public) Interactive dashboards enable drill-down from department to sub-team and individual context, providing visual evidence behind each insight.
- Action Layer (Slack) A weekly intelligence report is delivered to Slack with a direct link to the Tableau dashboard for transparency and informed decision-making.
Challenges we ran into
- Working within Tableau Public limitations around native hierarchy drill-down and dynamic layout control
- Designing a burnout signal that is explainable, not a black-box model
- Preventing alert fatigue by consolidating insights into a single actionable report
- Balancing transparency with privacy when handling individual-level workload signals
Accomplishments that we're proud of
- Built a value-first overload detection system, not a generic workload monitor
- Designed an end-to-end pipeline from telemetry → insight → action
- Delivered explainable, evidence-backed Slack intelligence reports
- Aligned the solution with real organizational decision-making workflows
What we learned
- Burnout detection is as much a product and ethics challenge as a technical one
- Explainability and context matter more than model complexity
- Leaders need evidence and recommendations, not just alerts
- Simple, well-designed agents can deliver real organizational value
What's next for Overload Radar
- Week-over-week trend analysis to detect accelerating overload risk
- Confidence levels and severity scoring for alerts
- Deep-linked Tableau dashboards with pre-filtered context
- Integration with calendar and project tools for richer workload signals
- Privacy-preserving aggregation for individual risk insights


Log in or sign up for Devpost to join the conversation.