Inspiration
In July 2016, six and a half inches of rain fell on Ellicott City, Maryland in about two hours. Main Street became a river. Two years later it happened again. Both were called thousand-year storms; between them they killed three people.
What struck me was that it wasn't random. Ellicott City sits where two steep branches of the Tiber converge, and the only flat ground at the bottom of that funnel is the street itself. The terrain had been saying this for centuries.
Flood maps are mostly regulatory products — coarse, slow to update, drawn around rivers. They answer "is this property in a flood zone?" They don't answer the question a neighbourhood actually asks after a bad storm: where did all that water come from, and what would it take to stop it?
What it does
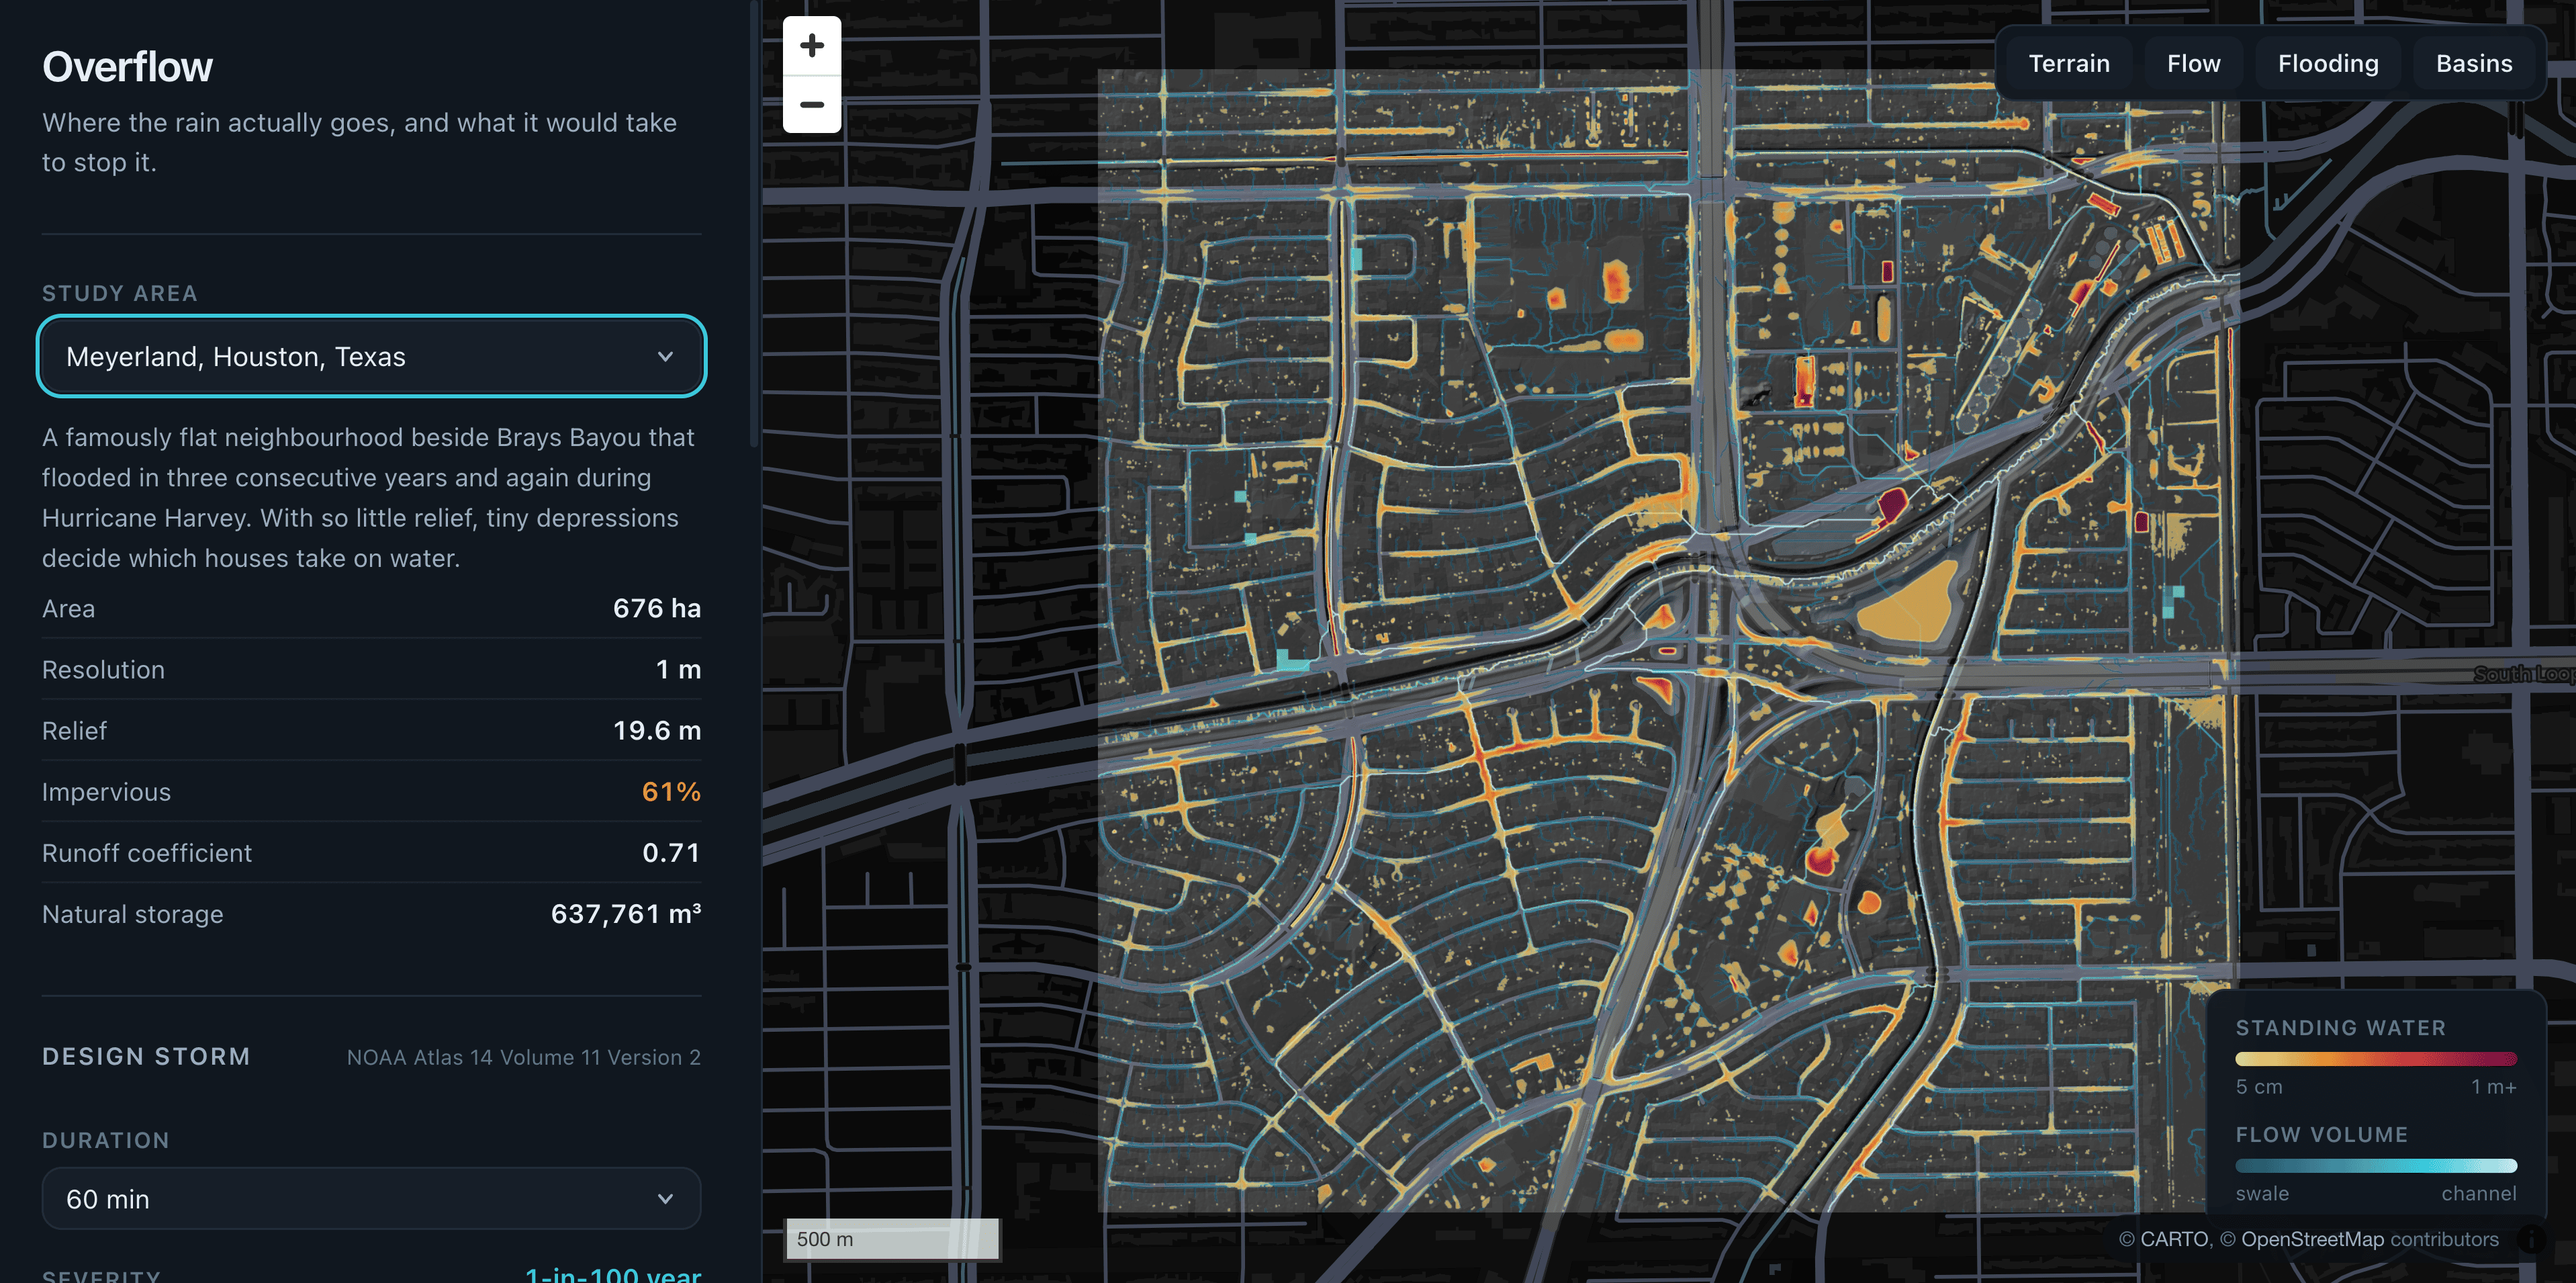
Overflow models where rainwater physically goes during a storm of a severity you choose.
It pulls 1-metre bare-earth LiDAR — 5.8 million elevation cells for a single 2.4 km neighbourhood — and runs real terrain hydrology over it. Land cover and imperviousness decide how much rain runs off instead of soaking in. Rainfall comes from NOAA Atlas 14, so "the 100-year one-hour storm" is the same number a county engineer would size a culvert against.
Then it does the second half: given that flood map, it greedily sites rain gardens to hold back the runoff causing the most damage per dollar — and reports honestly how much difference they make.
Four study areas, each with documented destructive flooding: Ellicott City, Meyerland in Houston, the Lower Ninth Ward, and Boulder.
Everything on screen is computed from public data at the actual coordinates. Nothing is illustrative.
How I built it
Python and numpy for the model, FastAPI to serve it, MapLibre for the interface.
The three hydrology algorithms — Priority-Flood, D8, and flow accumulation — are implemented directly rather than imported from a GIS library, because the intermediate products are the interesting part. Priority-Flood normally exists to erase pits in a DEM. But the quantity it discards, filled - original, is exactly how deep water can stand on each cell.
The flood map falls out of the algorithm that usually throws it away.
The hot loops are numba-compiled. Priority-Flood touches 5.76M cells through a binary heap, hand-rolled on flat arrays because numba has no heapq. It runs at roughly 3 million cells per second, so a neighbourhood analyses in two seconds and a storm re-runs in 100 milliseconds — fast enough to drive a slider.
Siting is a greedy submodular maximisation. Each garden is worth less than the last, because gardens on the same flow path compete for the same water. That makes the objective monotone submodular, and greedy provably within \(1 - 1/e\) (~63%) of optimal — no polynomial-time algorithm does better unless P = NP. So the cheap algorithm is also very nearly the best one available.
Data is USGS 3DEP, NLCD 2021 via MRLC's WCS, and NOAA Atlas 14. All public, no API keys. No GDAL either — 3DEP's float32 GeoTIFFs are read with Pillow, which removes the most painful dependency in geospatial Python.
Challenges I ran into
Rain gardens made the flooding worse. Adding storage increased reported flooded area. Facility footprints were merging with adjacent natural depressions during the pooling stage, which re-spread the captured water across the very surface they were built to protect. Natural and engineered storage now stay separate, and a regression test asserts that adding storage can never increase flooding.
The optimiser stopped doing spatial reasoning. It kept picking the same land class everywhere. The objective saturated at each basin's own volume, so every viable site scored identically and construction cost became the only signal — it had quietly stopped siting infrastructure and started ranking land by price. Weighting capture by the severity of the flooding it feeds fixed it.
A 230 m³ basin could only capture 13 m³. I modelled each facility as per-cell storage, but D8 routes water along a path one cell wide, so a swale crossing a 24 m facility only ever touches about 30 of its 576 cells. 95% of the storage was unreachable. Facilities are now a single shared pool.
Water stacked in columns instead of finding a level. Per-cell capacity let one square metre at the bottom of a five-metre pit swallow five cubic metres and read as five metres deep — which pinned maximum depth at exactly 5.02 m for every storm from a drizzle to a thousand-year event. A second stage now solves for the water level and lays each basin out flat.
There was a quieter one too: Web Mercator's horizontal unit is only a metre at the equator. Uncorrected, every slope at Ellicott City's latitude would have been inflated by 29% — and the model would have lied convincingly.
Accomplishments that I'm proud of
The hydrology core has 27 tests written against hand-derived geometry rather than against its own previous output — nested depressions, pits on slopes, diagonal distance weighting, and mass conservation, which balances exactly: 5,760,000 cells in, 5,760,000 routed to outlets.
And the two-site contrast, which I didn't design and only found by running it. Meyerland generates 2.4× more runoff per inch of rain than Ellicott City and is too flat to shed it. Ellicott generates less but funnels all of it through one street. 2.4% of Ellicott ponds; 19% of Meyerland does. Same tool, same storm, two completely different disasters — one a velocity flood, one a bathtub.
What I learned
That my own model could tell me something I didn't want to hear.
Twelve rain gardens — 2,765 m³ of storage, $400,000 — capture 2,256 m³ of real runoff and reduce hazardous flooding in a 100-year storm by 1.2%.
I spent a long time assuming that was a bug. It isn't. The storm produces 131,000 m³ of runoff and the gardens hold under 2% of it. Distributed green infrastructure does not stop an extreme storm. It does far more against the small frequent storms that cause most cumulative damage — exactly what the stormwater literature has said for years, and which I only actually believed once I'd built something that measured it.
I could have tuned that number upward. Shipping a tool that flatters its own intervention seemed like the wrong lesson to take from a hackathon about the environment.
What's next for Overflow
Storm drains are the biggest missing piece. No public dataset describes them, so the model assumes the surface does all the work — defensible for extreme events where drains are already at capacity, wrong for ordinary ones. Municipal GIS departments often have the data on request.
Beyond that: velocity, which needs a proper shallow-water solver and would let the model say when the peak arrives rather than just how deep it gets; building footprints, so it can count structures at risk instead of hectares; and letting anyone drop a pin anywhere instead of choosing from four prepared study areas.

Log in or sign up for Devpost to join the conversation.