-
-
Overfield Logo
-
-
-
-
-
-
Inspiration
This project started with Ishaan, who is Punjabi and whose grandparents lived in a rural part of India where almost everyone around them farmed. Growing up, he heard about the problems those farmers dealt with, like harvests that came at the wrong time and help that showed up late.
The problem we focused on comes from Punjab. There’s a window of only about two weeks between the rice harvest and wheat sowing, and the rice straw has to be cleared before the wheat can go in. The machines that clear it are scarce and usually arrive late, so farmers burn their fields because nothing else fits in the window.
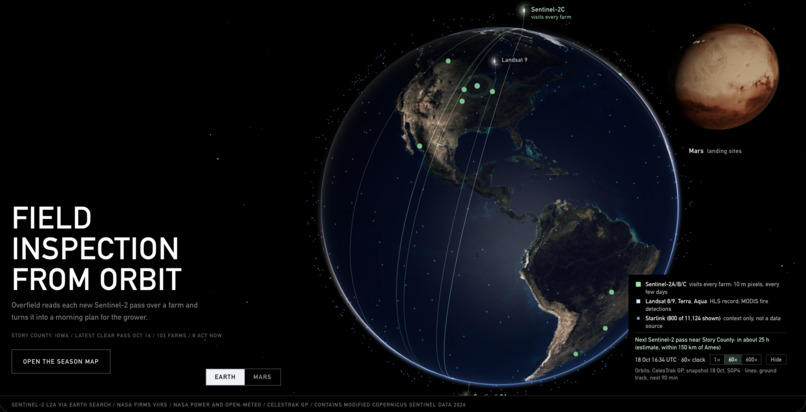
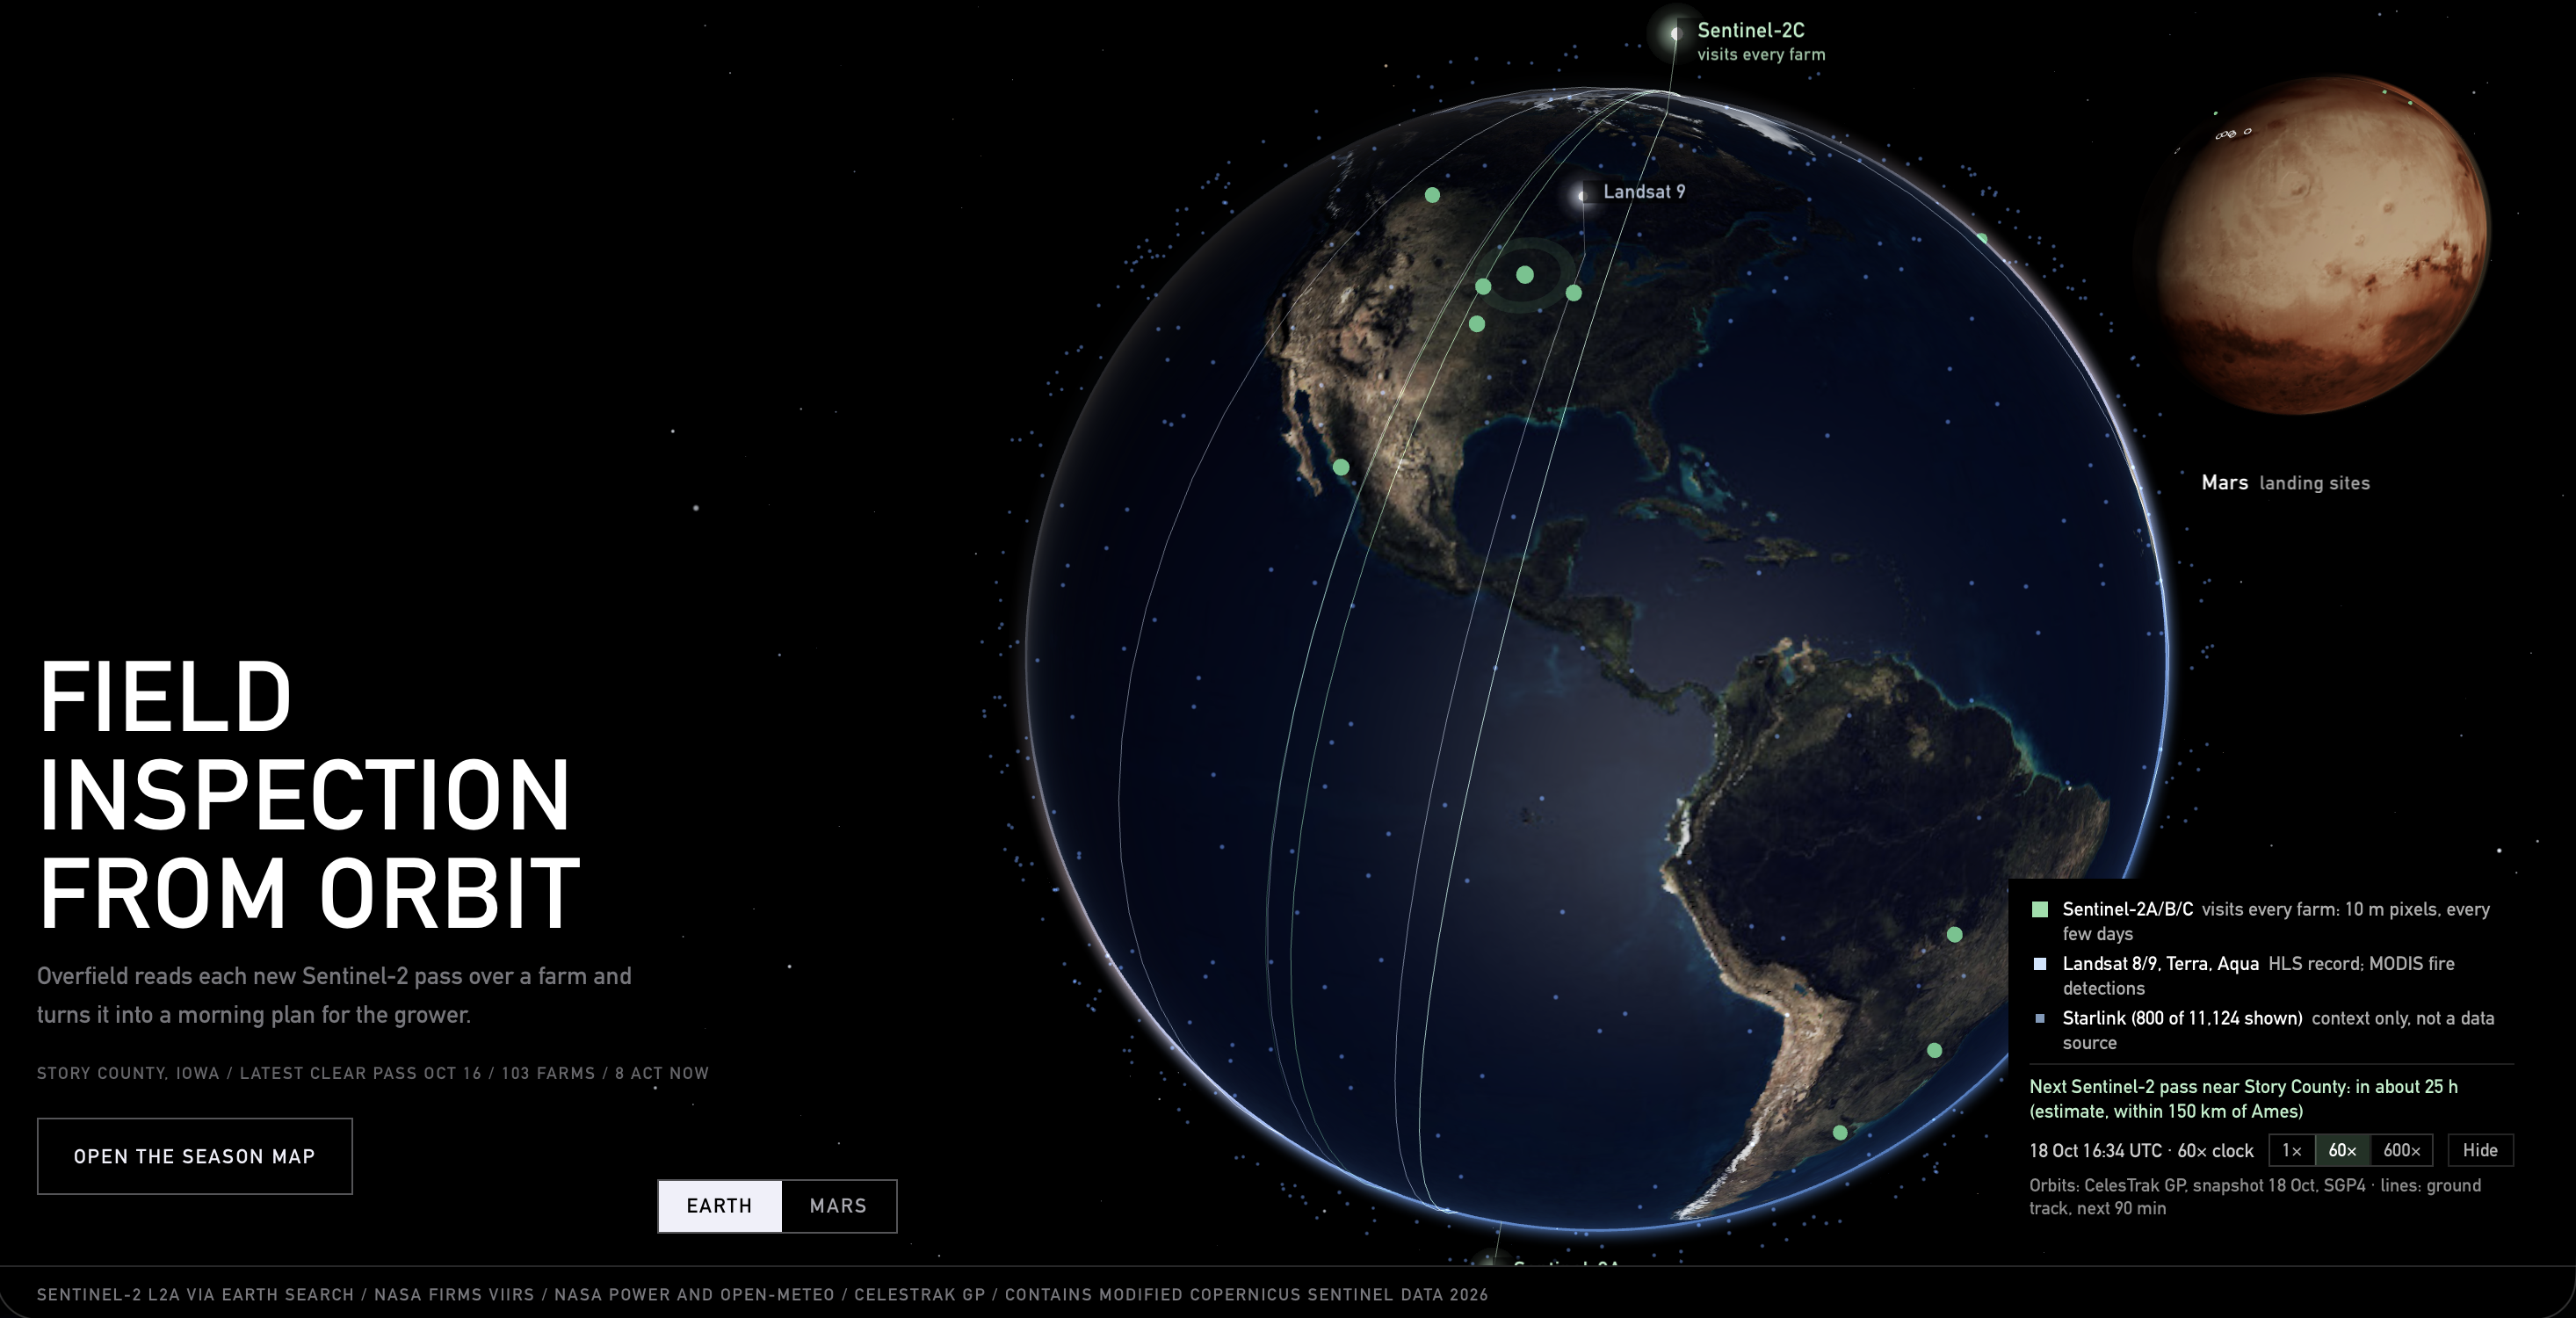
Satellites already count these fires every season. The free imagery we used can also show which fields were just cut and which ones will be cut next. With that, the straw-clearing machines can be sent to a field before anyone has to burn it. Once you’re checking every field every few days, you can also tell a farmer when their crop is ready to harvest and warn them before rain. You can spot a flooded corner of a field or a patch under stress as well.
What it does
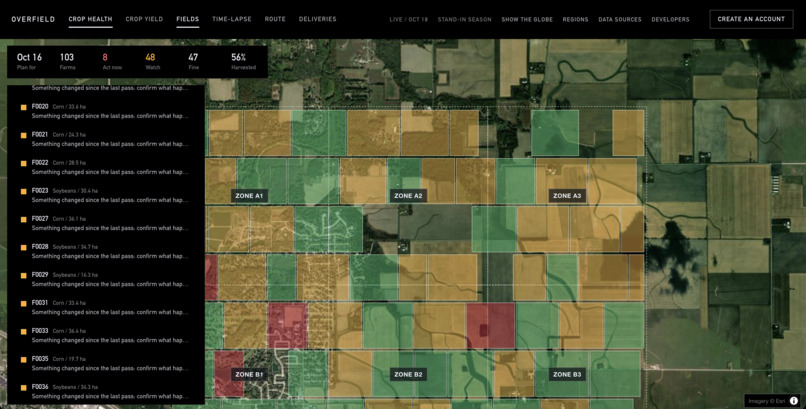
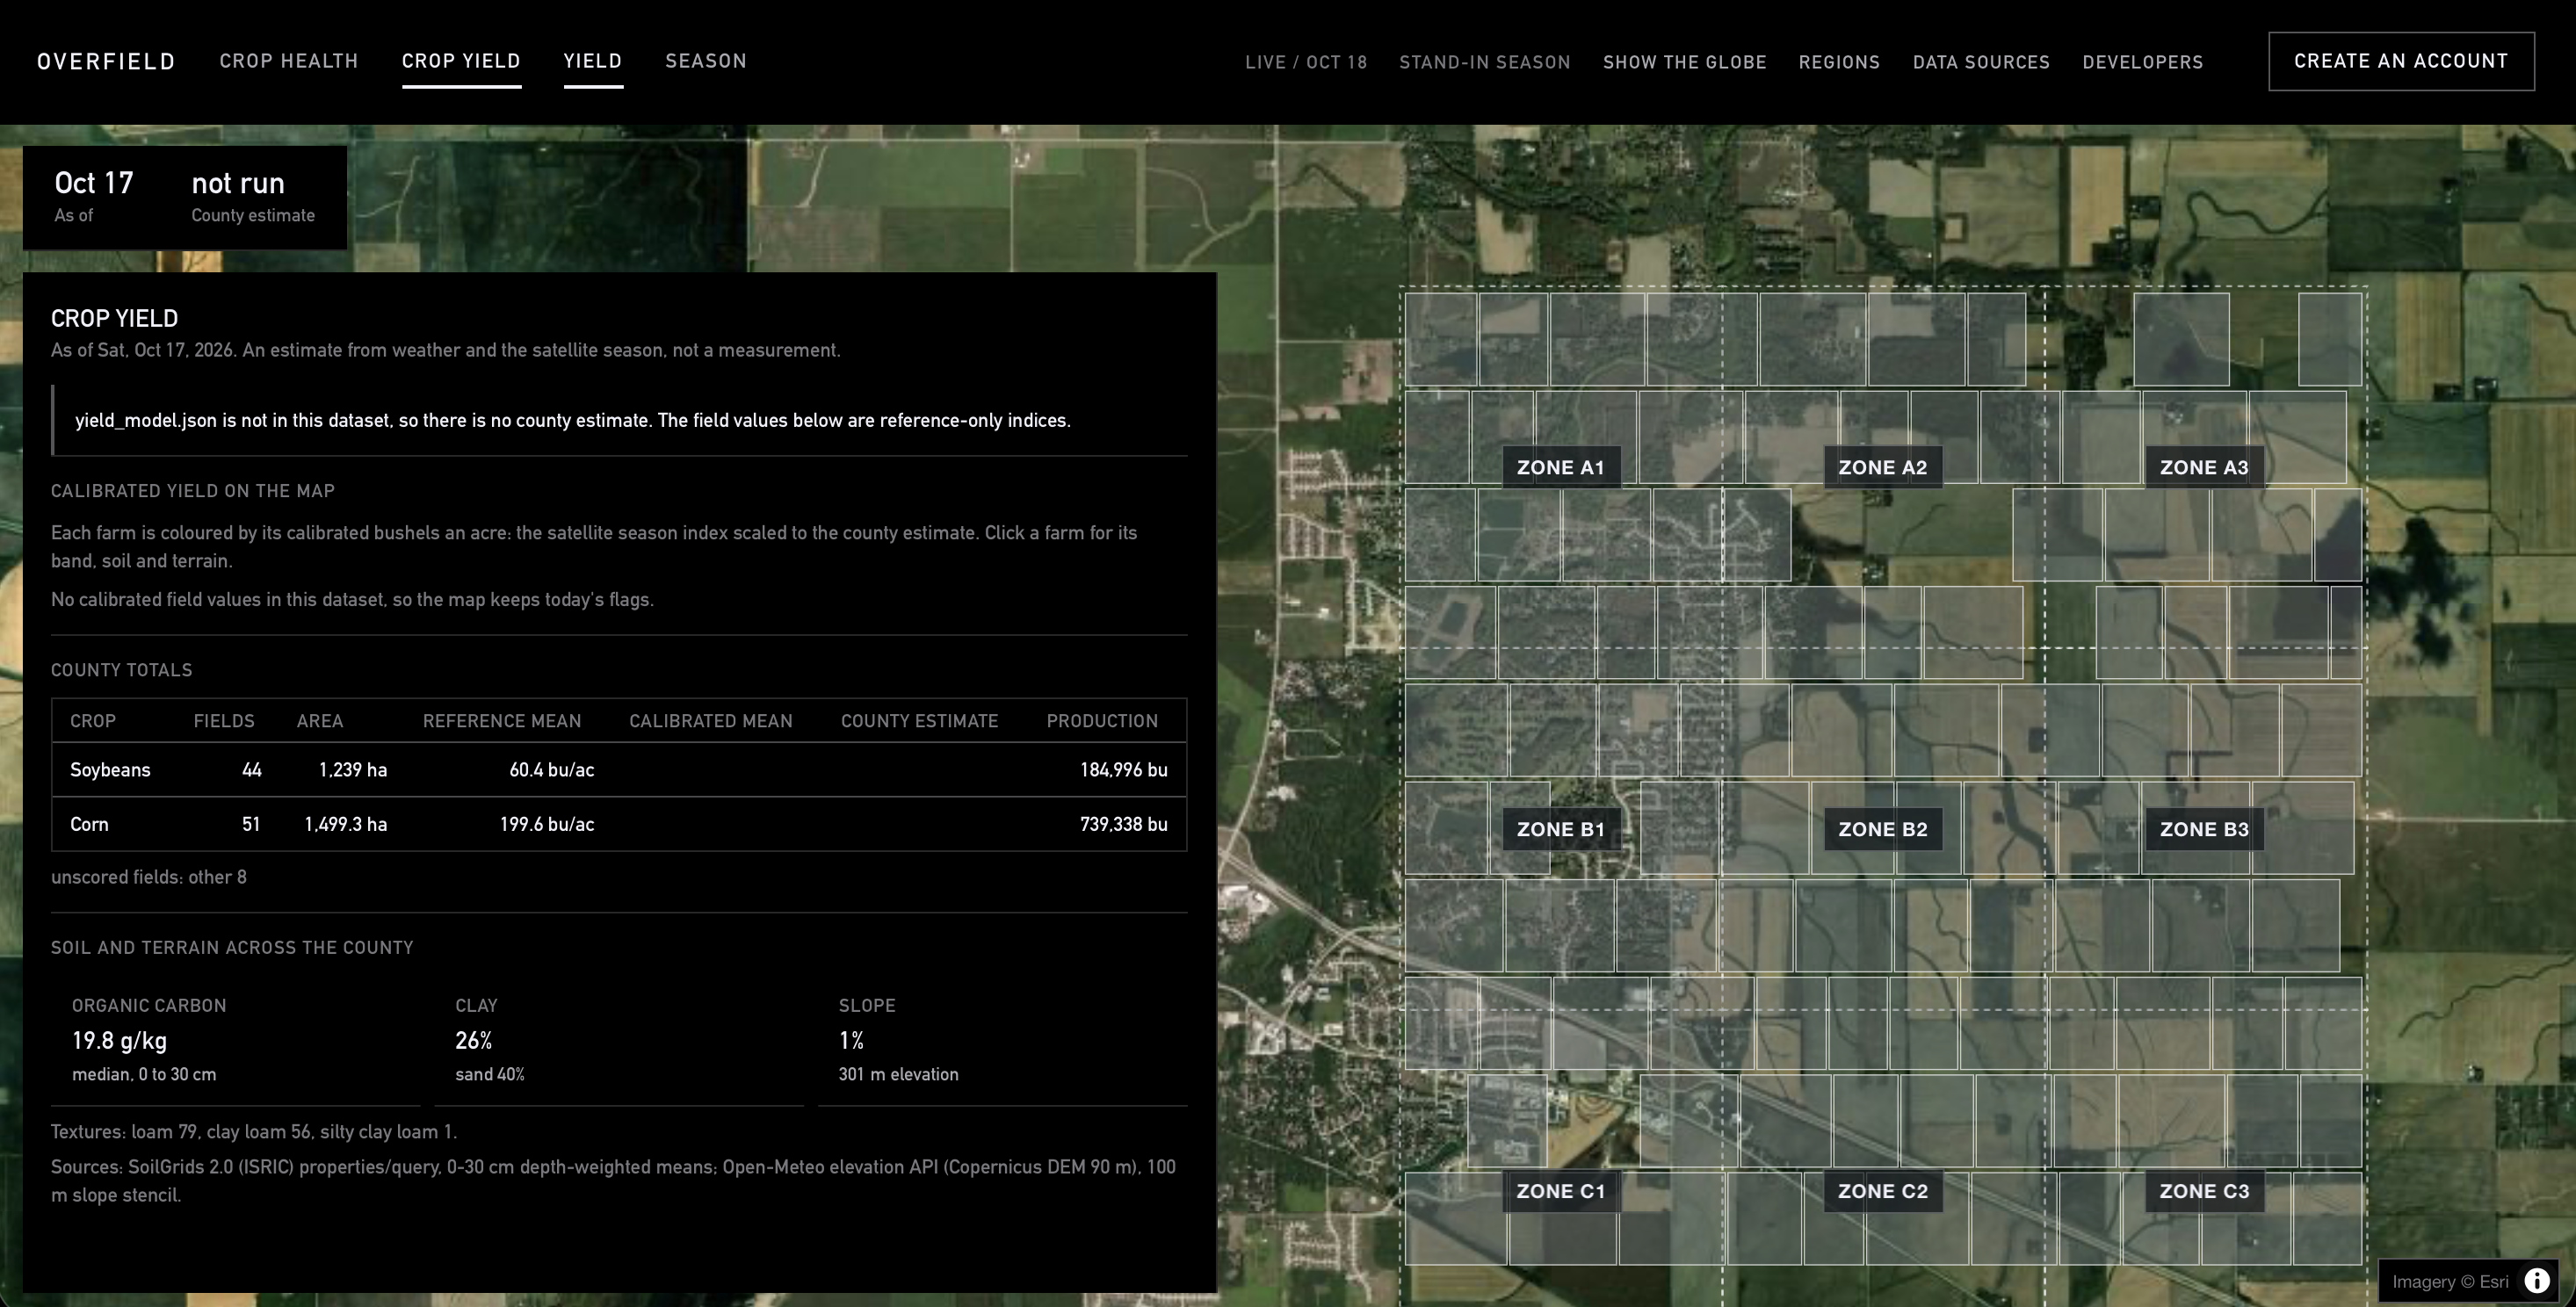
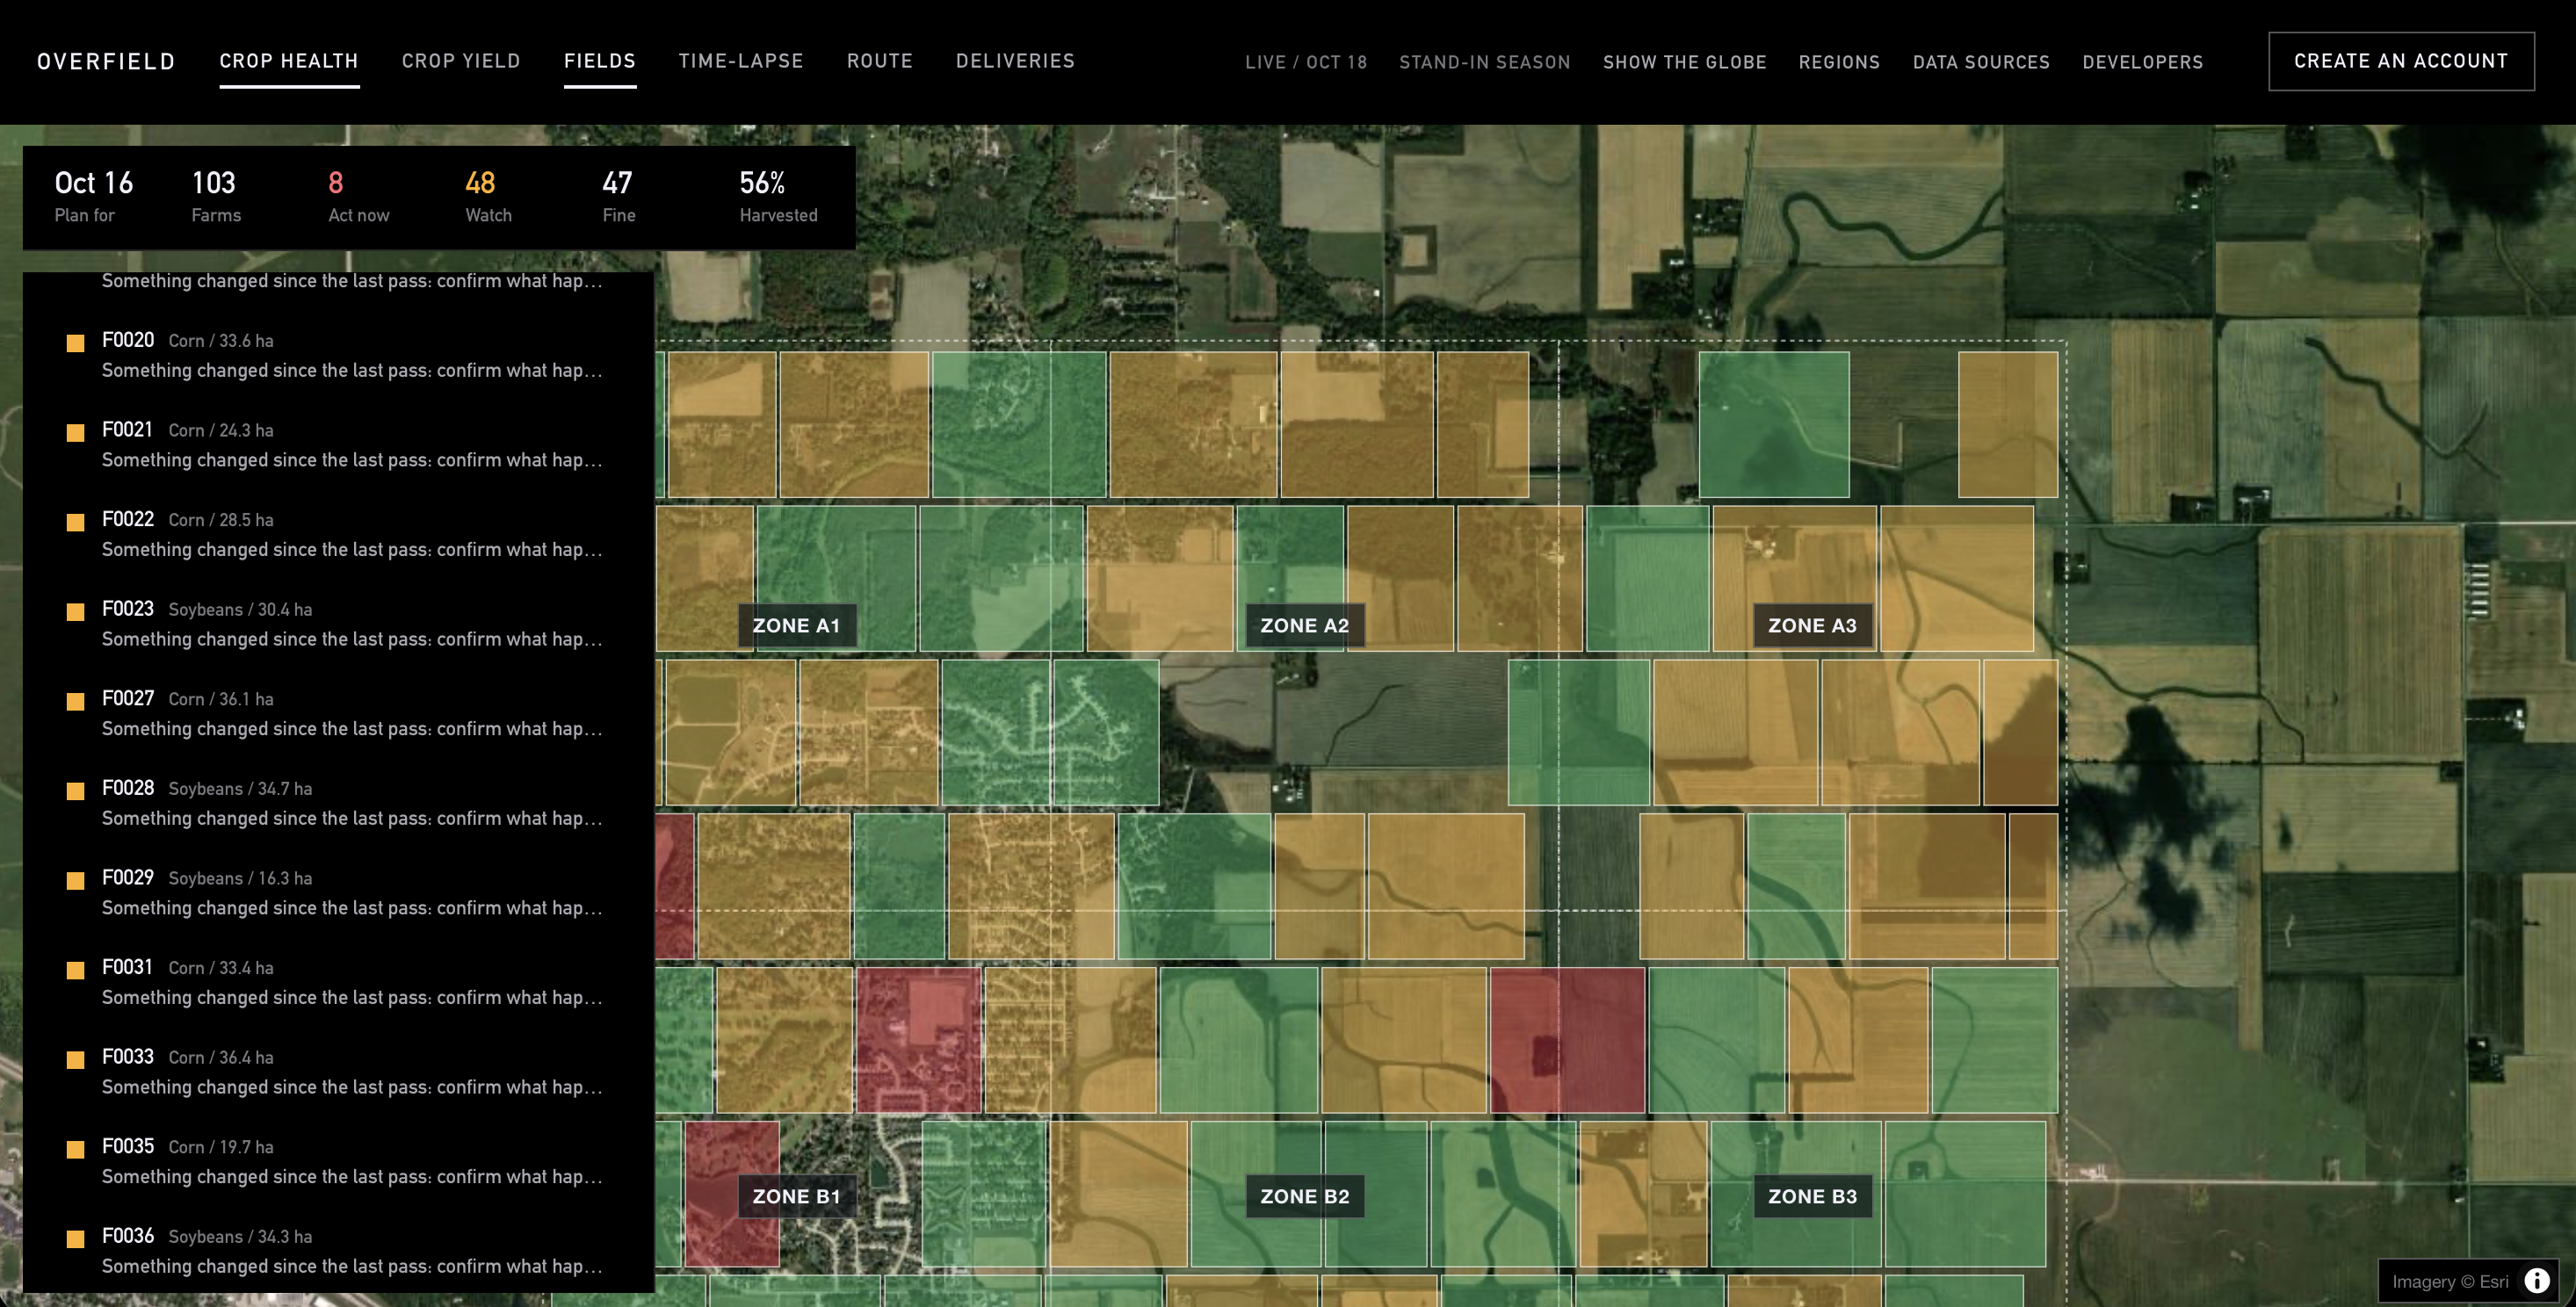
Overfield is an autonomous field inspector for small family farms. Every time the satellite gets a clear view, Overfield checks each field for eight things. It looks at whether the crop is ready to harvest and whether the harvest can happen before incoming rain or frost. It also checks whether the new crop has established, and it looks for burn scars, active fires, flooding, crop stress, and any other visible change.
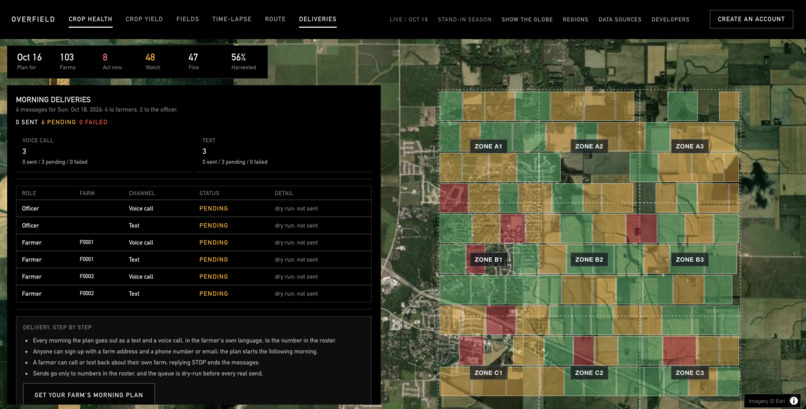
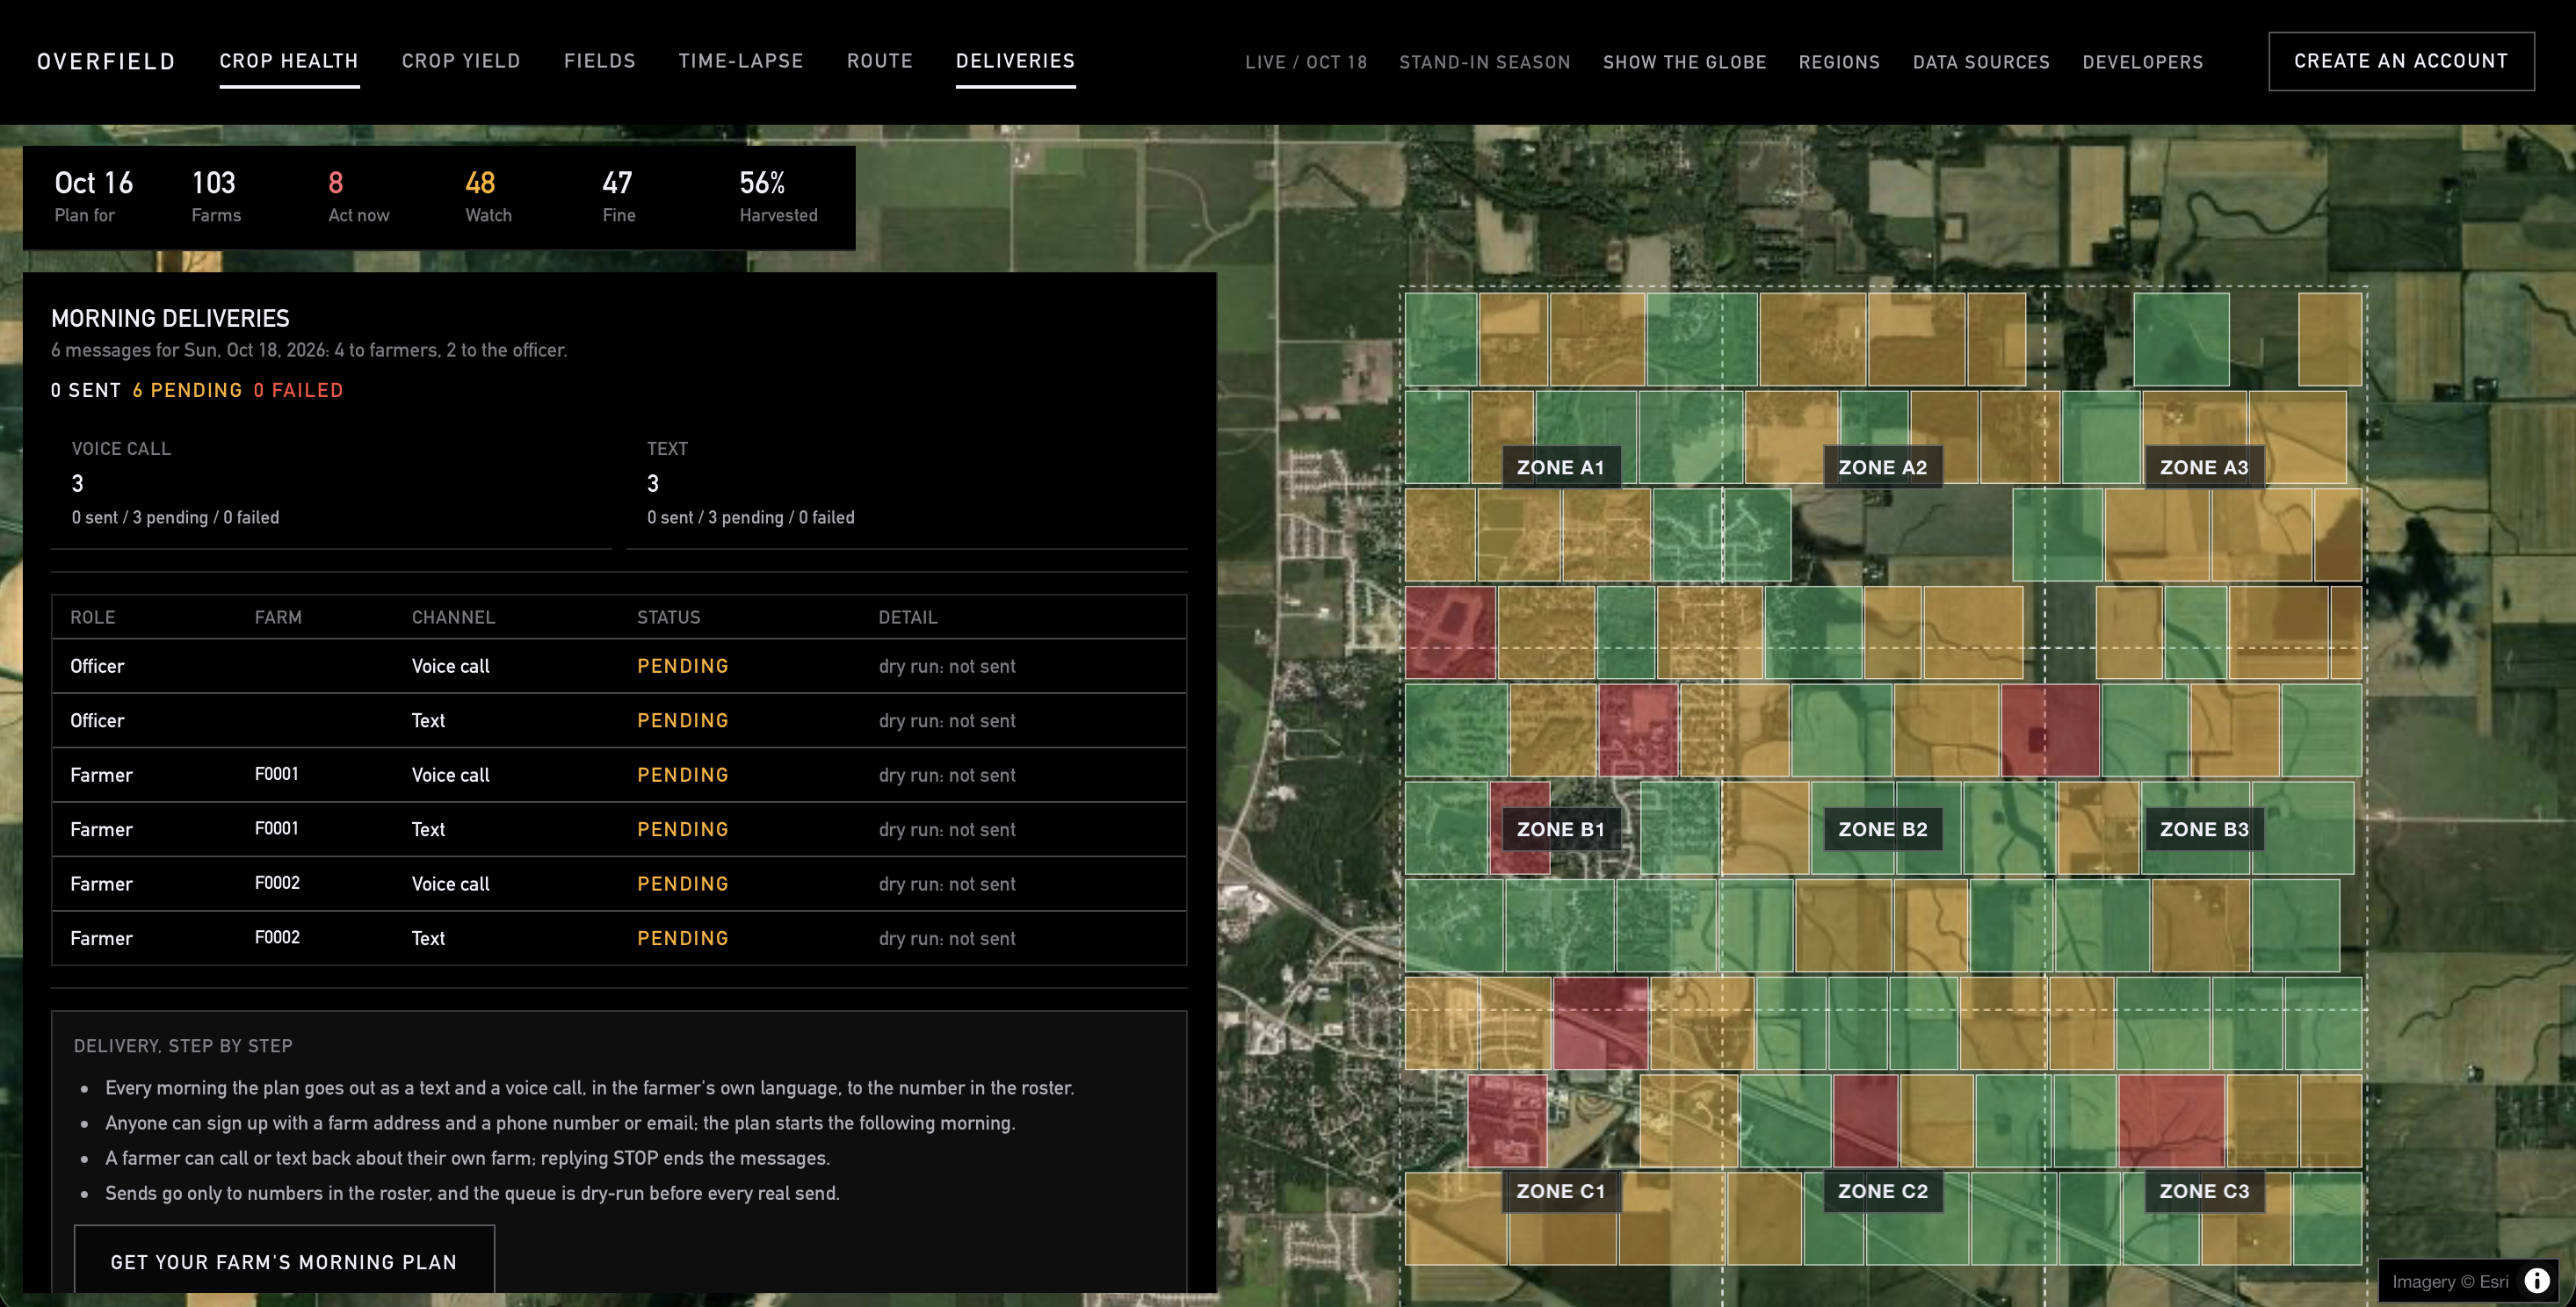
Each morning, every farm gets a plan built from those checks, with a short list of what to do that day and the reason for each step. The farmer gets the plan as a phone call and a text in their own language. If they have a question, they can call back and ask about their farm.
How we built it
We split the project into three parts, one per person, and agreed early on the format each part would pass to the next.
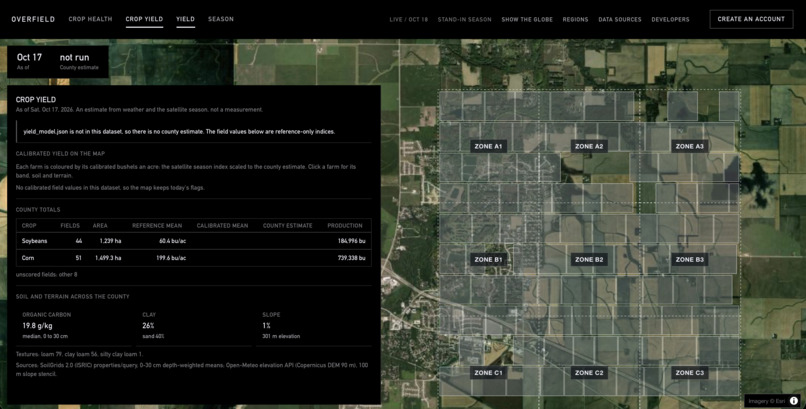
Niranjan built the data pipeline. It pulls Sentinel-2 satellite imagery from the free Earth Search catalog, weather from NASA POWER and Open-Meteo, and fire detections from NASA FIRMS. From there it turns everything into a greenness and burn-index time series for every field, so each field has a running record of how it changed over the season.
Ishaan built the intelligence. The main piece is a harvest model that learns how long fields in the region take to go from peak greenness to harvest. It learns this from the fields that have already been harvested, then uses that timing to predict when the rest will be ready. He also built the decision layer, which runs the eight checks, writes each farm’s plan, and orders the extension officer’s route for the day. His weather model tracks degree days, which measure how much heat the crop has received, and grain dry-down, which is how quickly the grain dries in the field, and it uses both to find the best window to run the combine. The morning delivery he built sends the plans out through Grok Voice calls and Photon texts.
Srikar built the vision and the map. He used Perceptron to look at each field’s images across the season in order, like a time-lapse, and flag floods, stress and change field by field. The map is drawn straight from the finished plan files.
Challenges we ran into
The main problem was resolution, because each satellite pixel covers a fixed patch of ground and a small field only gets a handful of them. The pixels along a field’s edges also pick up whatever is next to it, which makes small fields look blurry and their readings less accurate.
We couldn’t get sharper imagery, so instead of trusting individual pixels we changed how we measured. We kept only the clearest passes by dropping any pixel the satellite flagged as cloud or shadow, and checked what we saw against other open data like fire detections and rainfall. Then we measured each field as a whole by averaging every pixel inside its boundary.
We also stopped judging each field on its own and started comparing it to the fields around it. If a whole village is browning together, that’s just the season. However, if one field is browning faster than its neighbors, that field is worth a visit.
Perceptron’s time-lapse view helped in cases where a single image wasn’t clear enough. Looking at a field’s images across the whole season let us see when and where it changed.
What we learned
Going in, we didn’t realize how much useful data is already public. Satellite imagery from ESA and NASA, fire detections, rainfall records and weather forecasts are all free. The hard part was combining them and learning where each one stops being reliable.
We also learned that we couldn’t assume a general crop yearly timeline. Harvest timing has to be learned from the fields themselves, and the fields that have already been harvested show patterns where we could extrapolate data for similar farms in the area.
Above all, we learned how many decisions farmers make on their own with almost no information. That’s why Overfield tells a farmer what to do today in a phone call and a text, because in world of overwhelming information, sometimes simplicity is what's most helpful.
Built With
- cursor
- earth-search
- esri-world-imagery
- github-actions
- grok
- javascript
- jsonschema
- maplibre-gl
- nasa-firms
- nasa-power
- numpy
- odc-stac
- open-meteo
- perceptron
- photon
- python
- rasterio
- scikit-image
- scipy
- sentinel-2
- shapely
- stac
- twilio
- vite
- xai


Log in or sign up for Devpost to join the conversation.