-
-
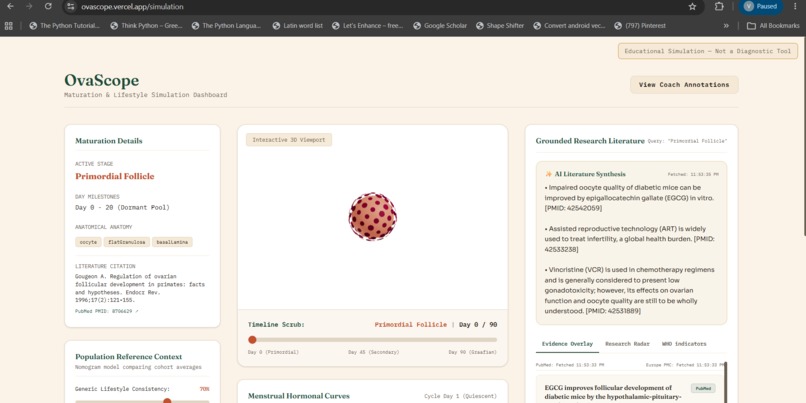
Simulation (first half)
-
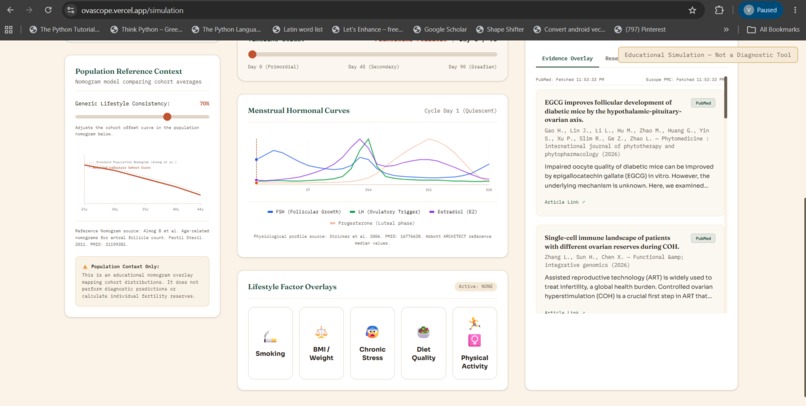
Simulation (second half)
-

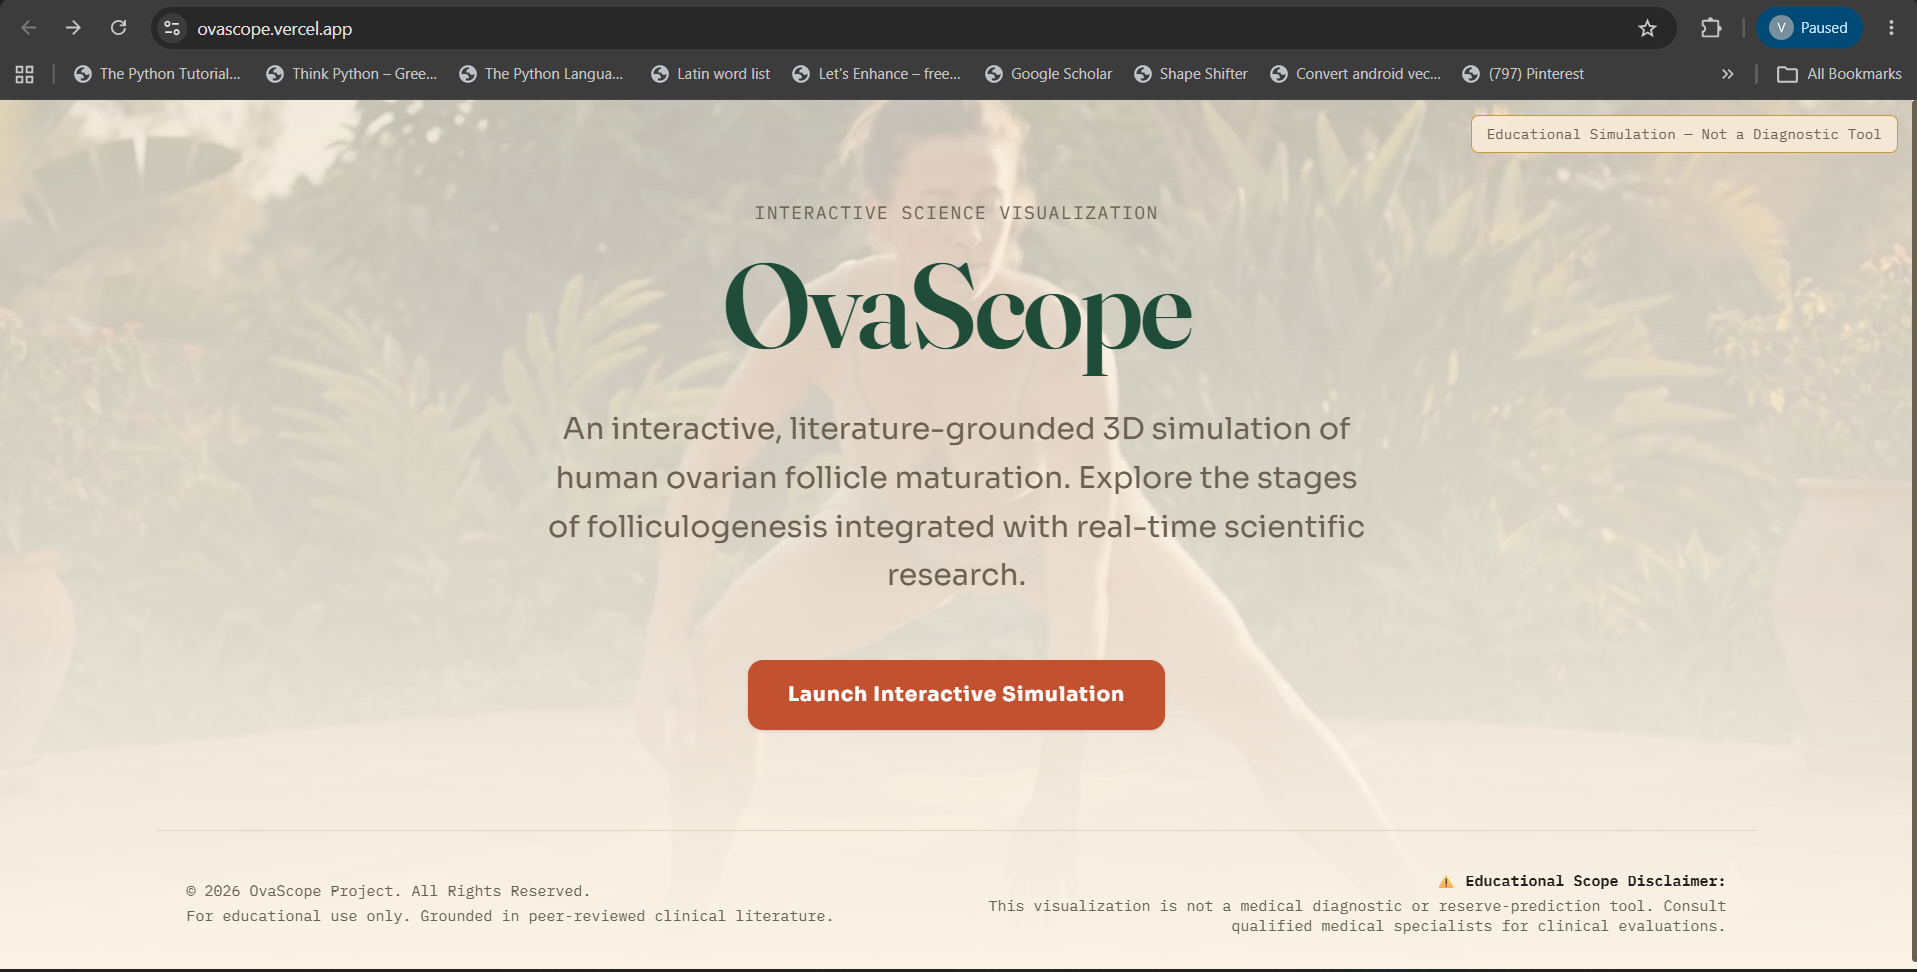
Landing Page
Inspiration
Many women navigating reproductive health face a fragmented landscape: on one side are diagnostic trackers requesting personal biological details, and on the other are dense, inaccessible peer-reviewed publications. We wanted to build an educational bridge. OvaScope was inspired by the desire to make the complex, beautiful process of human folliculogenesis (follicle maturation) visually intuitive and directly grounded in real-time, peer-reviewed clinical research.
What it does
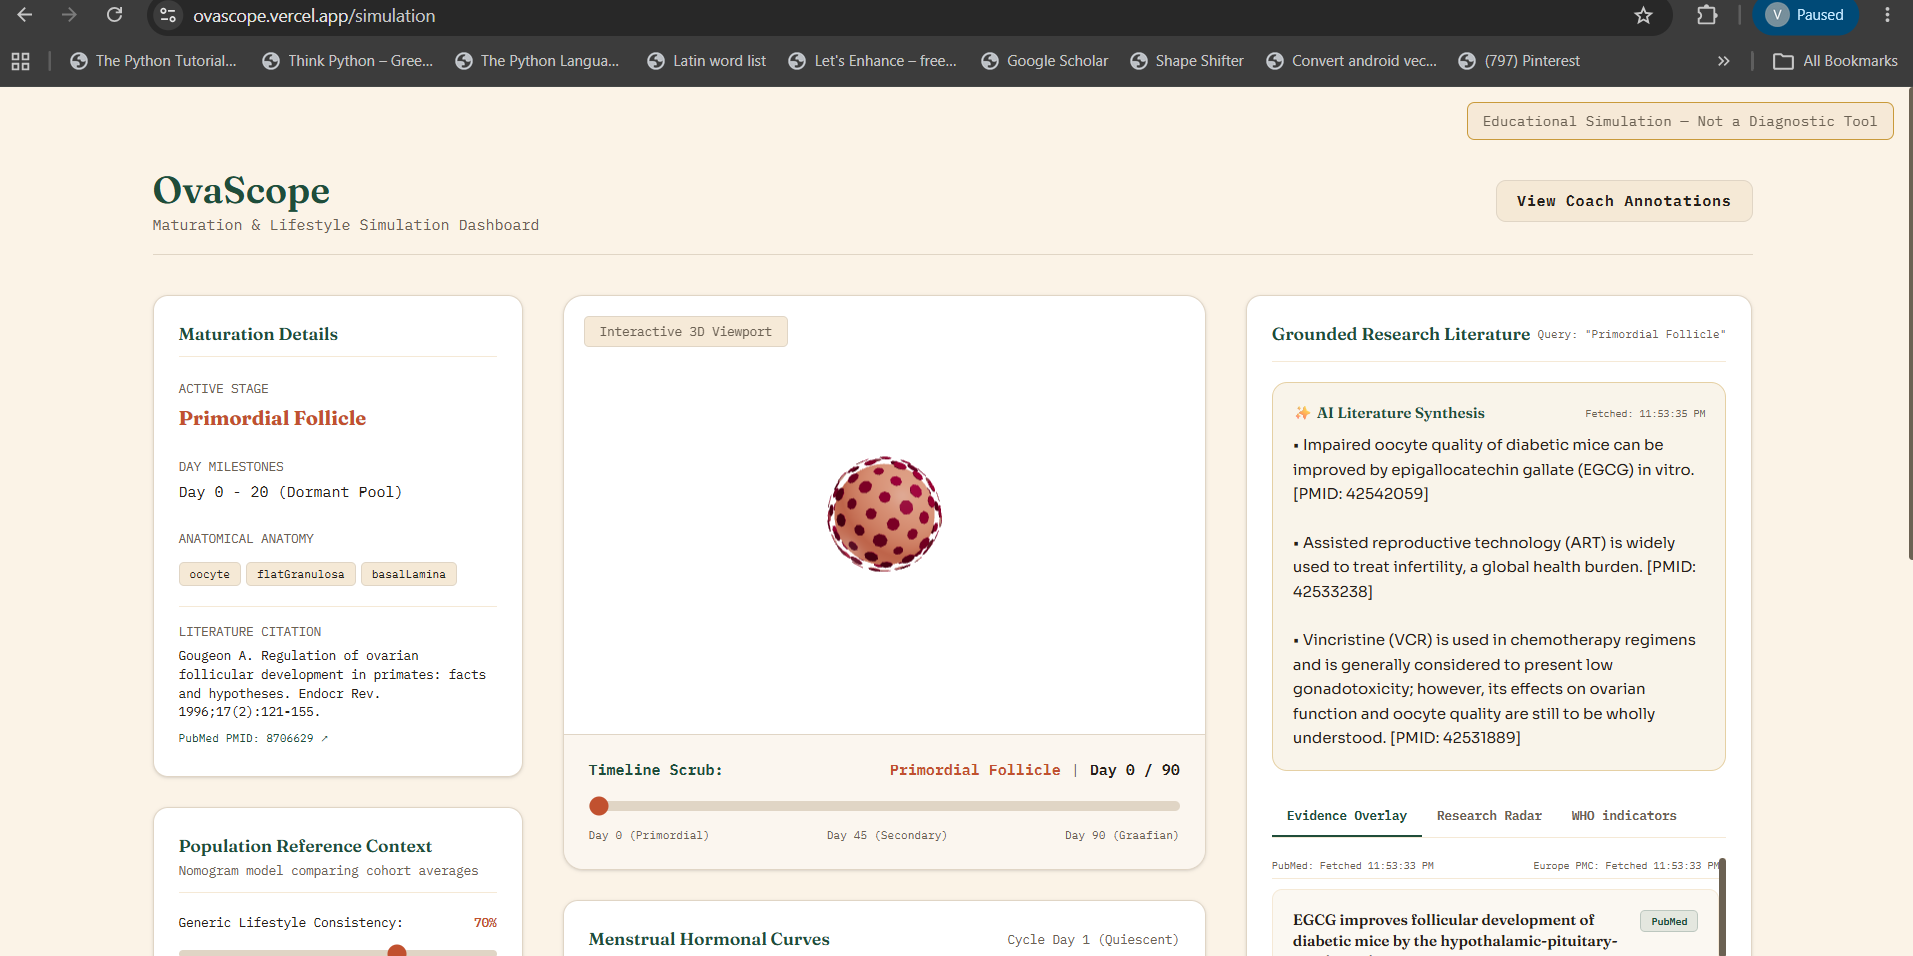
OvaScope is an interactive 3D scientific visualization dashboard of the 90-day ovarian follicle maturation cycle.
- Maturation Timeline (0-90 Days): Users can scrub a continuous timeline slider to watch the follicle procedurally morph across 5 distinct developmental stages (primordial, primary, secondary, antral, and Graafian/preovulatory) with detailed transmissive antrums, instanced granulosa cells, and columnar corona radiata.
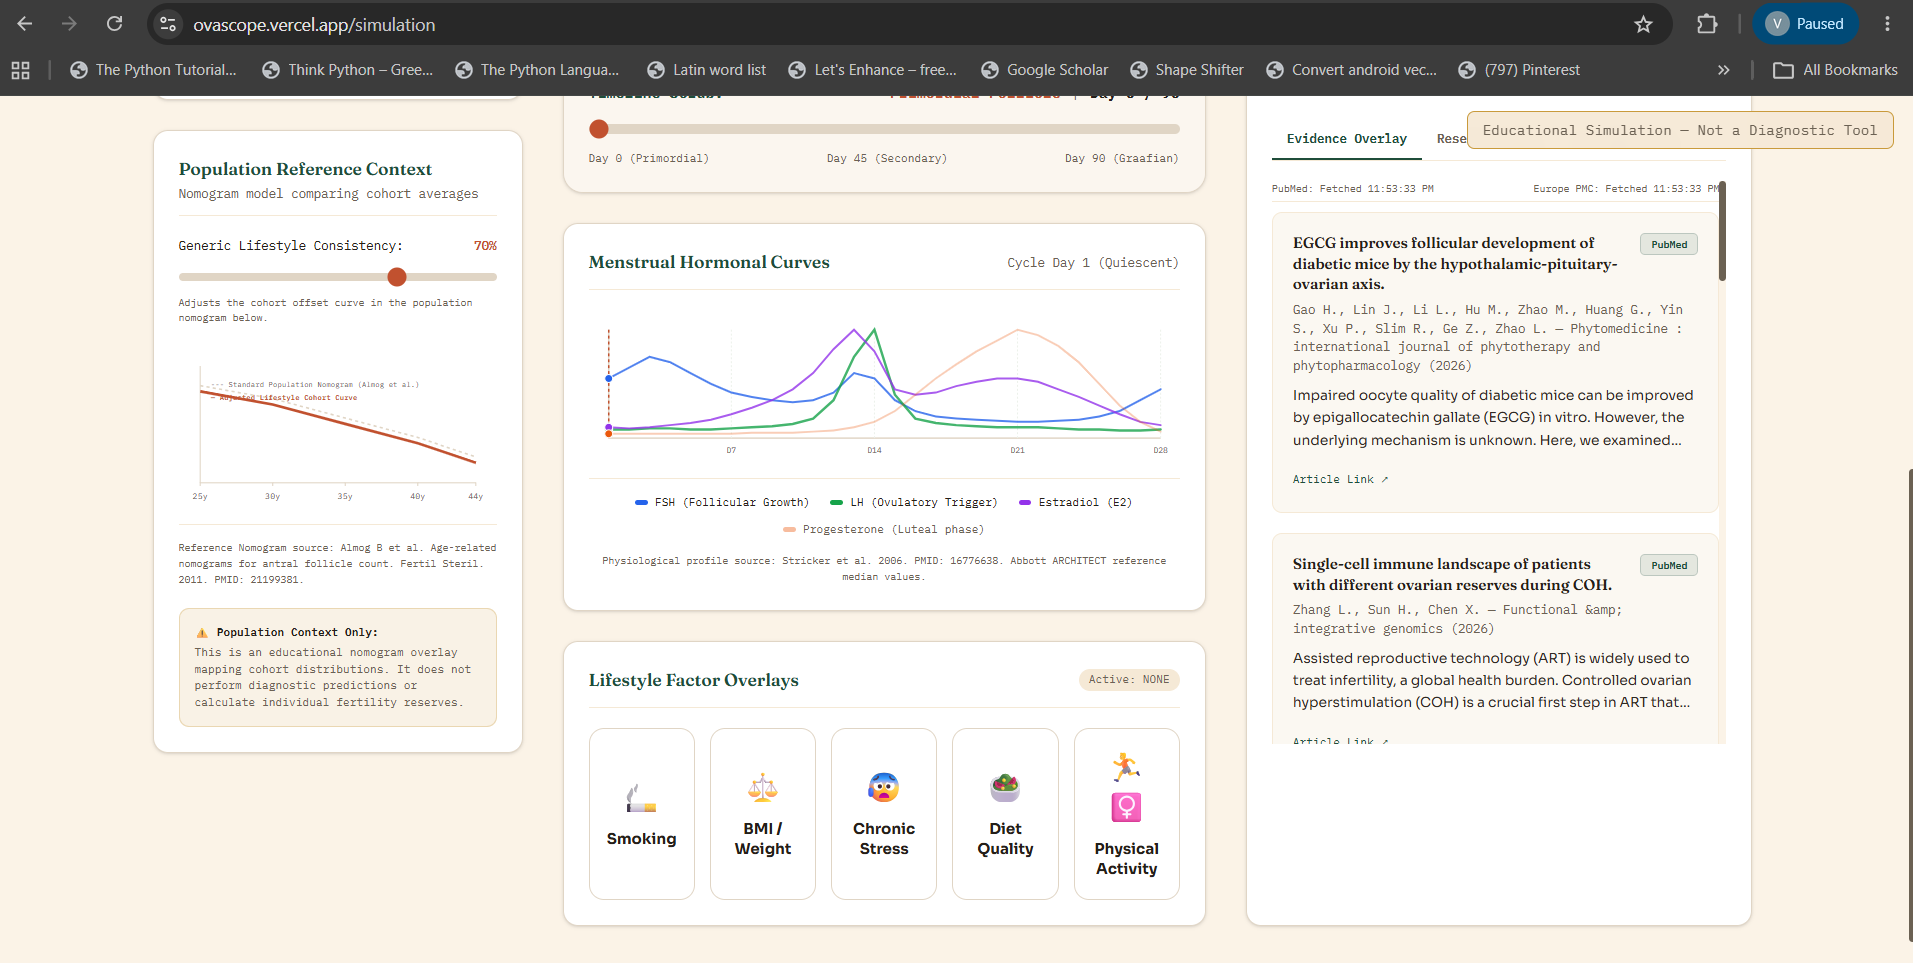
- Hormonal Cycle Syncer: As the user scrubs the timeline into the gonadotropin-dependent stages (days 70–90), an SVG-based menstrual cycle chart dynamically tracks and highlights the fluctuating levels of FSH, LH, and Estradiol based on clinical reference curves.
- Unified Evidence Overlay: Integrates a server-side search pipeline querying both PubMed (US) and Europe PMC (EU). The client merges, de-duplicates, and displays these papers with clear provenance tags.
- Research Radar: Displays active, recruiting clinical trials (sourced from ClinicalTrials.gov v2) alongside actively funded NIH research grants (sourced from NIH RePORTER) with live "fetched at" timestamps.
- Population Nomogram Context: Features a cohort nomogram mapping age-specific Antral Follicle Count (AFC) medians, allowing users to adjust a generic lifestyle consistency slider to see statistical cohort shifts without making individual diagnostic predictions.
How we built it
We scaffolded the project using Next.js 14 App Router and TypeScript for safety.
- 3D Engine: Built procedurally using Three.js and React Three Fiber (R3F). We avoided basic scaling spheres, opting instead for custom transmissive glass shaders (
MeshTransmissionMaterial) and Fibonacci-sphere mathematical distributions for cell instancing. - Grounded AI Synthesis: Developed
/api/summarizeconnecting to the Gemini API (gemini-flash-latest). It synthesizes the fetched scientific abstracts in real-time under a strict system instruction to summarize only the provided text, adding citation tags mapping directly to the original PubMed PMIDs. - On-Demand Cache Purging: Integrated a Vercel Cron schedule calling
/api/refreshdaily to trigger Next.js incremental static regeneration (ISR) path revalidation, keeping the data radar genuinely current.
Challenges we ran into
Handling transmissive materials (MeshTransmissionMaterial for the Zona Pellucida and Antral cavity) is highly CPU/GPU intensive. On mobile devices, this caused frame-rate degradation. We resolved this by implementing device-capability detection that automatically downgrades transmissive materials to lighter physical materials if performance lag is detected.
Additionally, scraping and parsing PubMed's XML return payload in a lightweight server-side handler without adding heavy third-party XML parsing libraries was tricky. We solved it by building a custom, highly robust regex string extraction pipeline.
Accomplishments that we're proud of
- Achieving a 100% compile-ready Next.js build with strict TypeScript verification.
- Integrating six live API data streams (PubMed, Europe PMC, ClinicalTrials.gov, NIH RePORTER, WHO, and Gemini) into a single, cohesive dashboard panel with dynamic fallback error notices.
- Creating an organic-looking, scientifically accurate 3D model that morphs smoothly without any pre-made static assets.
What we learned
We gained deep insights into the clinical timelines of human folliculogenesis—specifically how pre-antral growth (dormant to secondary) is locally regulated, and how only the final 20 days (antral to Graafian) become dependent on systemic FSH and LH surges. Translating these biological milestones into corresponding interactive math structures in R3F was a massive learning experience.
What's next for Ovascope
We plan to introduce interactive cellular cross-sections to let users cut open the 3D model at any point in the timeline and inspect the internal development of the oocyte's germinal vesicle. We also aim to expand the cohort nomogram dataset to include broader global health indicators from the WHO database.


Log in or sign up for Devpost to join the conversation.