Inspiration
Last summer I worked at Blackfriars Settlement, a community charity in Southwark. That experience showed me how much local need goes unseen by the people who allocate funding. Borough councils make budget decisions based on aggregate statistics that flatten the reality of what individual neighbourhoods are going through. Areas with severe mental health need, high disability rates, and limited access to services can sit inside boroughs that look fine on paper. The funding follows the averages, and the most vulnerable communities fall through the gaps.
Mental health support in the UK is severely inadequate. There are not enough therapists, stigma prevents people from seeking help, and quality care is gatekept by geography and postcode. But the data to identify where need is greatest already exists across ONS, MHCLG, and NHS datasets. The problem is that it sits in disconnected silos that no frontline commissioner has time to join up. I wanted to build something that assembles that data, scores every neighbourhood in London, and makes the need impossible to ignore.
What it does
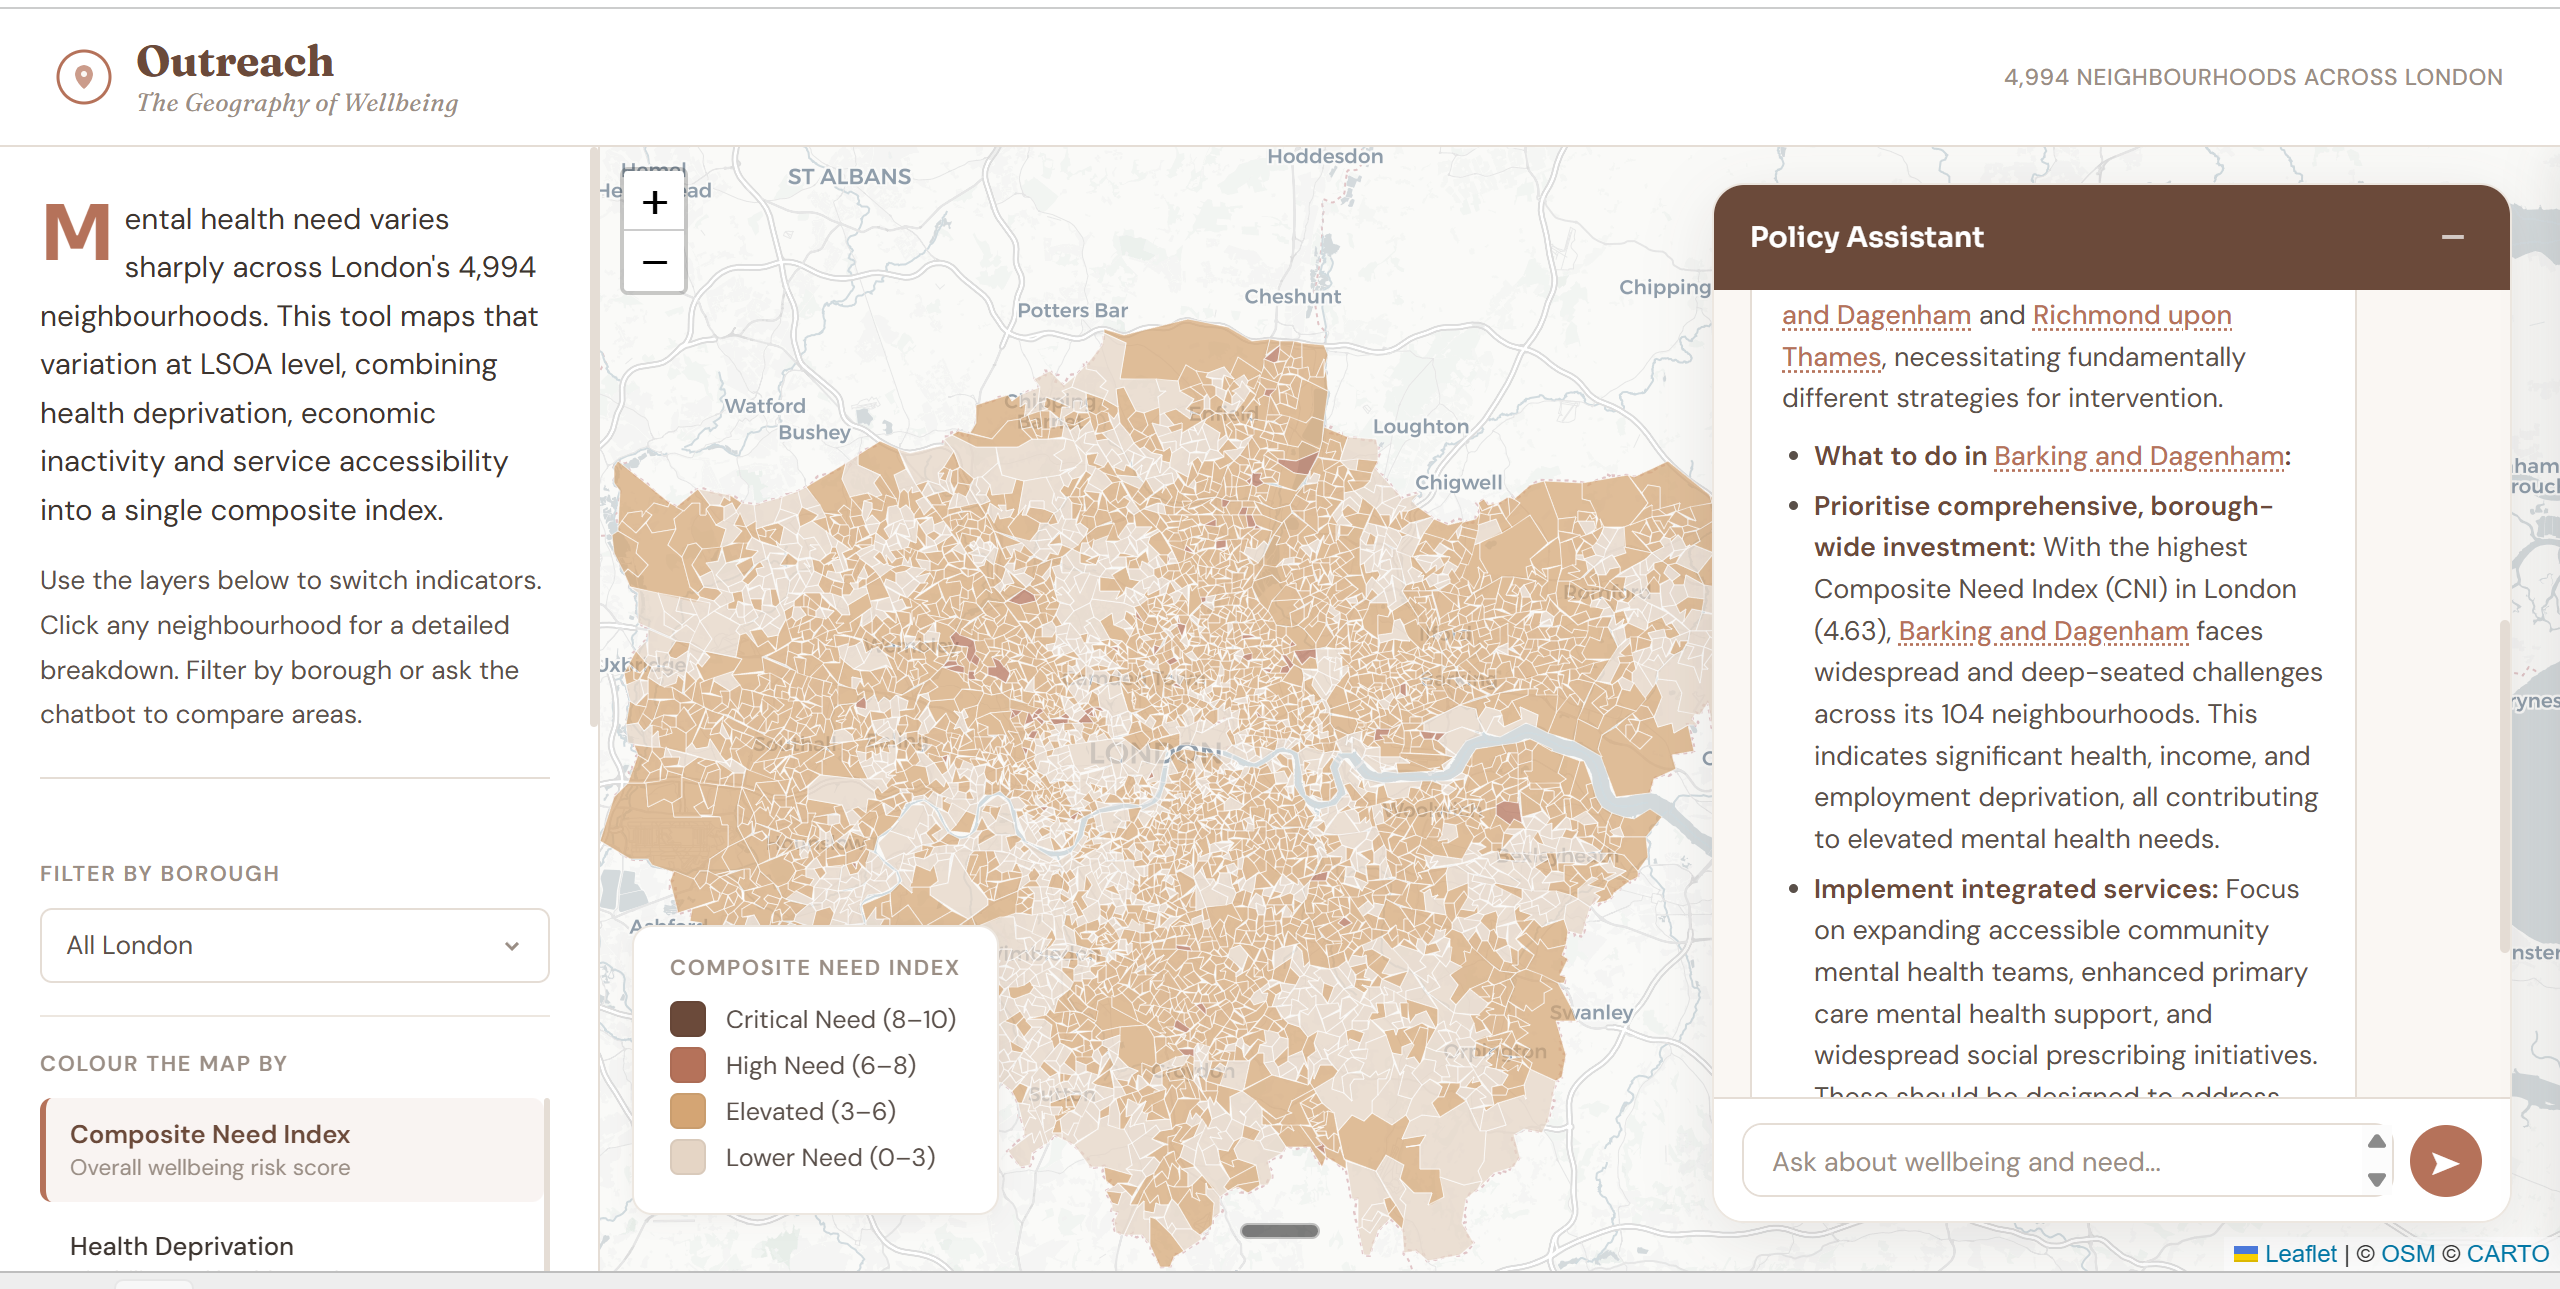
Outreach maps mental health need across all 4,994 Lower Super Output Areas in London. It combines deprivation indices, GP depression prevalence, antidepressant prescribing rates, disability data, unpaid care burden, and community service locations into a single interactive dashboard. Every neighbourhood receives a Composite Need Index score from 0 to 10, built from two weighted pillars of socioeconomic and demographic indicators.
The tool also includes an AI policy chatbot powered by Claude's approach to responsible AI. A commissioner can ask a question like "We have funding for three new community mental health teams, where should they go?" and receive an immediate, data-grounded recommendation with clickable links to the specific neighbourhoods on the map. The chatbot speaks in the language of policy decisions, recommending concrete interventions like expanding talking therapies or deploying social prescribing workers to specific areas. It empowers policymakers with better information rather than making decisions for them.
Outreach is built for a specific audience with a specific problem. Public health commissioners, council officers, and mental health practitioners need to understand where need is concentrated at a neighbourhood level so they can target limited resources effectively. The tool gives them that understanding in seconds rather than weeks of manual data assembly.
How I built it
I am a solo participant, so I used multiple Claude Code instances running in parallel to tackle different parts of the project simultaneously. One agent focused on gathering and enriching the dataset with LSOA-level indicators from ONS, MHCLG, and the University of Bristol's SAMHI index. Another agent handled the frontend design and Leaflet map implementation. A third worked on the FastAPI backend and the AI chatbot integration.
The data pipeline assembles everything into a single GeoPackage file containing 120 columns per neighbourhood. On server startup, the application loads this file into memory, computes the Composite Need Index, and caches a simplified GeoJSON for fast map rendering. The chatbot dynamically extracts relevant data slices based on what the user asks about, sending all 33 borough summaries as context so the LLM can resolve any location reference using its own world knowledge. This means a user can ask "What about where Imperial College is?" and the system will identify Kensington and Chelsea and provide the relevant data without the user needing to know borough boundaries.
Challenges
Building a full-stack geospatial application with an AI chatbot in two and a half hours was ambitious. The biggest technical challenge was getting the GeoPackage to load correctly on Railway's deployment environment, where missing system libraries caused the spatial data reader to fail. I had to switch from Fiona to PyOGRIO and configure custom system dependencies through Nixpacks.
The harder challenge was ethical. The chatbot initially produced responses that were useless to policymakers. It would list raw indicator values and explain what scoring tiers mean, which is exactly what someone with a dashboard in front of them does not need. Worse, presenting neighbourhood-level statistics without framing them carefully risks stigmatising communities or reducing lived experience to a number on a map. Rewriting the system prompt to frame the AI as a senior policy advisor transformed the outputs. The chatbot now leads with actionable recommendations and frames data as policy implications, while consistently reminding users that this is area-level data and should not be used to make assumptions about individuals.
I was not able to obtain all the data sources I originally planned for. Green space coverage, air quality metrics, and NHS service utilisation data would strengthen the picture considerably. But even with the current dataset, the tool demonstrates that the building blocks for neighbourhood-level mental health intelligence already exist in public data. They are scattered across different agencies and formats, and Outreach brings them together into something a frontline commissioner can actually act on.
What I learned
The most important lesson was that data tools for policymakers need to speak in recommendations, not statistics. A disability rate of 20.1% means nothing to someone deciding where to put a community mental health team. Telling them that one in five residents in a specific neighbourhood report a disability, and that this is 50% above the London average, changes the conversation entirely. IT also output everything in LSOA which was based on the GPKG dataset, which isn't much use to the policy maker so I had to run an additional agent prompt filter on it.
Building with multiple Claude Code agents in parallel was also super effective for a solo developer under time pressure. Each agent could focus deeply on one domain without context-switching, and the outputs integrated cleanly because they all worked from the same GeoPackage as the single source of truth.
The gap between having public data and making it actionable is where most public health tools fall short. Councils already collect the right numbers. Researchers already publish the right indices. But the people who need to make decisions based on that information rarely have the time or technical skill to assemble it themselves. Outreach is designed to close that gap, and I believe tools like it represent exactly the kind of AI application that helps people flourish by expanding their ability to understand and respond to the communities they serve.
Built With
- claude
- claude-code
- fastapi
- geopackage
- geopandas
- javascript
- leaflet.js
- ons-census-2021
- python
- railway
- samhi-v5.00

Log in or sign up for Devpost to join the conversation.