-
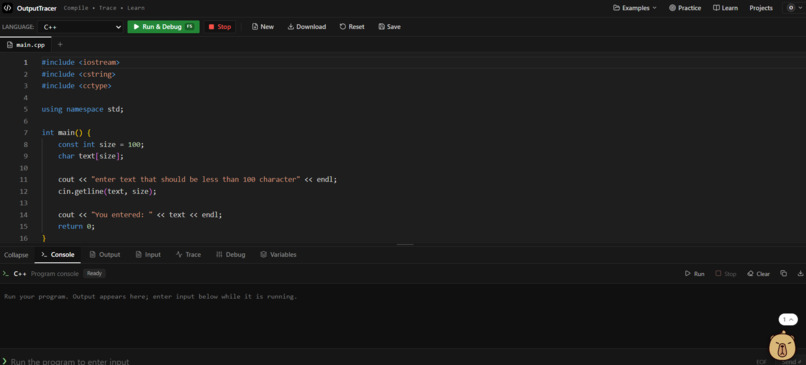
interface
-
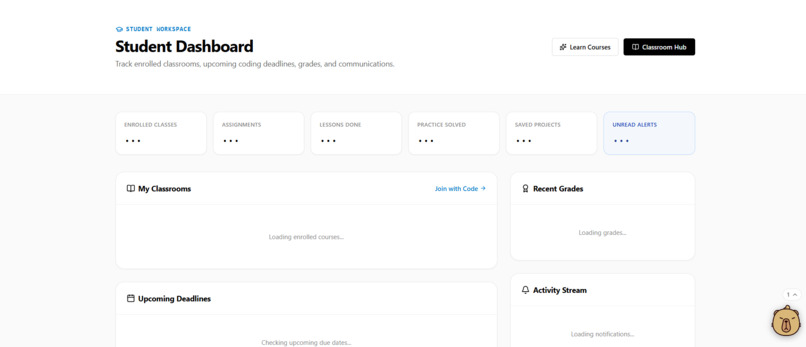
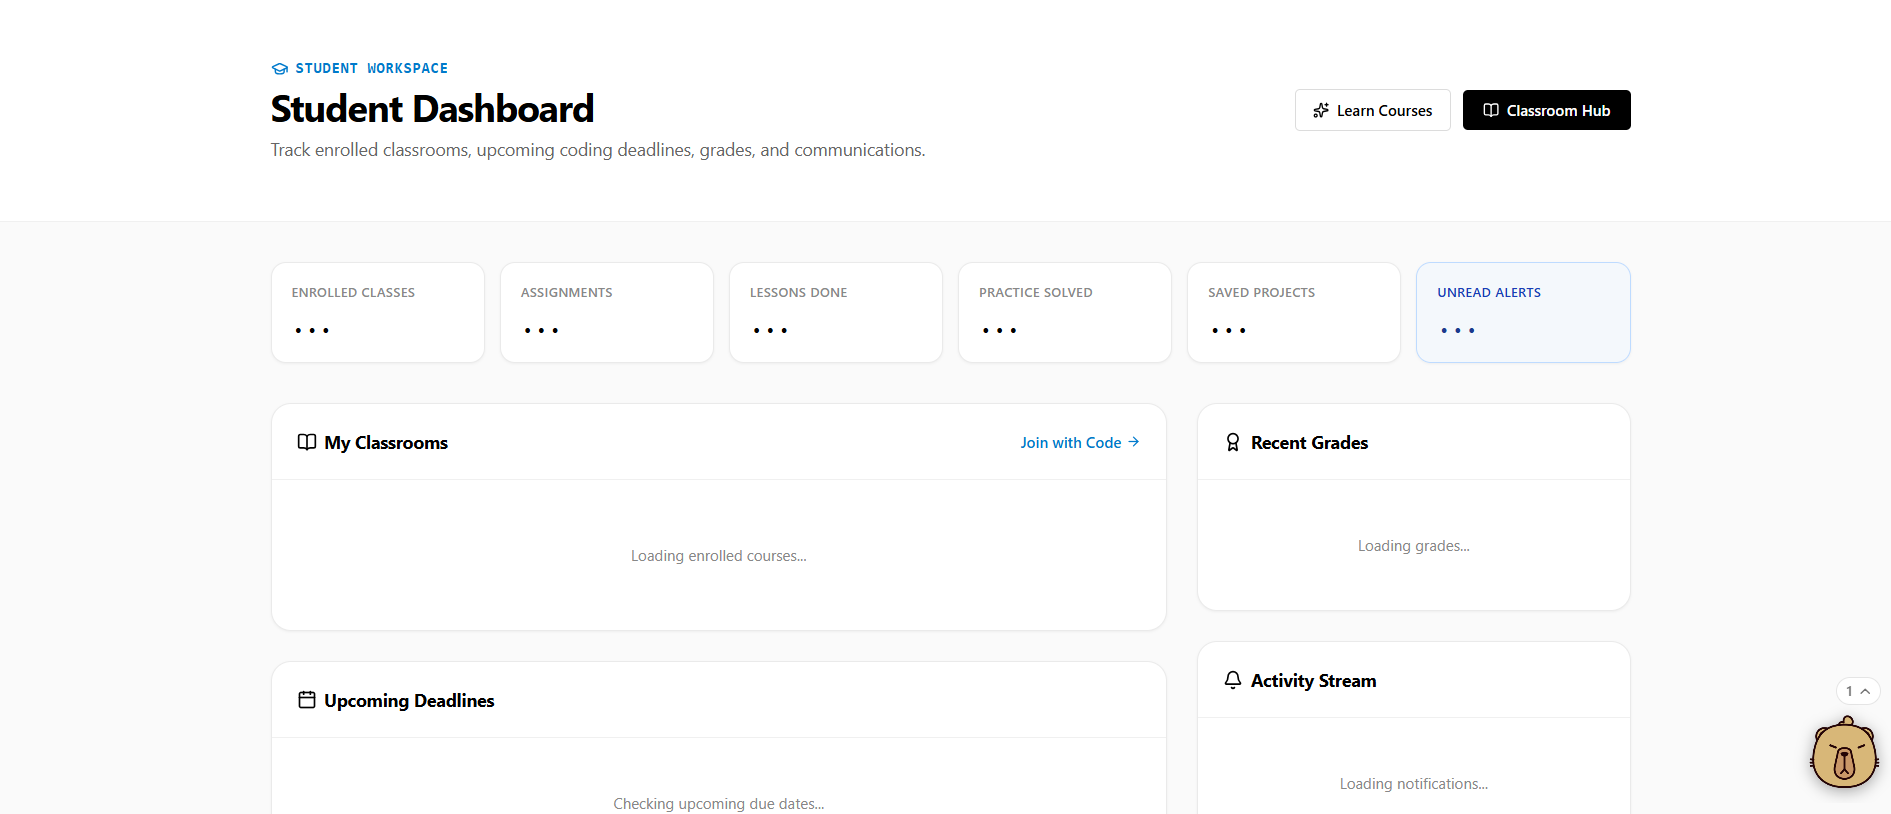
student dashboard
-
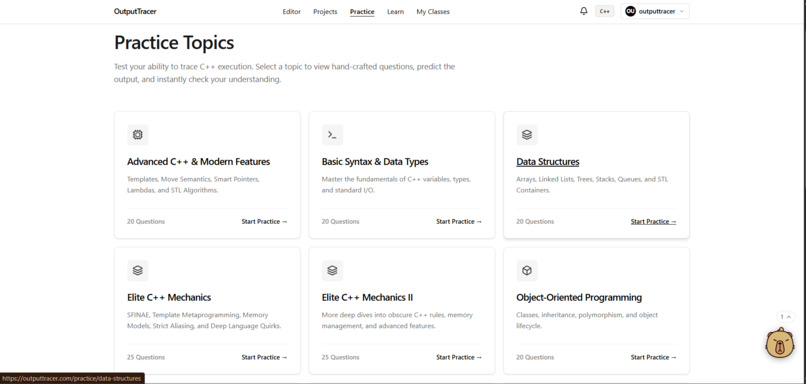
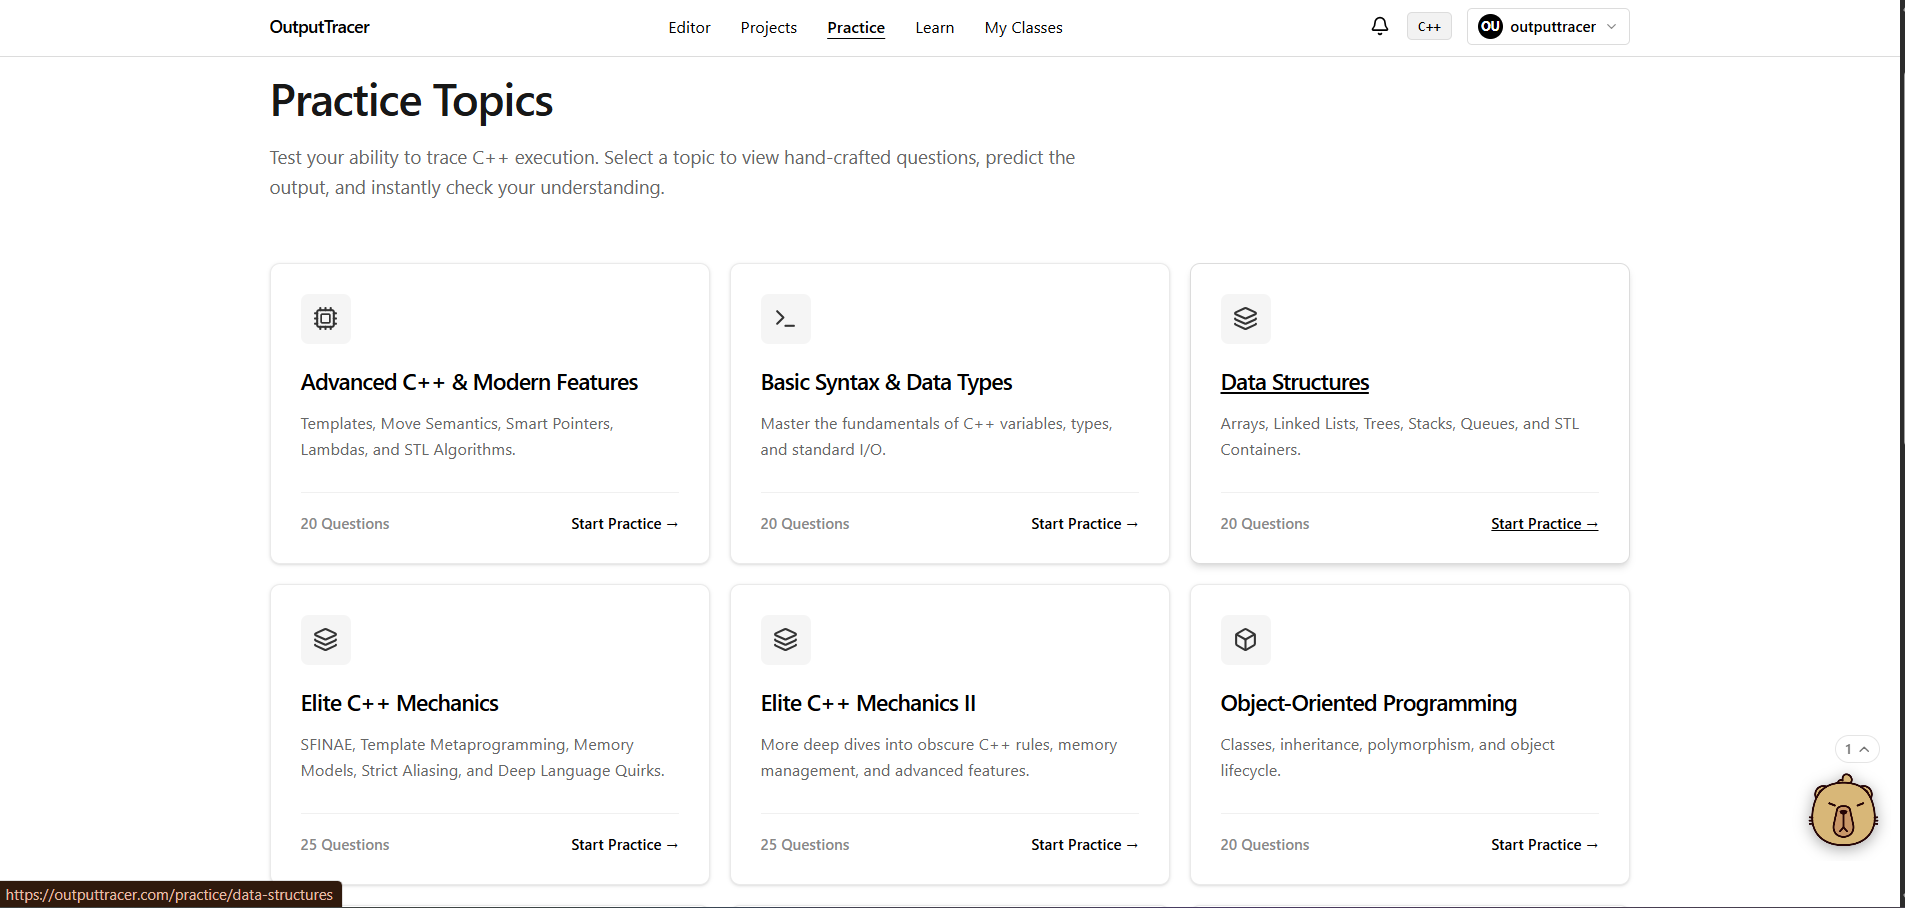
practice page
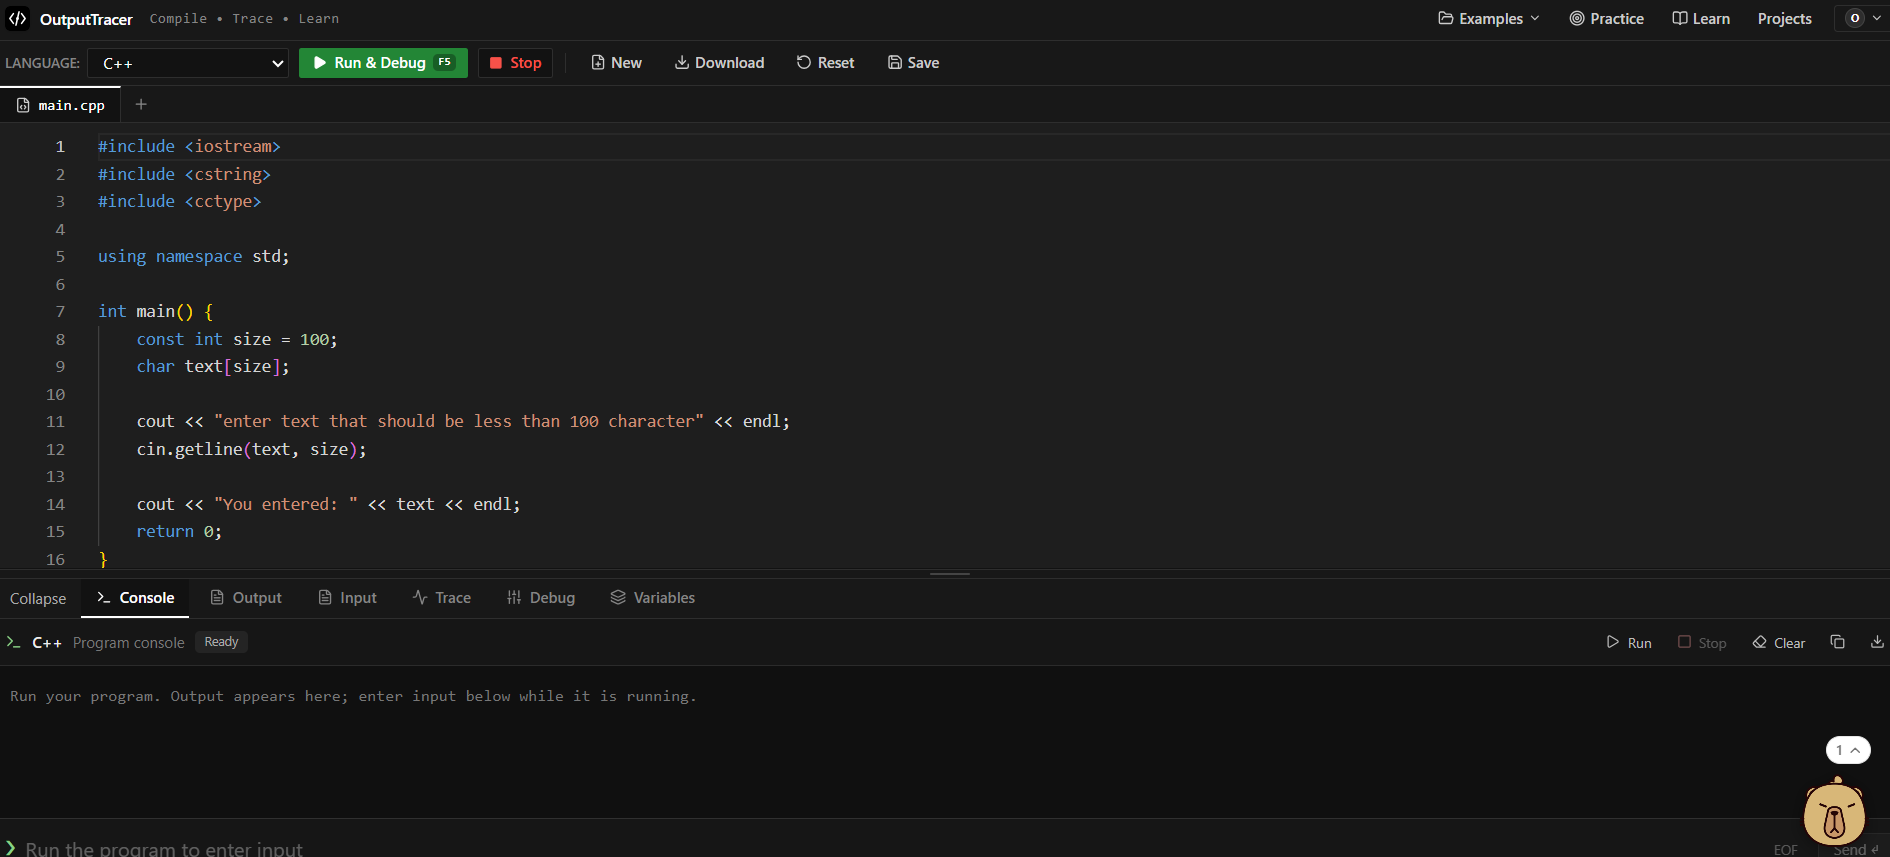
Inspiration
What it does
How we built it
Challenges we ran into
Inspiration
When I was learning programming, one thing I often struggled with was understanding what was happening inside my code.
You write a program, run it, and get an output. But what happens between those two things? Which line executes first? How does a variable change? Why does a program produce an unexpected result?
I realized that simply looking at the final output doesn't always help you understand how a program works.
That's where the idea for OutputTracer came from. I wanted to build something that would let developers see what's happening during execution instead of just showing them the result.
What I Built
OutputTracer is an online coding platform where you can write, run, and debug programs directly in your browser.
The main focus is its execution-tracing functionality. Instead of only showing the final output, it lets you follow your program step by step and see how variable values change along the way.
It currently supports three programming environments:
- C++ – Write, compile, execute, and trace C++ programs.
- Python – Run Python programs in an online environment.
- 8086 Assembly – Write and execute 8086 Assembly programs.
It also includes a code editor, integrated terminal, and collaborative coding features.
I wanted the experience to feel familiar to developers, so I built the editor around Monaco Editor rather than creating a basic text editor from scratch.
How I Built It
I used Next.js, React, TypeScript, and Tailwind CSS for the frontend.
Monaco Editor handles the coding experience, and xterm.js powers the integrated terminal.
For execution, I worked with GCC and GDB for C++, a separate Python execution environment, and NASM with DOSBox for 8086 Assembly.
I also integrated Supabase for authentication and database functionality. For collaborative editing, I used Yjs and WebSockets so multiple users can work in the same coding environment.
Getting all these different technologies to work together was a big part of building the project.
Challenges I Faced
One of the hardest parts was making execution tracing work properly.
Showing a program's final output is one thing, but following its execution and keeping track of changing variables is a completely different challenge.
Another challenge was supporting three different programming environments. C++, Python, and Assembly each have their own execution requirements, so I had to approach their integration differently.
I also spent time working on the communication between the editor, backend, and execution services to make the overall experience feel connected rather than like separate tools.
There were plenty of debugging sessions along the way, especially when different parts of the application didn't behave as expected.
What I Learned
Building OutputTracer gave me a much better understanding of how compilers, debuggers, and program execution work.
I also gained experience with full-stack development, real-time communication, collaborative editing, and integrating different execution environments into one application.
More importantly, this project taught me that sometimes the most useful tools come from problems you experience yourself.
What's Next?
OutputTracer is something I want to keep improving. There is still a lot I would like to add, especially around making execution tracing more powerful and improving the overall debugging experience.
My goal is to make it easier for developers, particularly beginners, to understand what's actually happening when their code runs.
OutputTracer – Don't just see the output. Understand the execution.
Accomplishments that we're proud of
What we learned
What's next for OUTPUTTRACER
Built With
- 8086-assembly
- c++
- dosbox
- gdb
- monaco-editor
- nasm
- next.js
- node.js
- postgresql
- python
- react
- supabase
- tailwind-css
- typescript
- websockets
- xterm.js
- yjs
