-

Real time map of diseases worldwide based on country
-
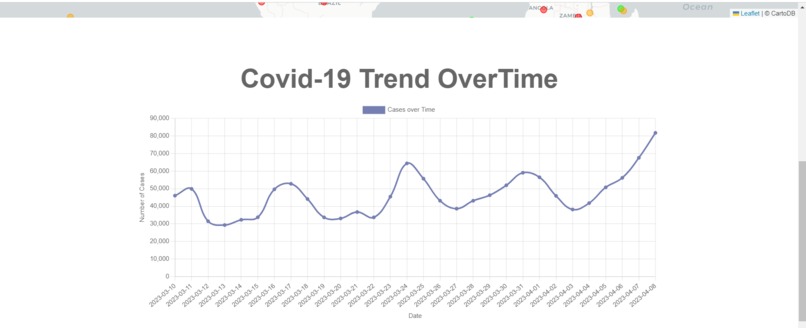
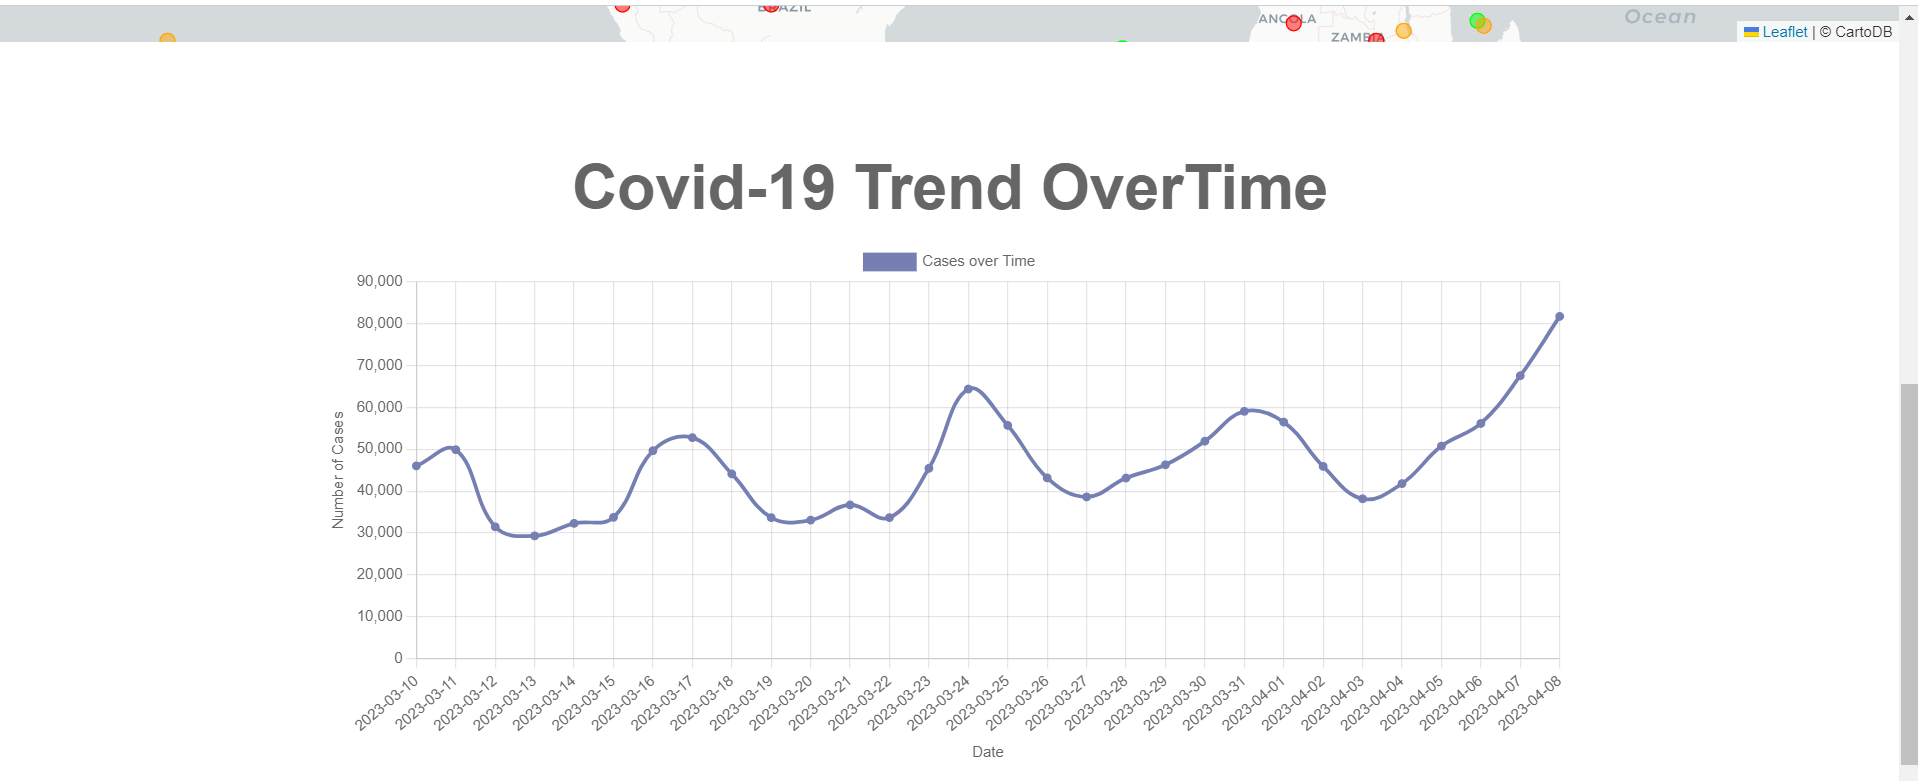
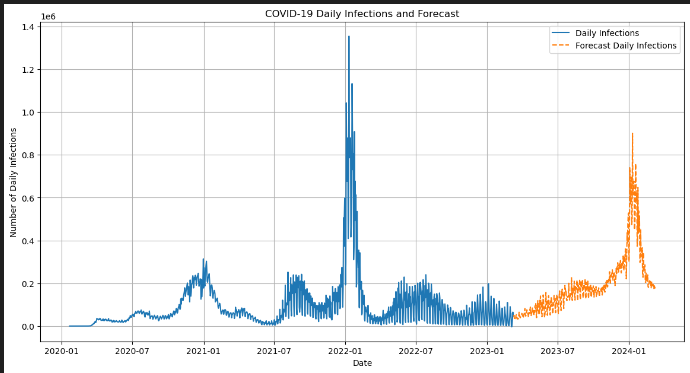
covid 19 treand in the past year
-
Footer
-
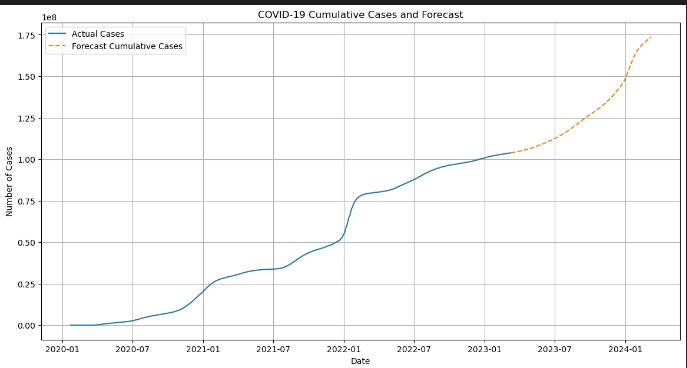
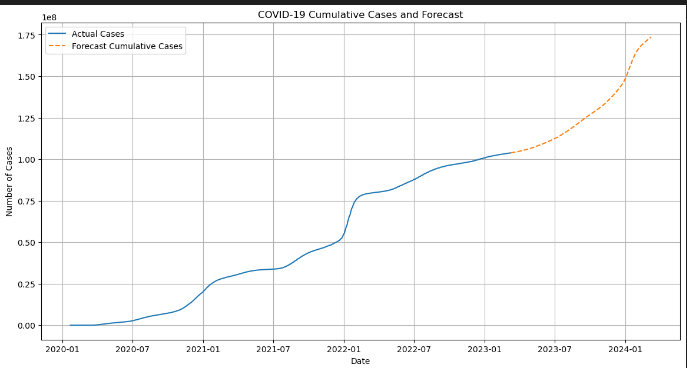
Blue line showing historical data from API and orange is prediction based on data
-
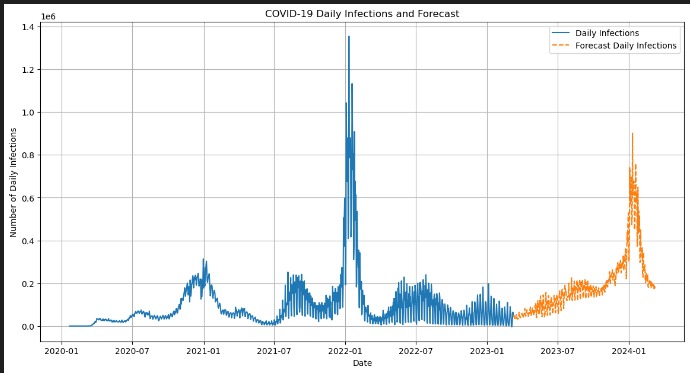
Blue line showing historical data from API and orange is prediction based on data
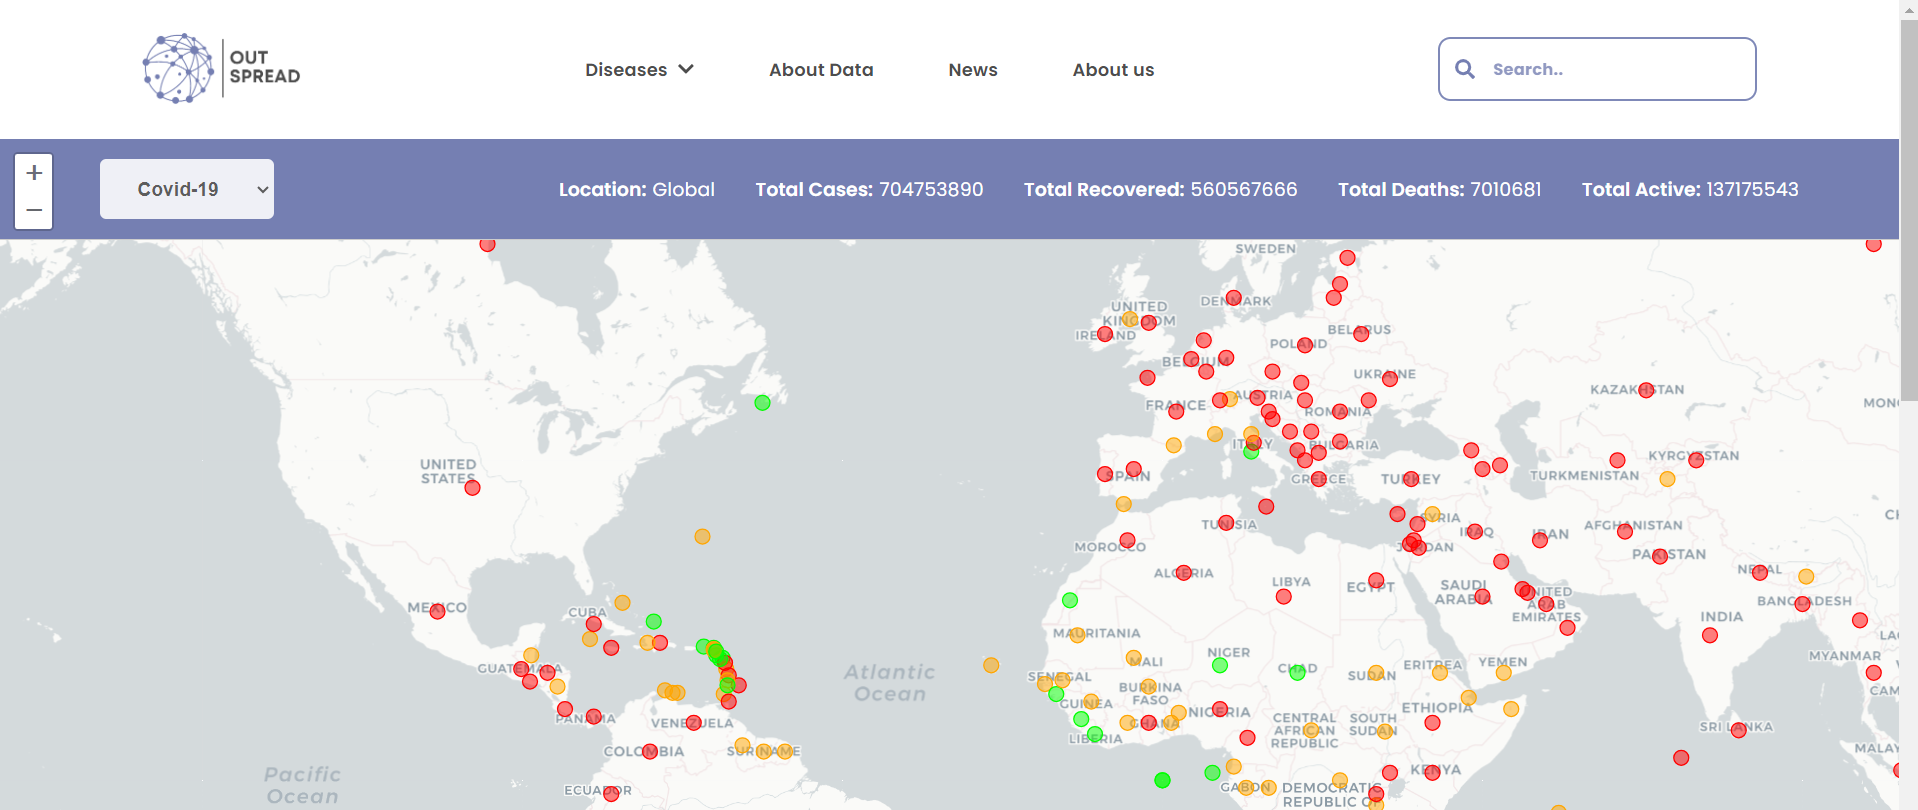
Real-Time Disease Outbreak Tracker and Prediction Objective This project tracks real-time data of a disease or outbreak and predicts trends based on data from various regions. The system visualizes the severity and number of cases on a global map, including data on infection rates, deaths, and real-time updates. Using a machine learning model, it predicts future trends, providing critical insights into the outbreak's potential progression. Features Real-Time Data: Displays up-to-date information on cases, infection rates, and deaths from global and local sources. Global Map Visualization: A map-based visualization shows the severity and case distribution across different regions. Predictive Modeling: Uses a machine learning model to forecast future trends based on the collected data. Data Sources: Utilizes multiple APIs, including global and local health organizations, web scraping from social media, and news sources for comprehensive data collection. Technologies MongoDB: For data storage and management. Express.js: Backend framework to handle API requests and server operations. React.js: Frontend library for creating dynamic, interactive UI components. Node.js: Server-side JavaScript for backend operations. Machine Learning Model: Predicts future trends in disease cases and outbreaks using historical data. Installation and Setup Prerequisites Node.js MongoDB Python (for ML model) Installation Steps Clone the repository: bash Copy code git clone https://github.com/your-repo-link cd your-project-folder
Install dependencies: bash Copy code npm install
Set up MongoDB: Start your MongoDB instance locally or connect to a cloud service like MongoDB Atlas. Create a database and collection for storing prediction and real-time data. Start the server: bash Copy code npm run start
Access the app at http://localhost:3000. Data Sources APIs: Global health organization APIs, disease-specific APIs. Web Scraping: Social media, news websites. News API: Retrieves news articles related to disease outbreaks. Machine Learning Model The machine learning model uses historical data to predict trends in infection rates and cases over time. It is built using Python, trained on real-time and historical data, and integrated with the MERN stack for visualization. Usage The app displays current and historical data about the outbreak. Future predictions are visualized through interactive graphs. A global map highlights regions based on case severity.
COVID-19 Forecasting Model
Overview This project involves forecasting daily COVID-19 infections and cumulative cases using historical data. The forecasting is performed using the Exponential Smoothing model, and the results are stored in a MongoDB database. The project consists of the following key components: Data Collection: Fetch historical COVID-19 data from an API. Data Processing: Calculate daily infection rates and forecast future values. Forecasting: Apply the Exponential Smoothing model to predict future infections. Data Storage: Save the forecast data to a MongoDB database. Data Retrieval: Fetch and print the forecast data from MongoDB. Requirements Python 3.x Pandas Requests Statsmodels Pymongo MongoDB Installation Install Python Libraries bash Copy code pip install pandas requests statsmodels pymongo
Set Up MongoDB Ensure MongoDB is installed and running. You can download it from MongoDB's official website.
Script Fetch Historical COVID-19 Data The fetch_covid_data function retrieves historical COVID-19 data from the Disease.sh API. python Copy code def fetch_covid_data(): url = 'https://disease.sh/v3/covid-19/historical/USA?lastdays=all' response = requests.get(url) data = response.json() return data
Process Data Convert the fetched data into a Pandas DataFrame, calculate daily infection rates, and prepare for forecasting. python Copy code data = fetch_covid_data() timeline = data.get('timeline', {}) cases = timeline.get('cases', {}) dates = pd.to_datetime(list(cases.keys()), format='%m/%d/%y') case_values = list(cases.values())
df = pd.DataFrame({'Date': dates, 'Cases': case_values}) df.set_index('Date', inplace=True) df['Daily_Infections'] = df['Cases'].diff().fillna(0)
Forecasting Use Exponential Smoothing to forecast daily infections for the next year. python Copy code model_infections = ExponentialSmoothing(df['Daily_Infections'], trend='add', seasonal='add', seasonal_periods=365) model_fit_infections = model_infections.fit() forecast_infections = model_fit_infections.forecast(steps=365) forecast_infections = forecast_infections.clip(lower=0).astype(int)
Data Storage Save the forecast data to MongoDB. python Copy code result = { "dates": forecast_dates.strftime('%Y-%m-%d').tolist(), "forecast_daily_infections": forecast_infections.tolist(), "forecast_cumulative_cases": forecast_cumulative_cases.tolist() }
client = MongoClient('mongodb://localhost:27017/') db = client['prediction'] collection = db['prediction'] collection.insert_one(result)
Data Retrieval Retrieve the most recent forecast data from MongoDB and print it. python Copy code def fetch_data_from_mongo(): document = collection.find_one(sort=[('_id', -1)]) if document: return convert_bson_to_dict(document) else: return {"error": "No data found"}
fetched_result = fetch_data_from_mongo() print(json.dumps(fetched_result, indent=4, default=json_util.default))
Notes Ensure MongoDB is running locally on the default port 27017. Adjust the URL in the fetch_covid_data function if needed to match the data source
Contributing Feel free to submit issues and pull requests if you'd like to contribute!


Log in or sign up for Devpost to join the conversation.