-
-
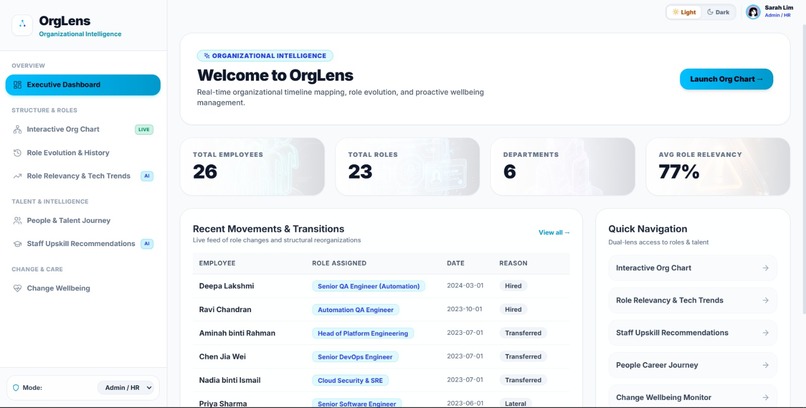
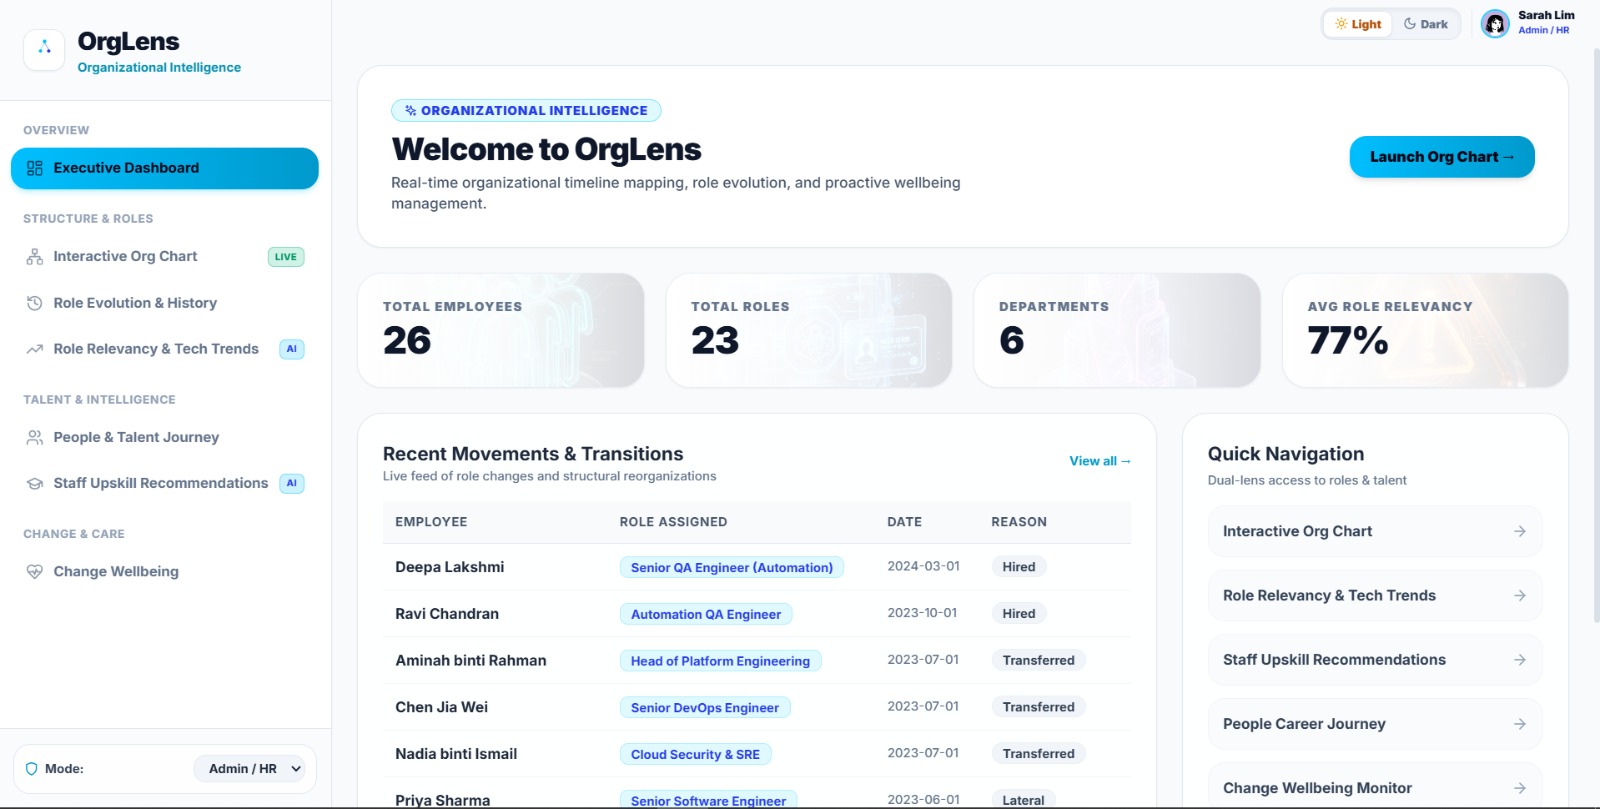
Main Dashboard (Admin View)
-
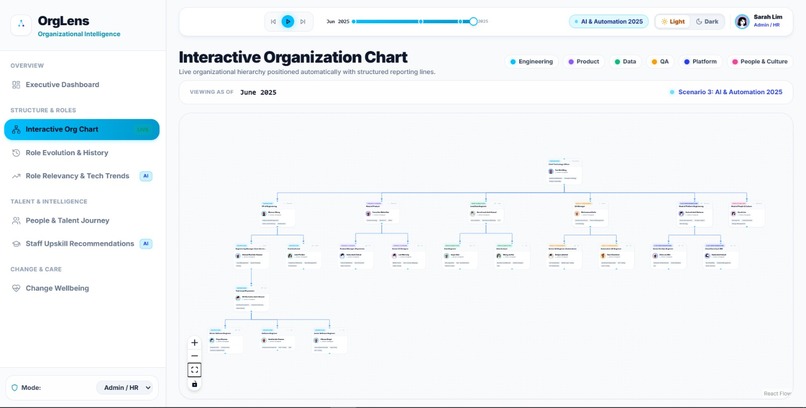
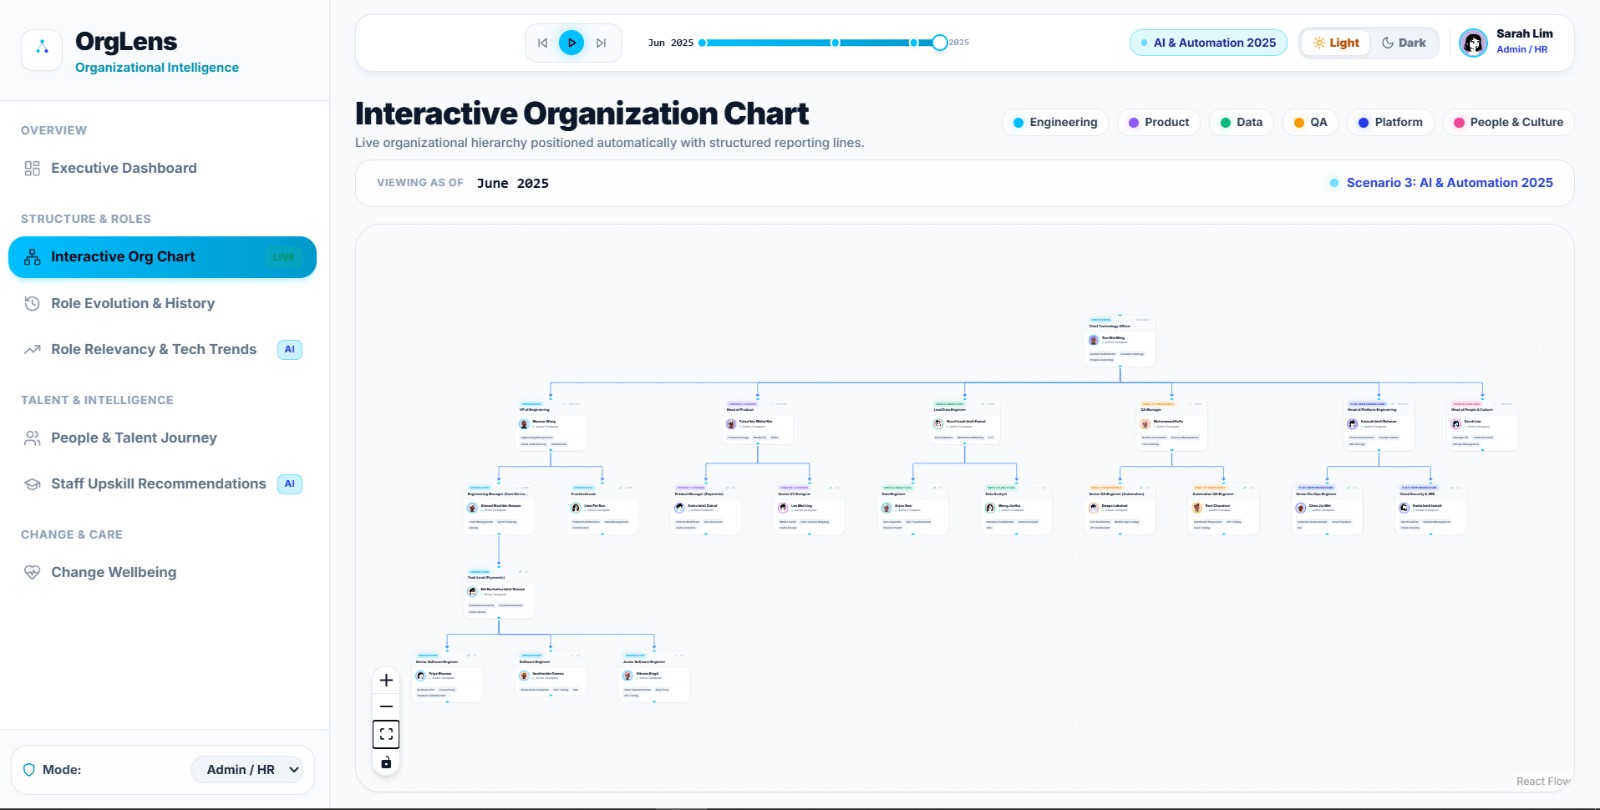
Org Chart
-
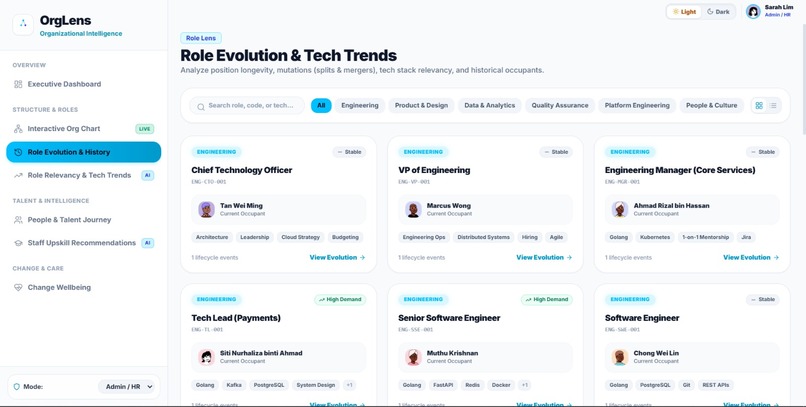
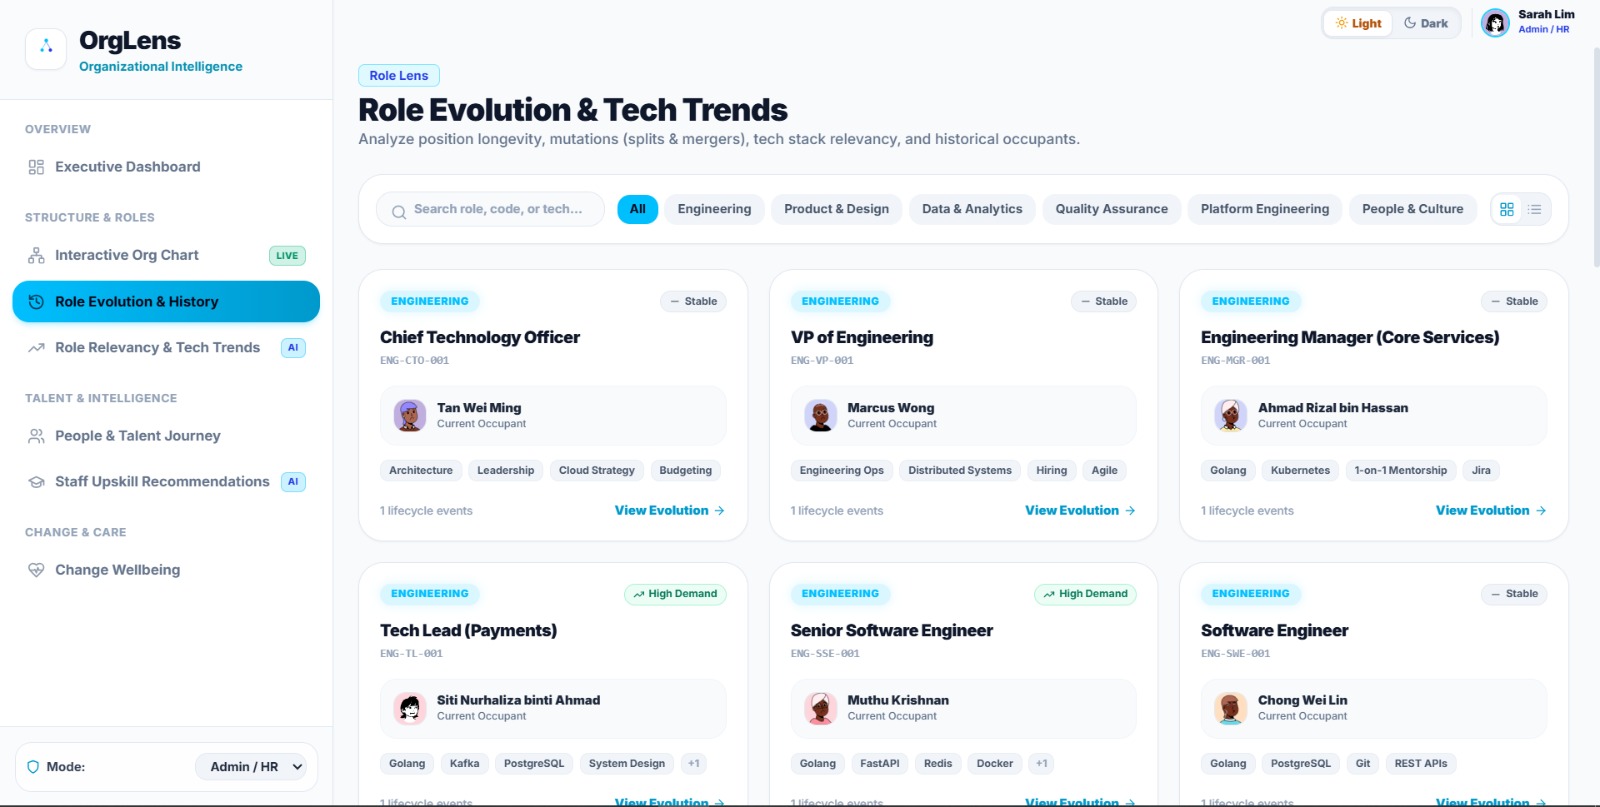
Role Directory (Admin View)
-
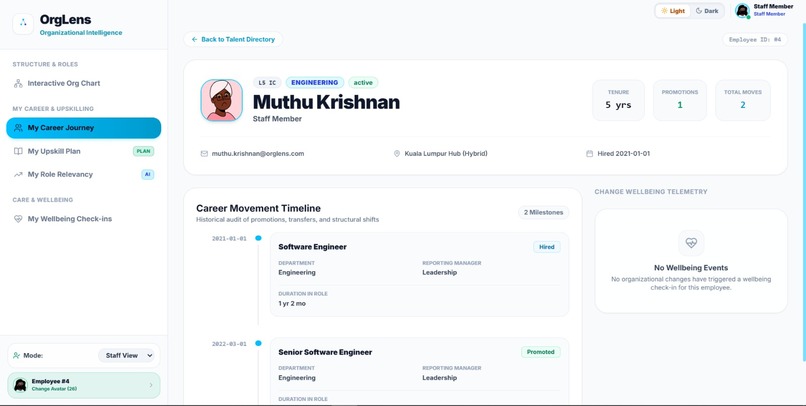
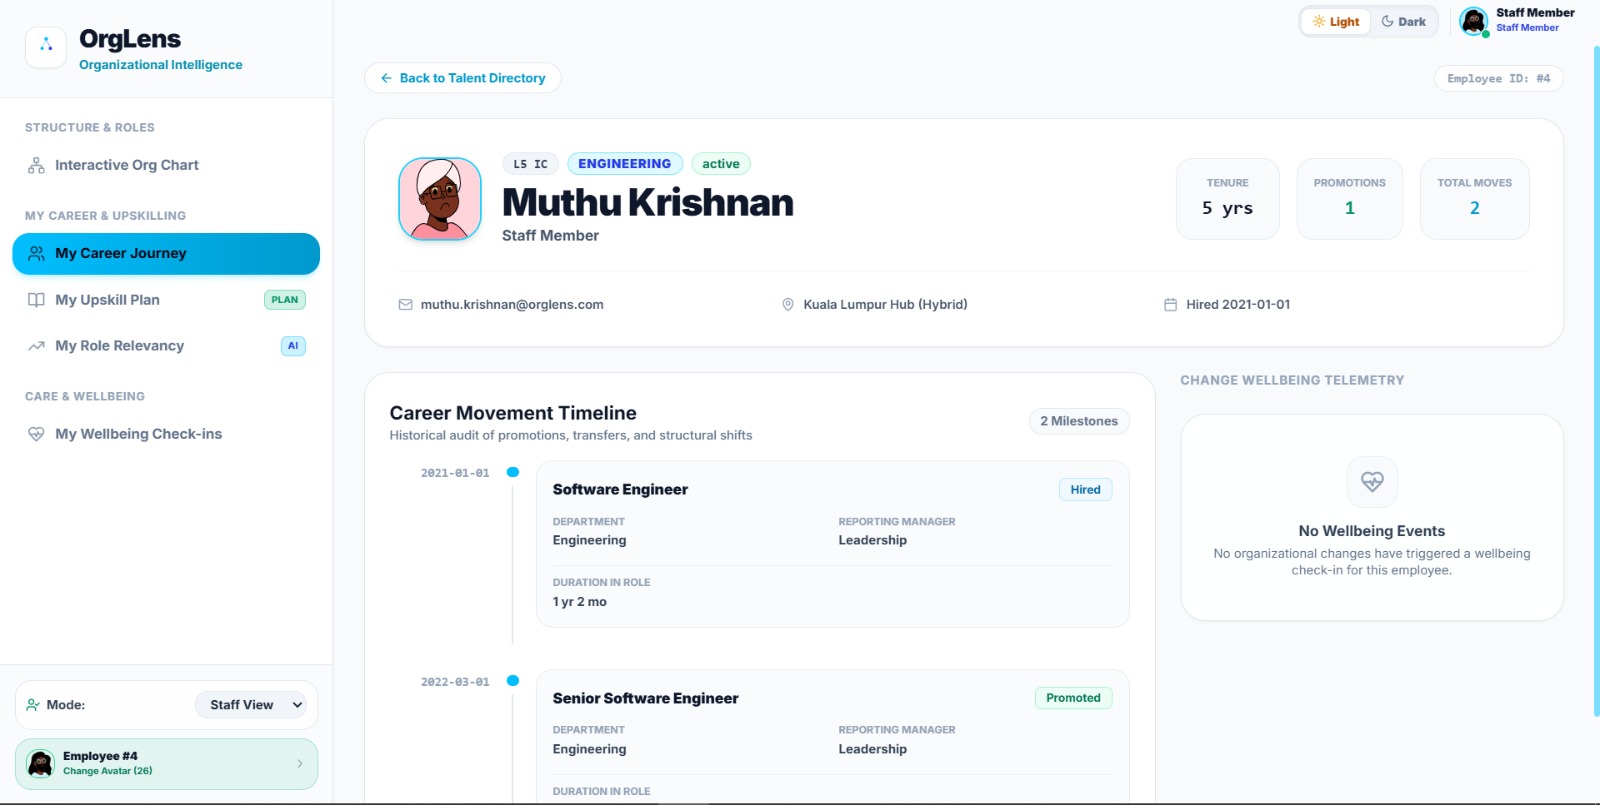
Staff Journey (Staff View)
-
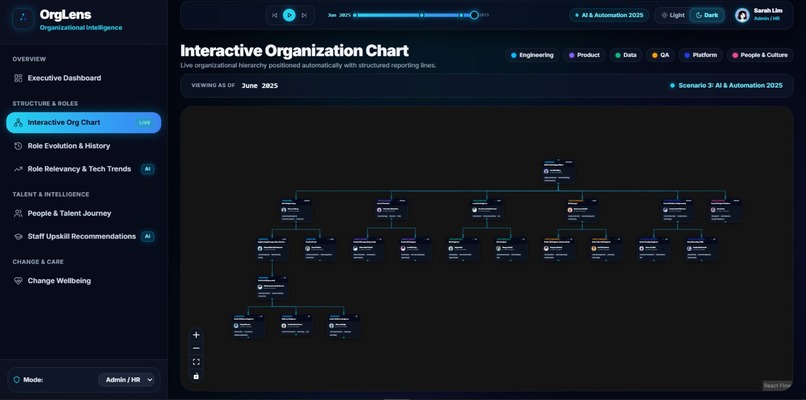
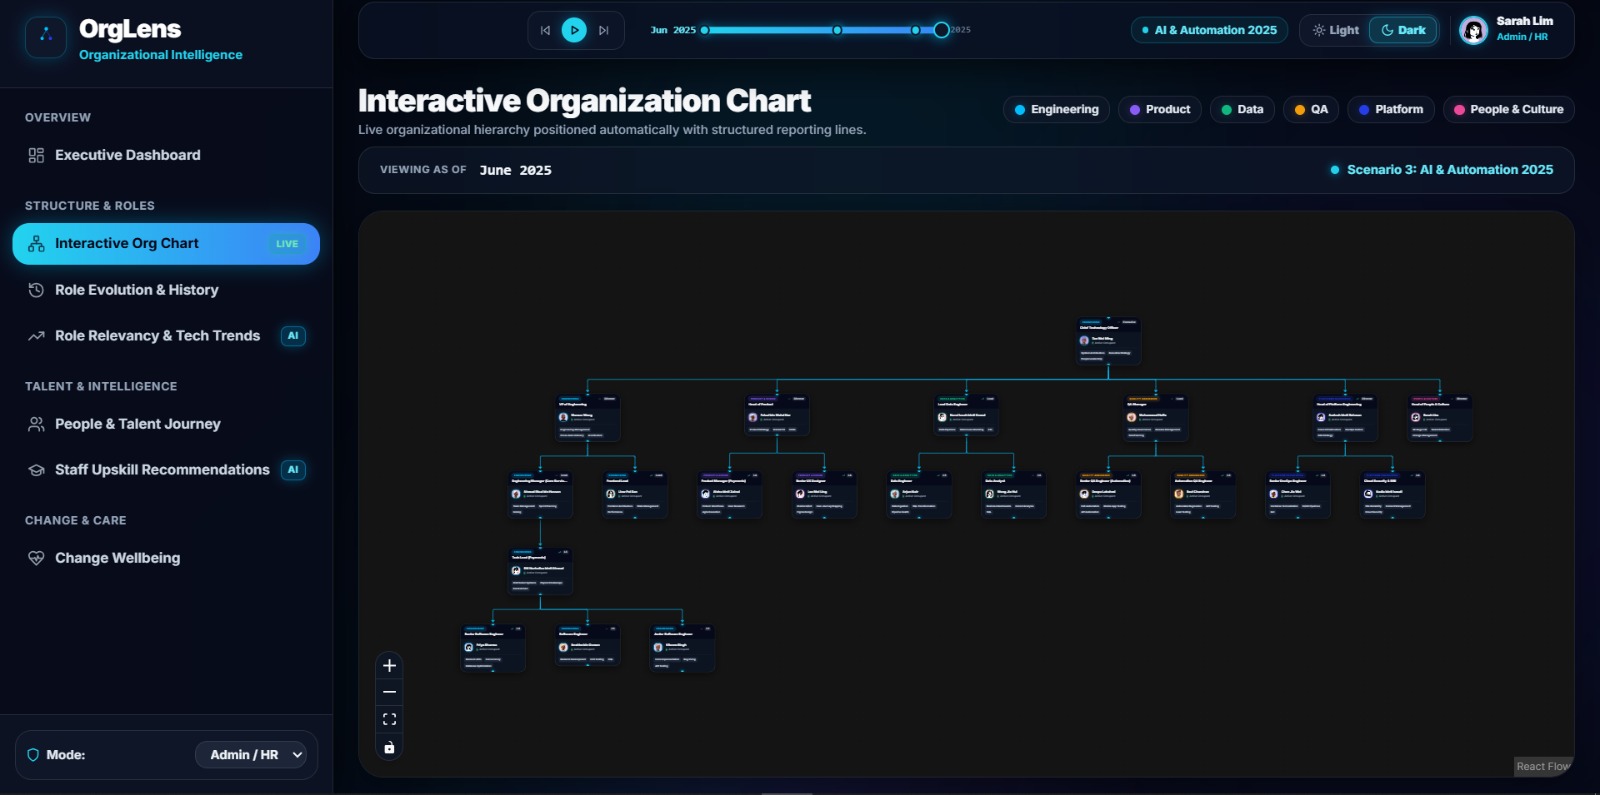
Org Chart (Dark Mode)
-
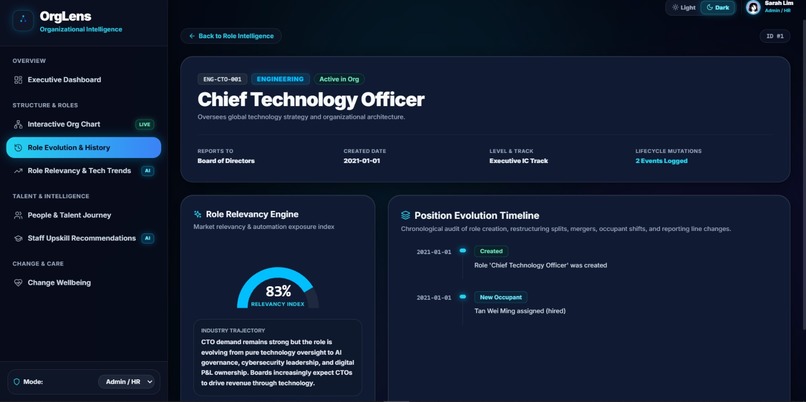
Role Directory (Dark Mode)
-
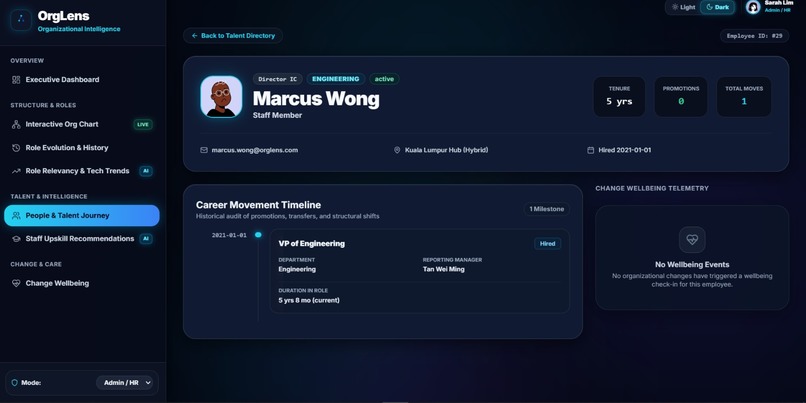
Staff Directory (Dark Mode)
Inspiration
HR teams in growing organizations struggle to answer two simple questions: "How has this role changed over time?" and "What has this person's career journey looked like?" These answers are buried across spreadsheets, HRIS exports, and tribal knowledge. OrgLens was built to make organizational evolution visible, interactive, and actionable.
We were inspired by how fintech companies like Setel (PETRONAS) manage rapid restructuring — department splits, automation-driven role changes, and fast-track promotions — and wanted to build a tool that turns scattered HR data into a living, time-aware organizational map.
What it does
OrgLens provides dual-lens organizational intelligence:
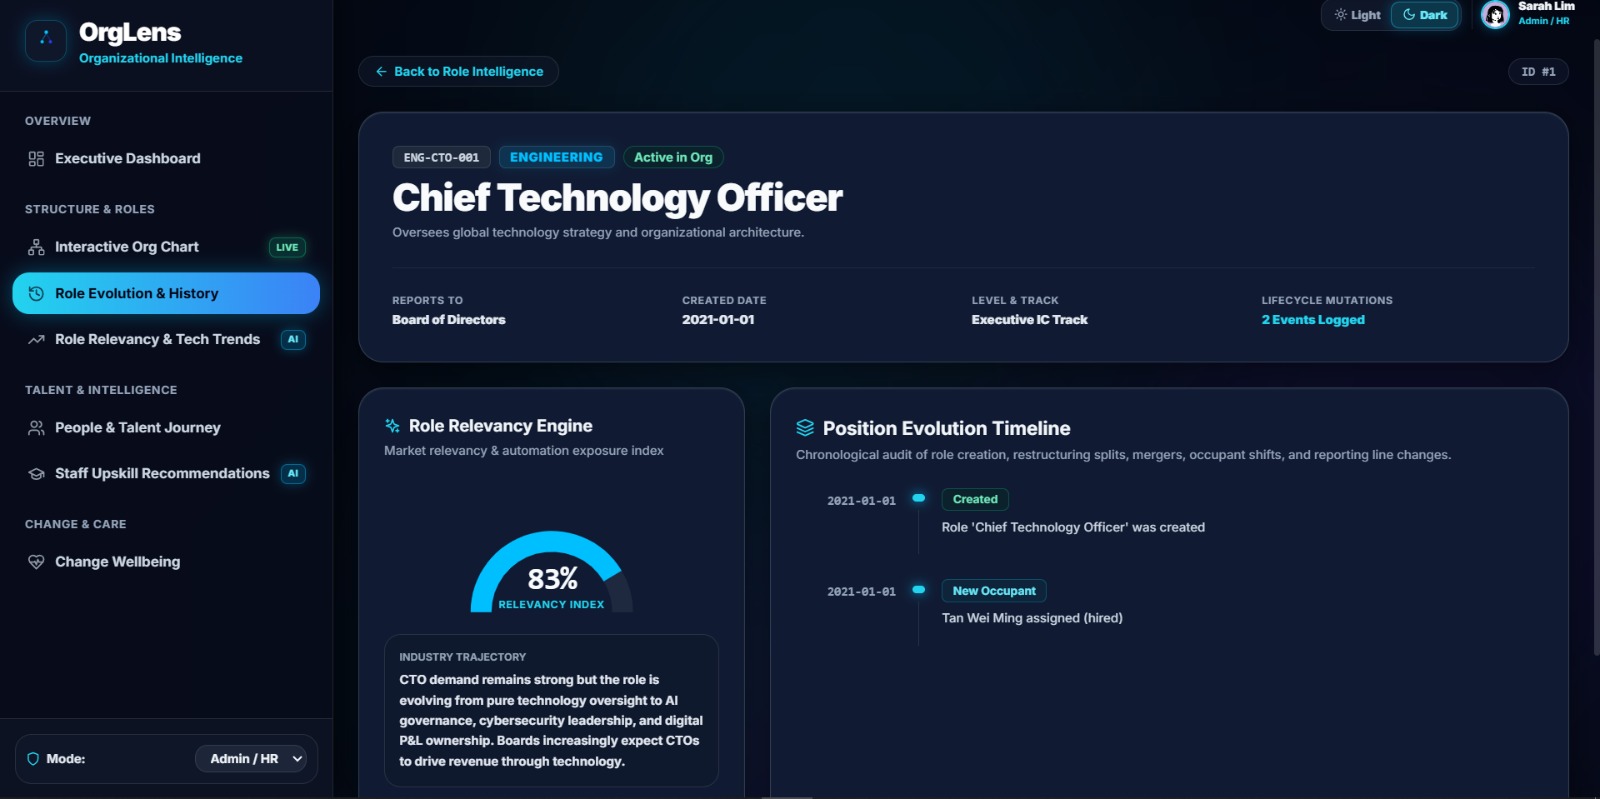
- Role Lens — Track how positions evolve: title changes, splits, mergers, reporting line shifts, tech stack relevancy scores, and automation risk indicators.
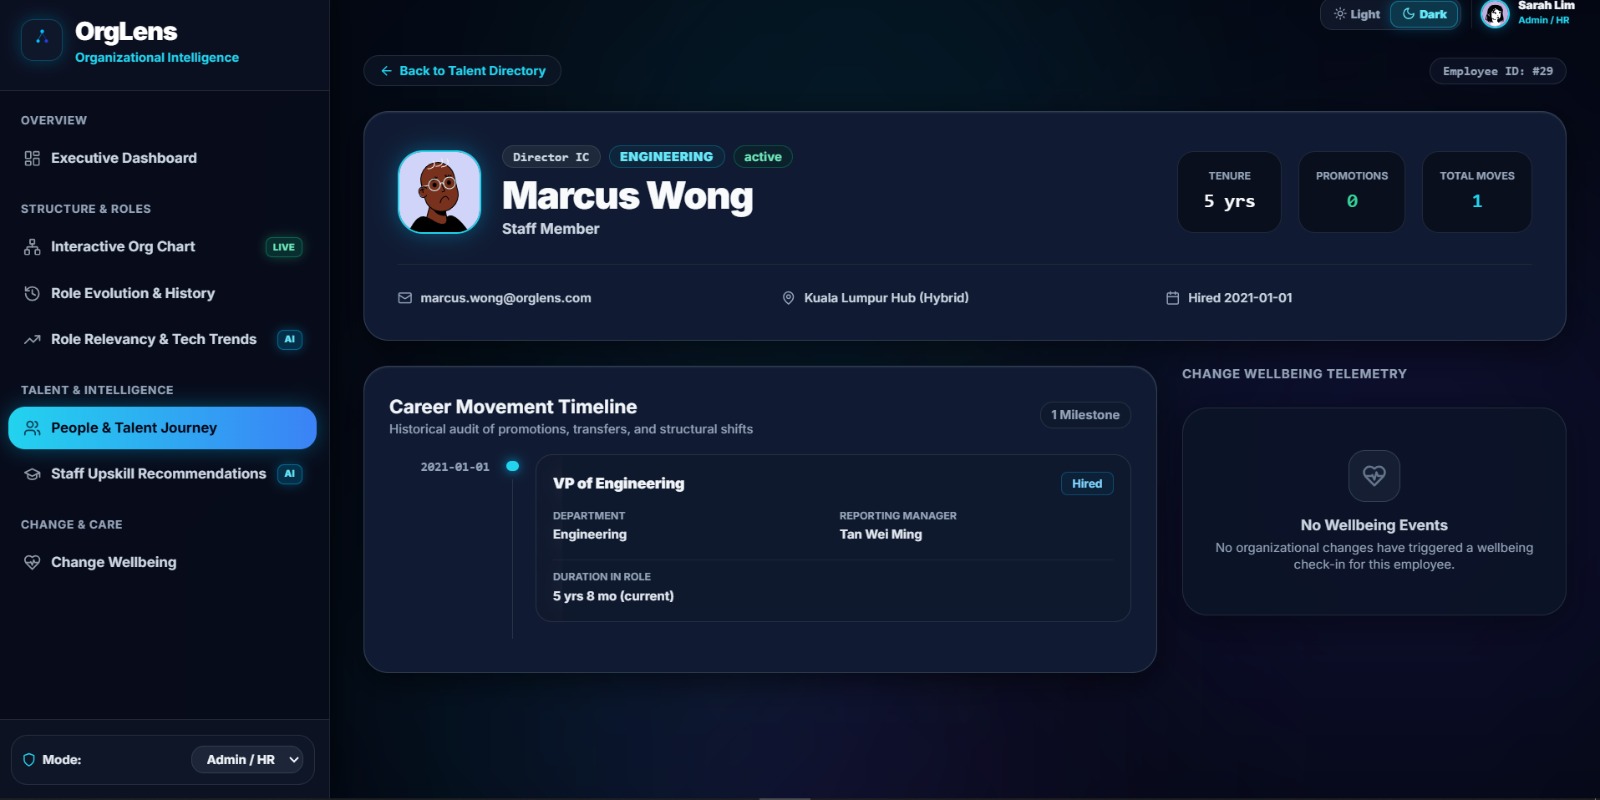
- People Lens — Visualize individual career trajectories: promotions, lateral moves, stagnation detection, and proactive wellbeing check-ins triggered by organizational change.
Key features include:
- Time-travel Org Chart — Scrub a timeline to replay how the org structure changed across restructuring events (2021–2025)
- AI Role Relevancy Engine — Scores every role against market demand using real industry trend data (Gartner, LinkedIn, SEA fintech benchmarks)
- Smart Upskilling Recommendations — Maps employees to real certification paths (CKA, AWS, Databricks, Playwright) based on their role's relevancy trajectory
- Change Wellbeing Telemetry — Automatically triggers supportive check-ins when employees experience multiple organizational changes
- Anomaly Detection — Flags stagnant careers, vacant positions, and missing reporting lines
How we built it
Backend: FastAPI (Python) with SQLite using a temporal, event-sourced schema. Every entity carries created_at, retired_at, and status fields. Career history lives in an assignments table that links people to roles over time.
Frontend: React 18 + Vite, with React Flow and Dagre for auto-layouted org charts, Recharts for data visualization, and Tailwind CSS for the glass-morphism UI. Axios handles API calls with a Vite proxy in development.
Data Model: 23 roles, 29 employees, 6 departments modeled after a fictional Malaysian fintech org with intentional storylines (fast-track promotions, QA automation transformation, platform engineering split, career stagnation).
Deployment: Render (Static Site + Web Service), with auto-seeding on first startup.
Challenges we faced
- Temporal data modeling — Representing "who held what role at what date" required careful schema design with overlapping date ranges and event-sourced mutations.
- Org chart layout — Getting 23 roles across 6 departments to render without node overlap required tuning Dagre's
nodesep,ranksep, andrankeralgorithms. - Relevancy scoring realism — Initially all roles showed the same score. We built per-role AI-generated assessments with historical progression to make it believable.
- Dual persona UX — Balancing what Admin/HR sees vs. what individual Staff sees required route guards, conditional rendering, and careful data scoping.
What we learned
- Event-sourced schemas make "time travel" features trivial once the data model is right
- Organizational intelligence isn't just dashboards — it's connecting the role story to the people story
- Proactive wellbeing check-ins triggered by structural change (not scheduled surveys) feel more human and less intrusive
- Real upskilling recommendations (actual Coursera/Udemy/Linux Foundation courses) make the product feel credible vs. generic placeholders
What's next
- PDF export of career journeys for performance reviews
- Slack/Teams integration for wellbeing check-in delivery
- ML-based career path prediction ("Based on similar profiles, your next move is likely...")
- Multi-org support for holding companies managing subsidiaries


Log in or sign up for Devpost to join the conversation.