Inspiration
Orecast helps prospectors, investors and landowners decide whether a patch of mineral land is worth buying, and how long it might take to sell it on.
We started with a simple question: if you could buy a cheap option on a patch of land (the right to buy it later at a fixed price), how would you know whether it's worth it, and how long you'd have to wait to sell it on?
The more we dug, the clearer it became that the hard part is time:
- The geology was sampled in 2016 and published months later.
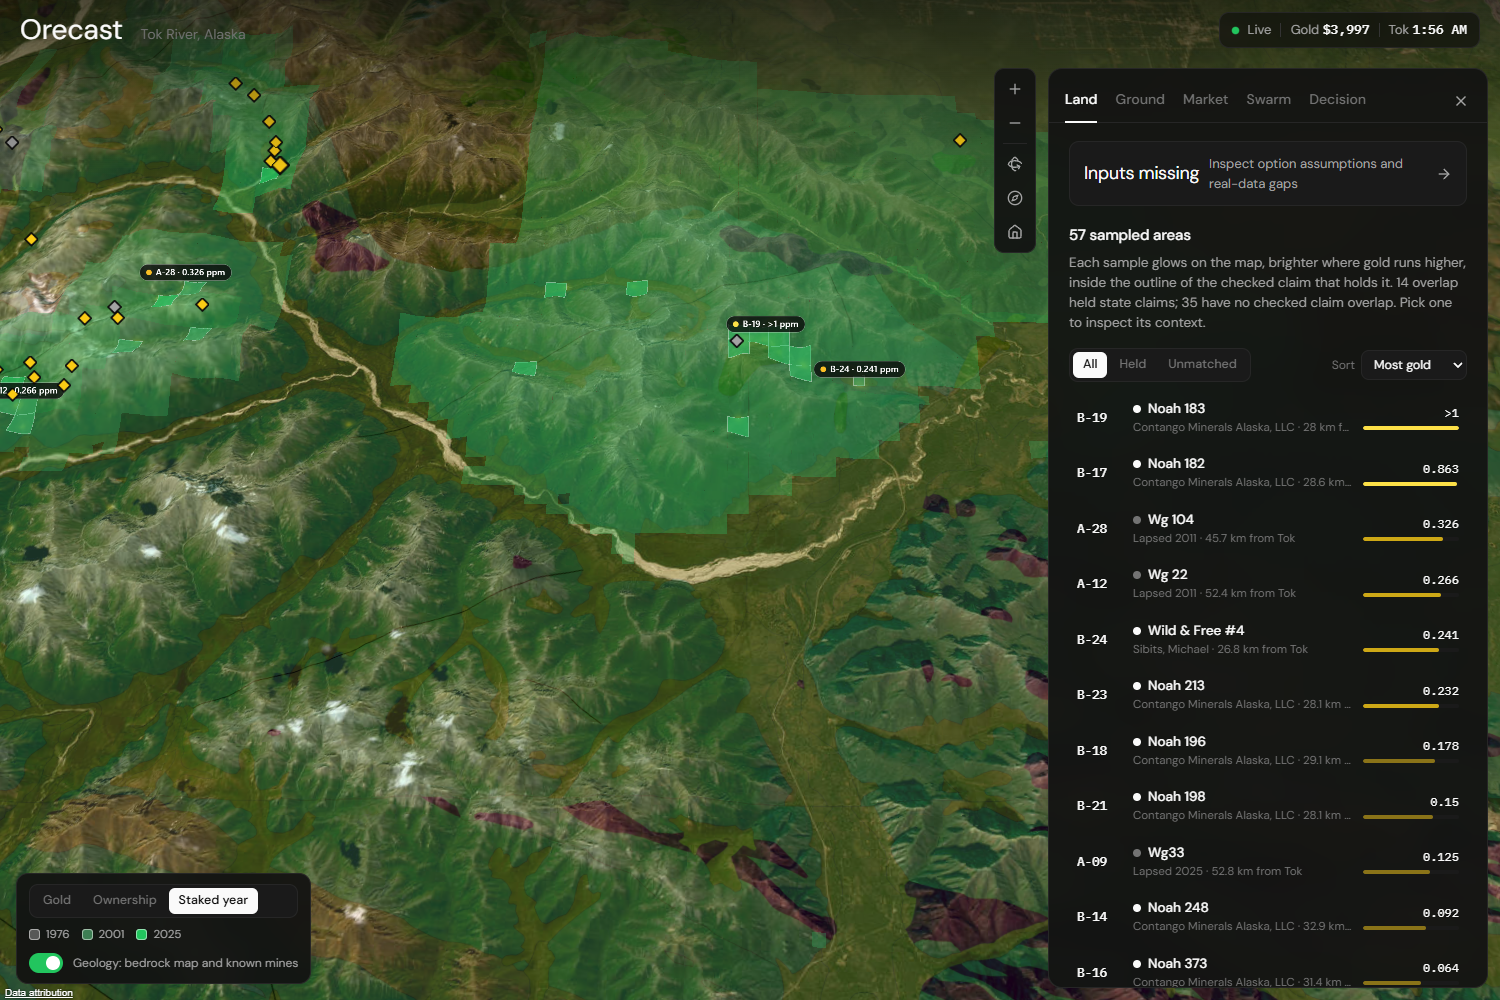
- The claims on that land have been staked, dropped and restaked since 1976.
- News moves the mood around a mine in days.
- A buyer for your option might show up in a month, or not for half a year.
Most tools look at one of those clocks. We wanted to put all of them on the same screen, for a real place, using real public data. We chose Tok River in Interior Alaska. The state has published stream-sediment assays there, the claim records are public, and there's real deal activity nearby. In September 2026 a deal was signed to sell a 249-claim project right next to one of our areas.
What it does
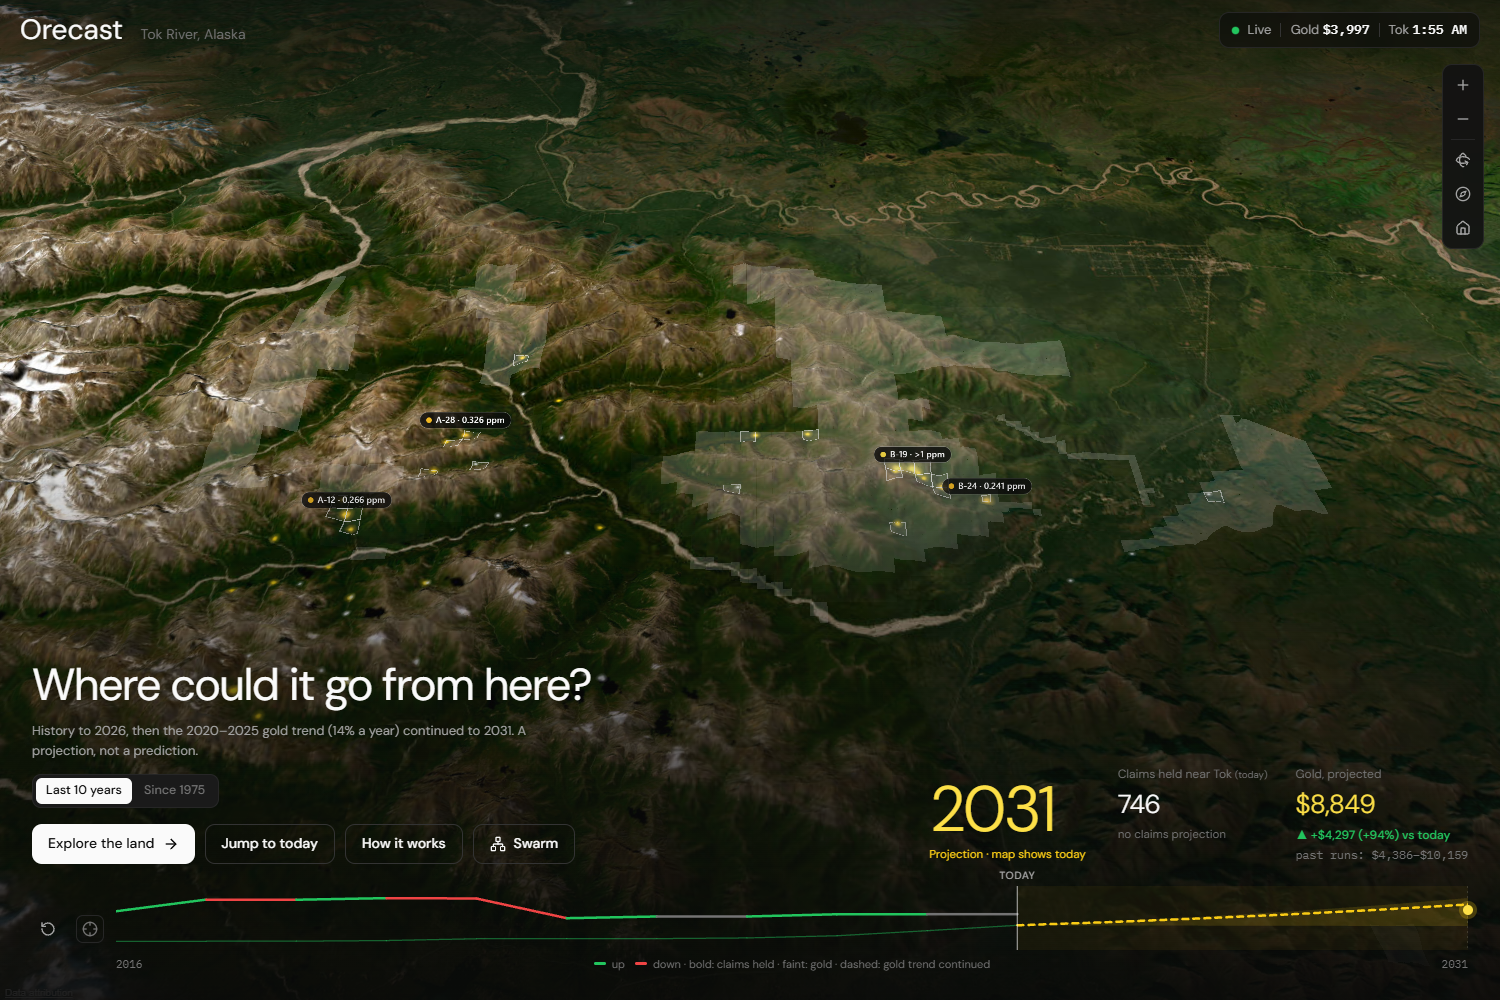
Orecast opens on a 3D globe of Tok River and a time-lapse. Claims held near Tok and the gold price play out year by year from 2016 to today. The 2020–2025 gold trend (about 14% a year) is then carried forward to 2031, clearly marked as a projection, not a prediction.
From there you can explore five layers:
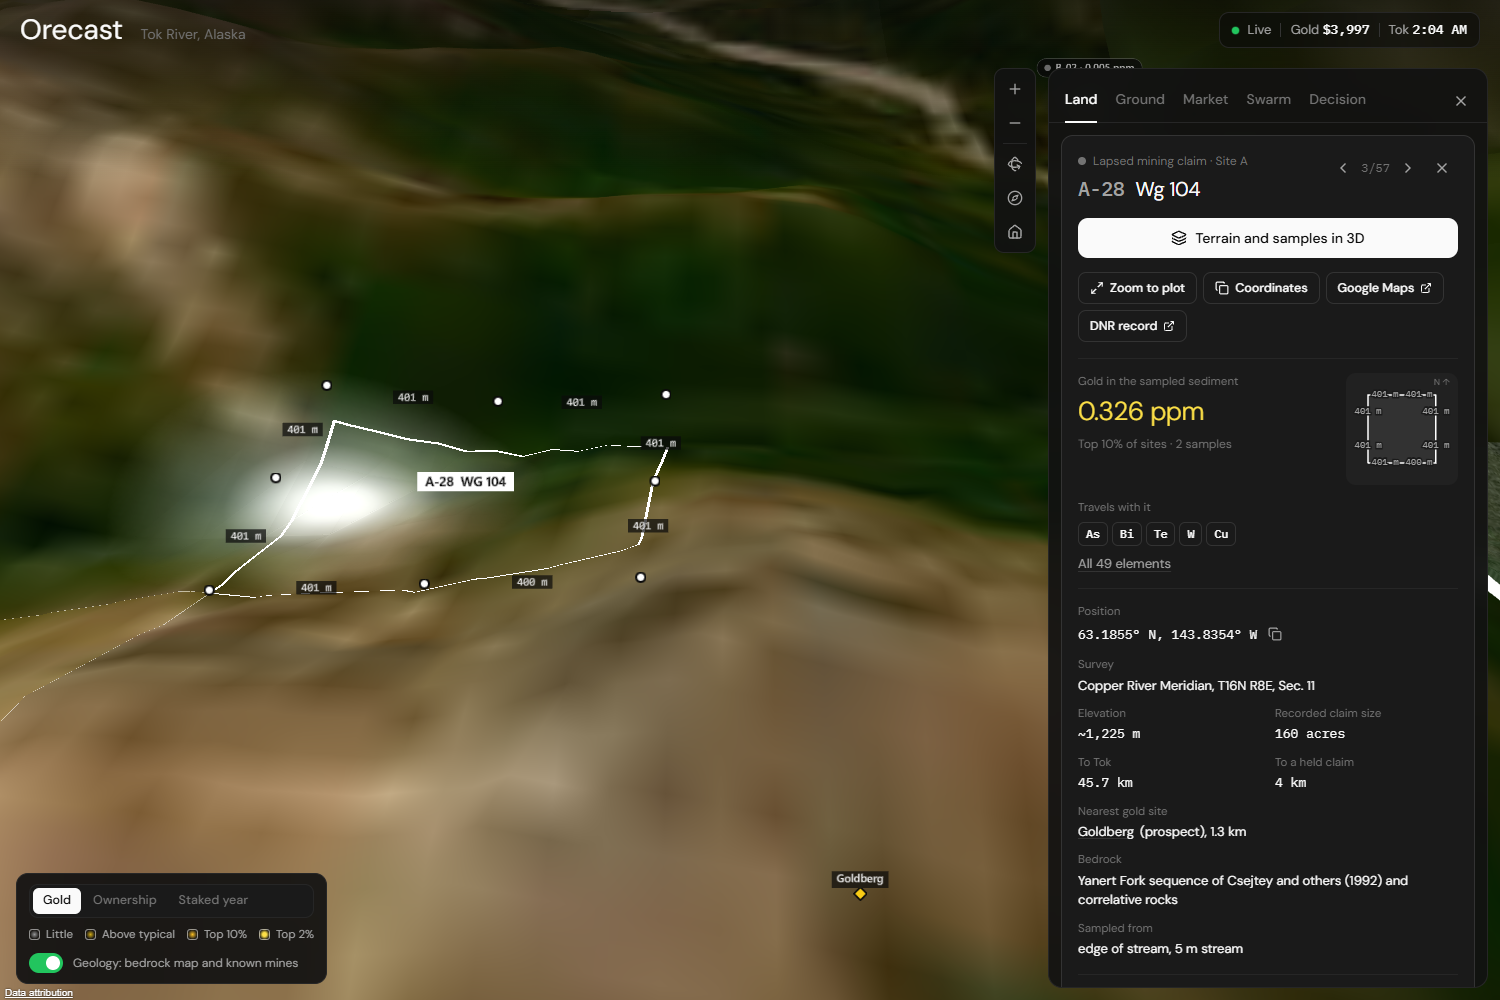
- Ground: 67 stream samples, each measured for 49 elements. 7 streams are in the top 10% for gold, and in most of them tungsten, tellurium and copper run high too. Geologists link that pattern to intrusion-related gold.
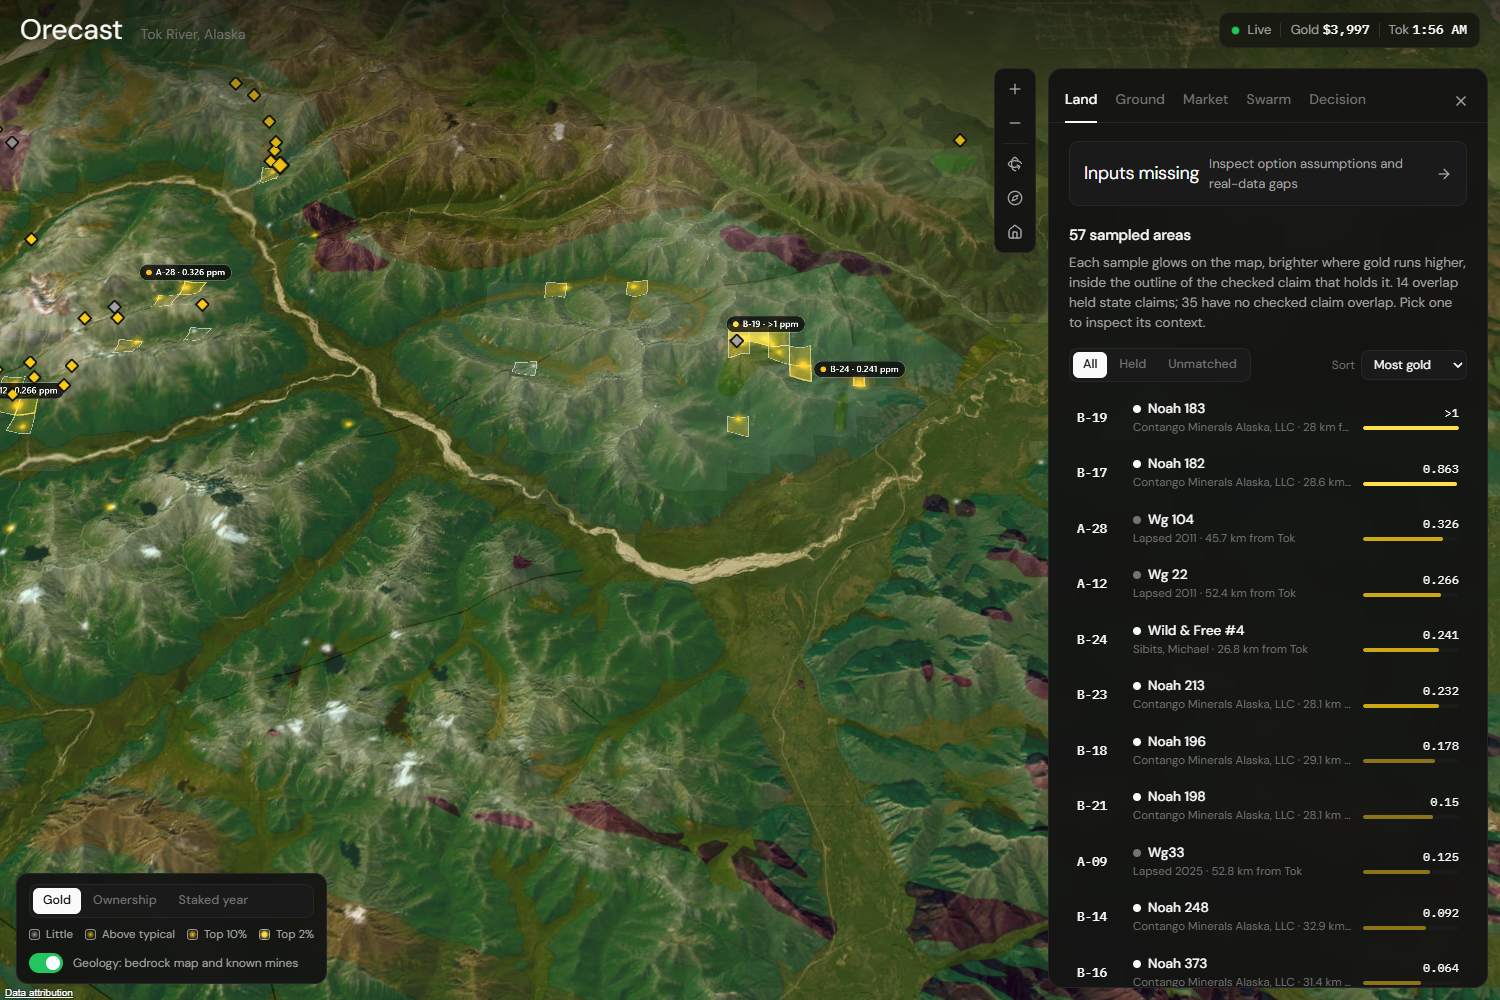
- Land: 1,469 real state claims near Tok, the first staked in 1976. You can see who holds each one today, when it was staked and which ones lapsed. Each sample has its own plot sheet.
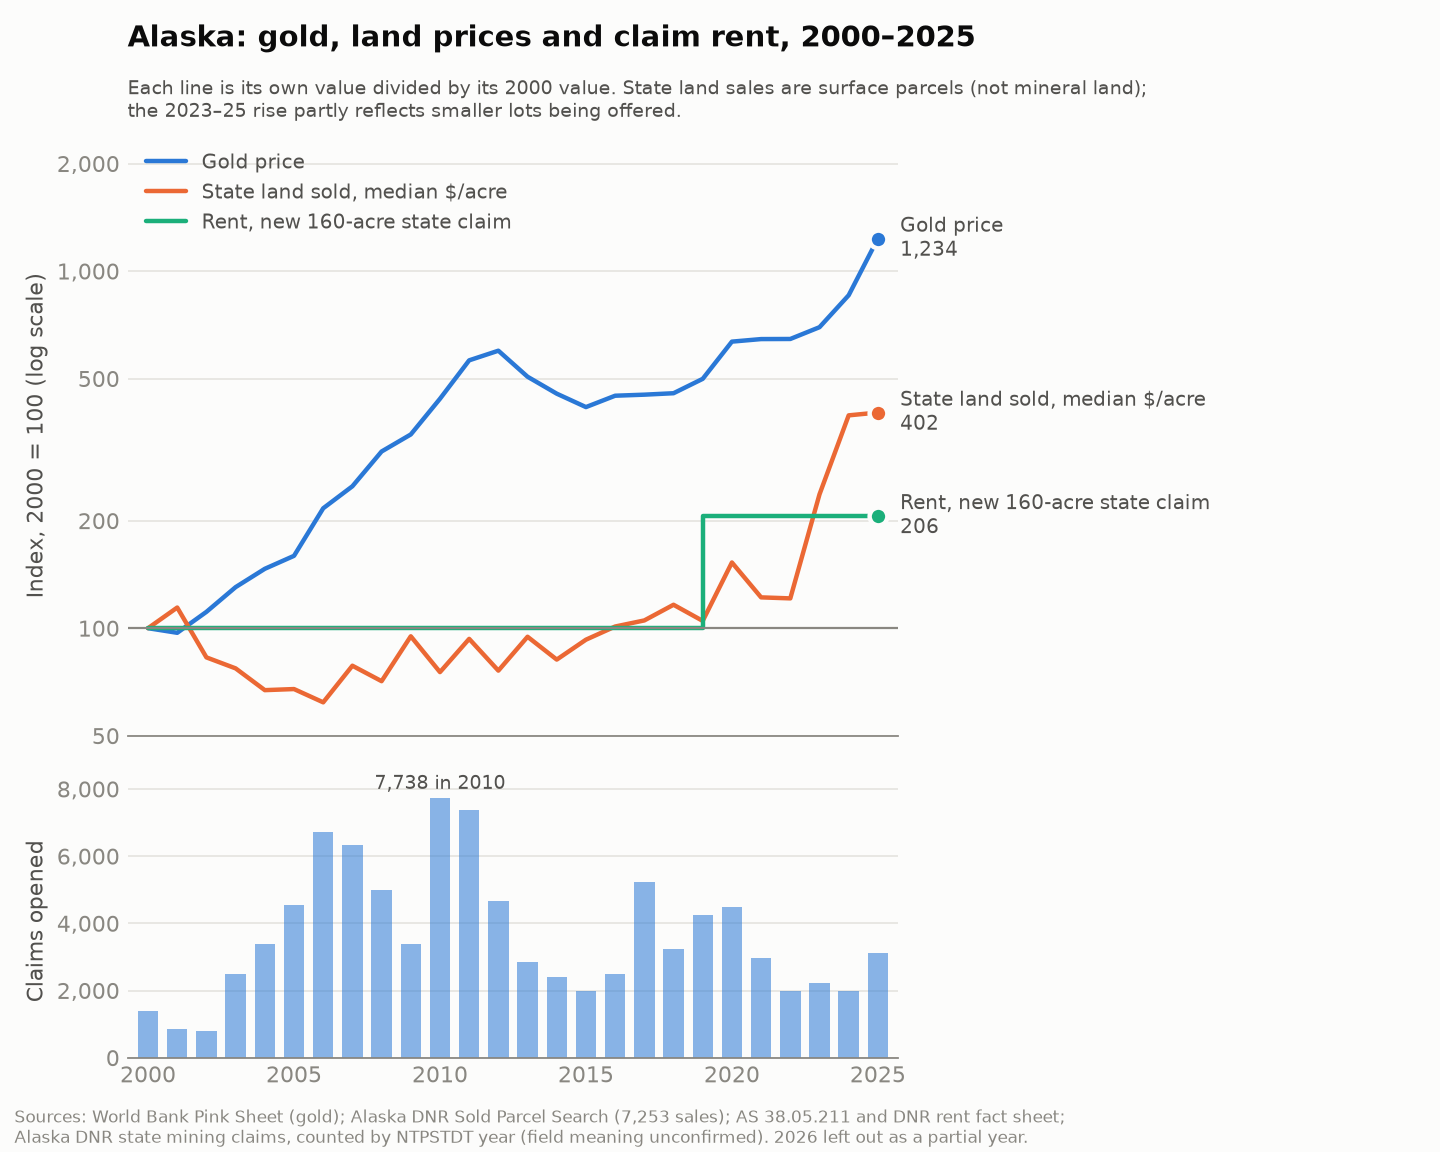
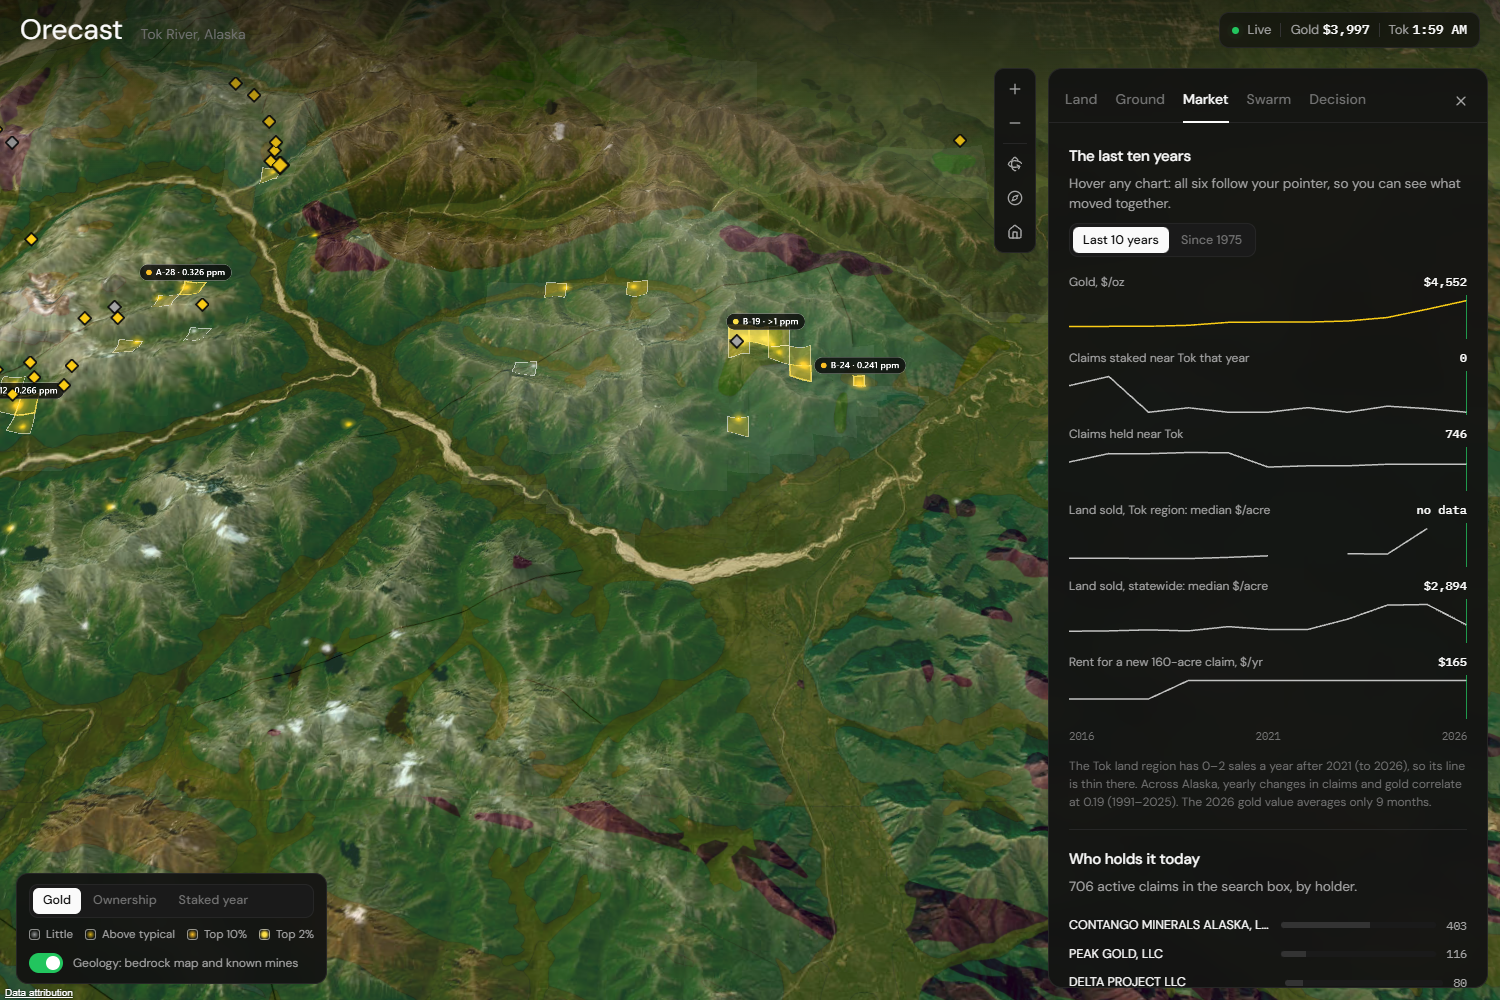
- Market: ten years of gold price, claims, land prices peron charts that move together. It also shows what companiesactually paid nearby, from $50k up to the $1bn Donlin deal.
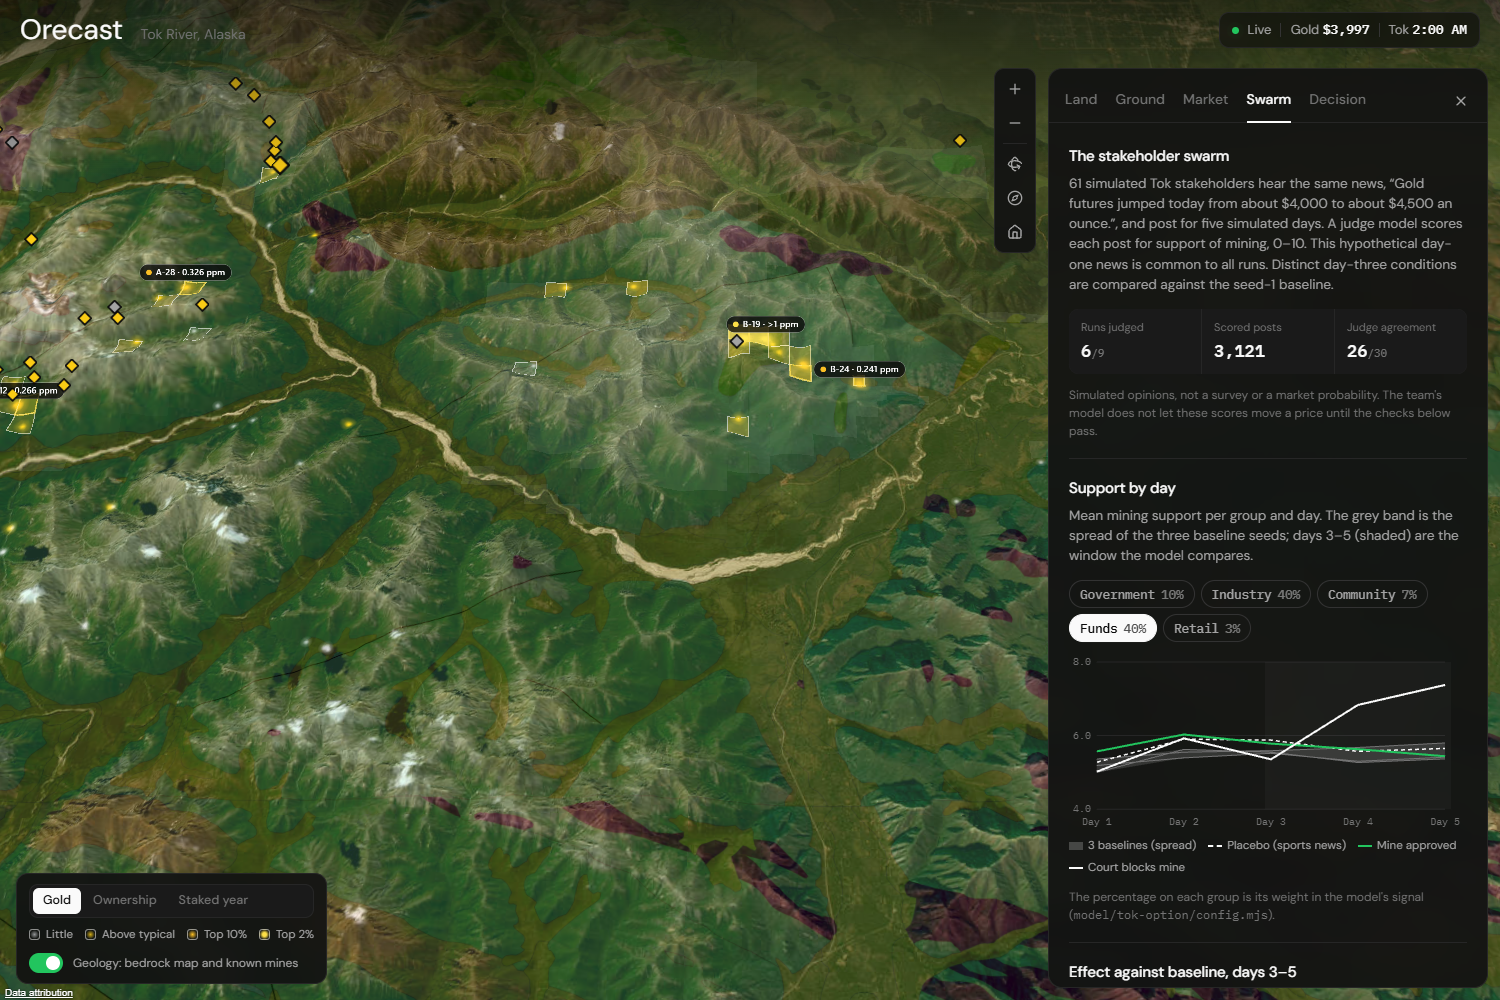
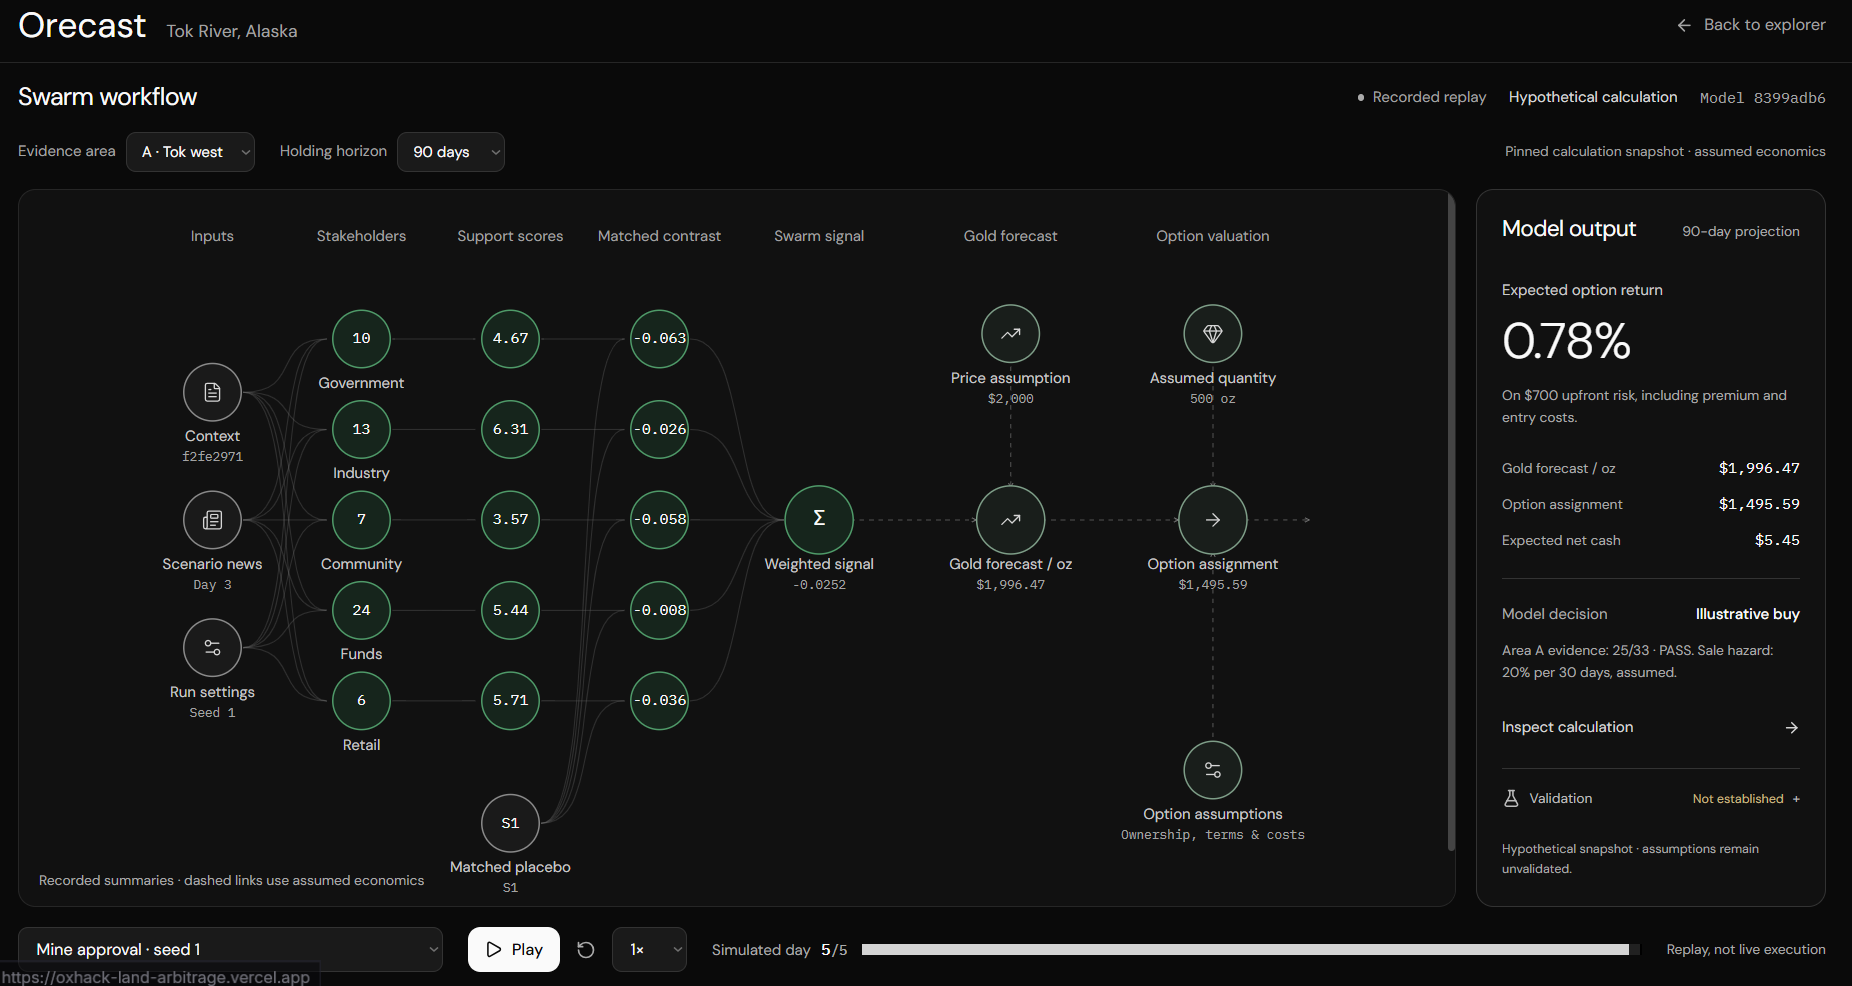
- Swarm (experimental): 61 simulated stakeholders react to We compare how a mine approval or a court blockage shiftstheir support. This layer is for exploring scenarios, not for making predictions.
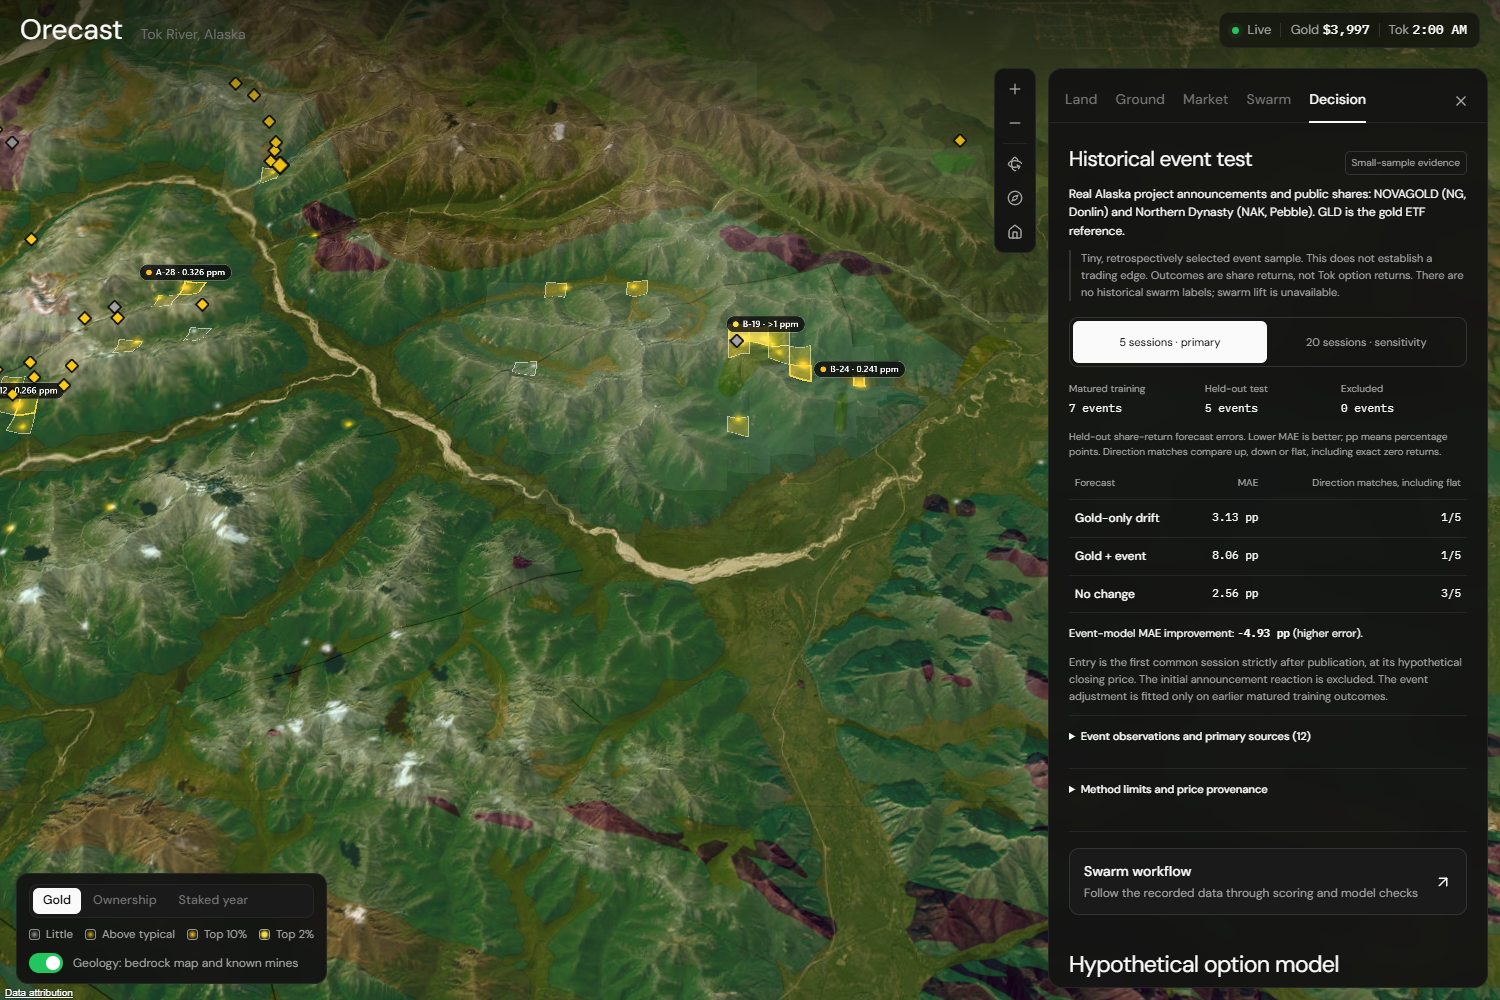
- Decision:
- The evidence gate: Area A passes: 25 of its 33 stream samples show gold, Area B fails with 16 of 34.
- The hypothetical option: about 1.1% average return at 90 dver sells.
- Then a historical event test on real Alaska mining announcements.
Every number on the screen says where it came from. Anything we don't actually know is shown as missing instead of being quietly filled in.
How we built it
- Data:
- Alaska DGGS sediment geochemistry
- DNR mining claims (we matched each sample to the claims that contain it)
- 7,253 state land sales, cross-checked against press releas
- claim rent from the statutes and BLM fees
- World Bank gold prices
- deals from SEC filings
- Swarm: MiroFish simulations. Five simulated days with nel scores each post 0–10. The runs are three baselines, a sports-news placebo, a mine approval and a court blockage. 6 runs , giving 3,121 scored posts.
- Model: a pure JavaScript engine used by the website, a Ct screens the evidence, values a hypothetical option, models the chance of a buyer in each 30-day window, and reports cash outcomes and break-even points.
- Event test: NOVAGOLD (Donlin) and Northern Dynasty (Pebberence. Training uses only events whose outcome was already known, and scoring is on events the model never saw. It's compared against "no change" and "gold-only drift".
- App: Next.js, React and a Cesium 3D globe. It deploys toe tests pass.
Challenges we ran into
- Public data is messy. The claims service dropped records land-sale search only answers one auction at a time, so we made about 770 requests and checked them against the press releases.
Accomplishments that we're proud of
- One timeline linking 2016 geology, 50 years of claims, five days of news and a 30/90/180-day exit.
- A genuine out-of-sample test: the event model's error was 8.o change". It lost, and the app says so plainly. That result is useful in itself: with this small sample, news-driven stock moves look mostly like noise, so the decision relies on the geology and land evidence instead.
- A land dataset for Tok built from official records.
- A live site anyone can open.
What we learned
- Time changes the answer: the same option loses at 30 day
- A positive average can hide a likely loss.
- **Simulated people are great for exploring scenarios and bad
What's next for Orecast
- Real option prices and real sales
- A bigger event sample
- BLM and Native corporation land on the map
Built With
- cesium
- claude
- convex
- esri
- javascript
- mirofish
- next.js
- node.js
- openai
- python
- react
- three.js
- typescript
- vercel


Log in or sign up for Devpost to join the conversation.