About the project
ORCHESTRATOR is a no-code trading platform that empowers users to trade equities, crypto, and forex with the same tools used by quant and high-frequency trading (HFT) firms.
Build visually — create strategies, define buy/sell logic, choose time ranges and conditions — then run and backtest them without writing a line of code.
What inspired this
I wanted a small, practical playground that brings quant-style tools to non-programmers. The goal was simple: make it possible to sketch trading ideas visually (think Scratch for trading), validate them quickly against historical data, and then run them automatically. That intent drove two priorities: (1) the platform had to behave sensibly with real market data, and (2) it had to be robust when live data is missing (so the UI is always usable).
What I built
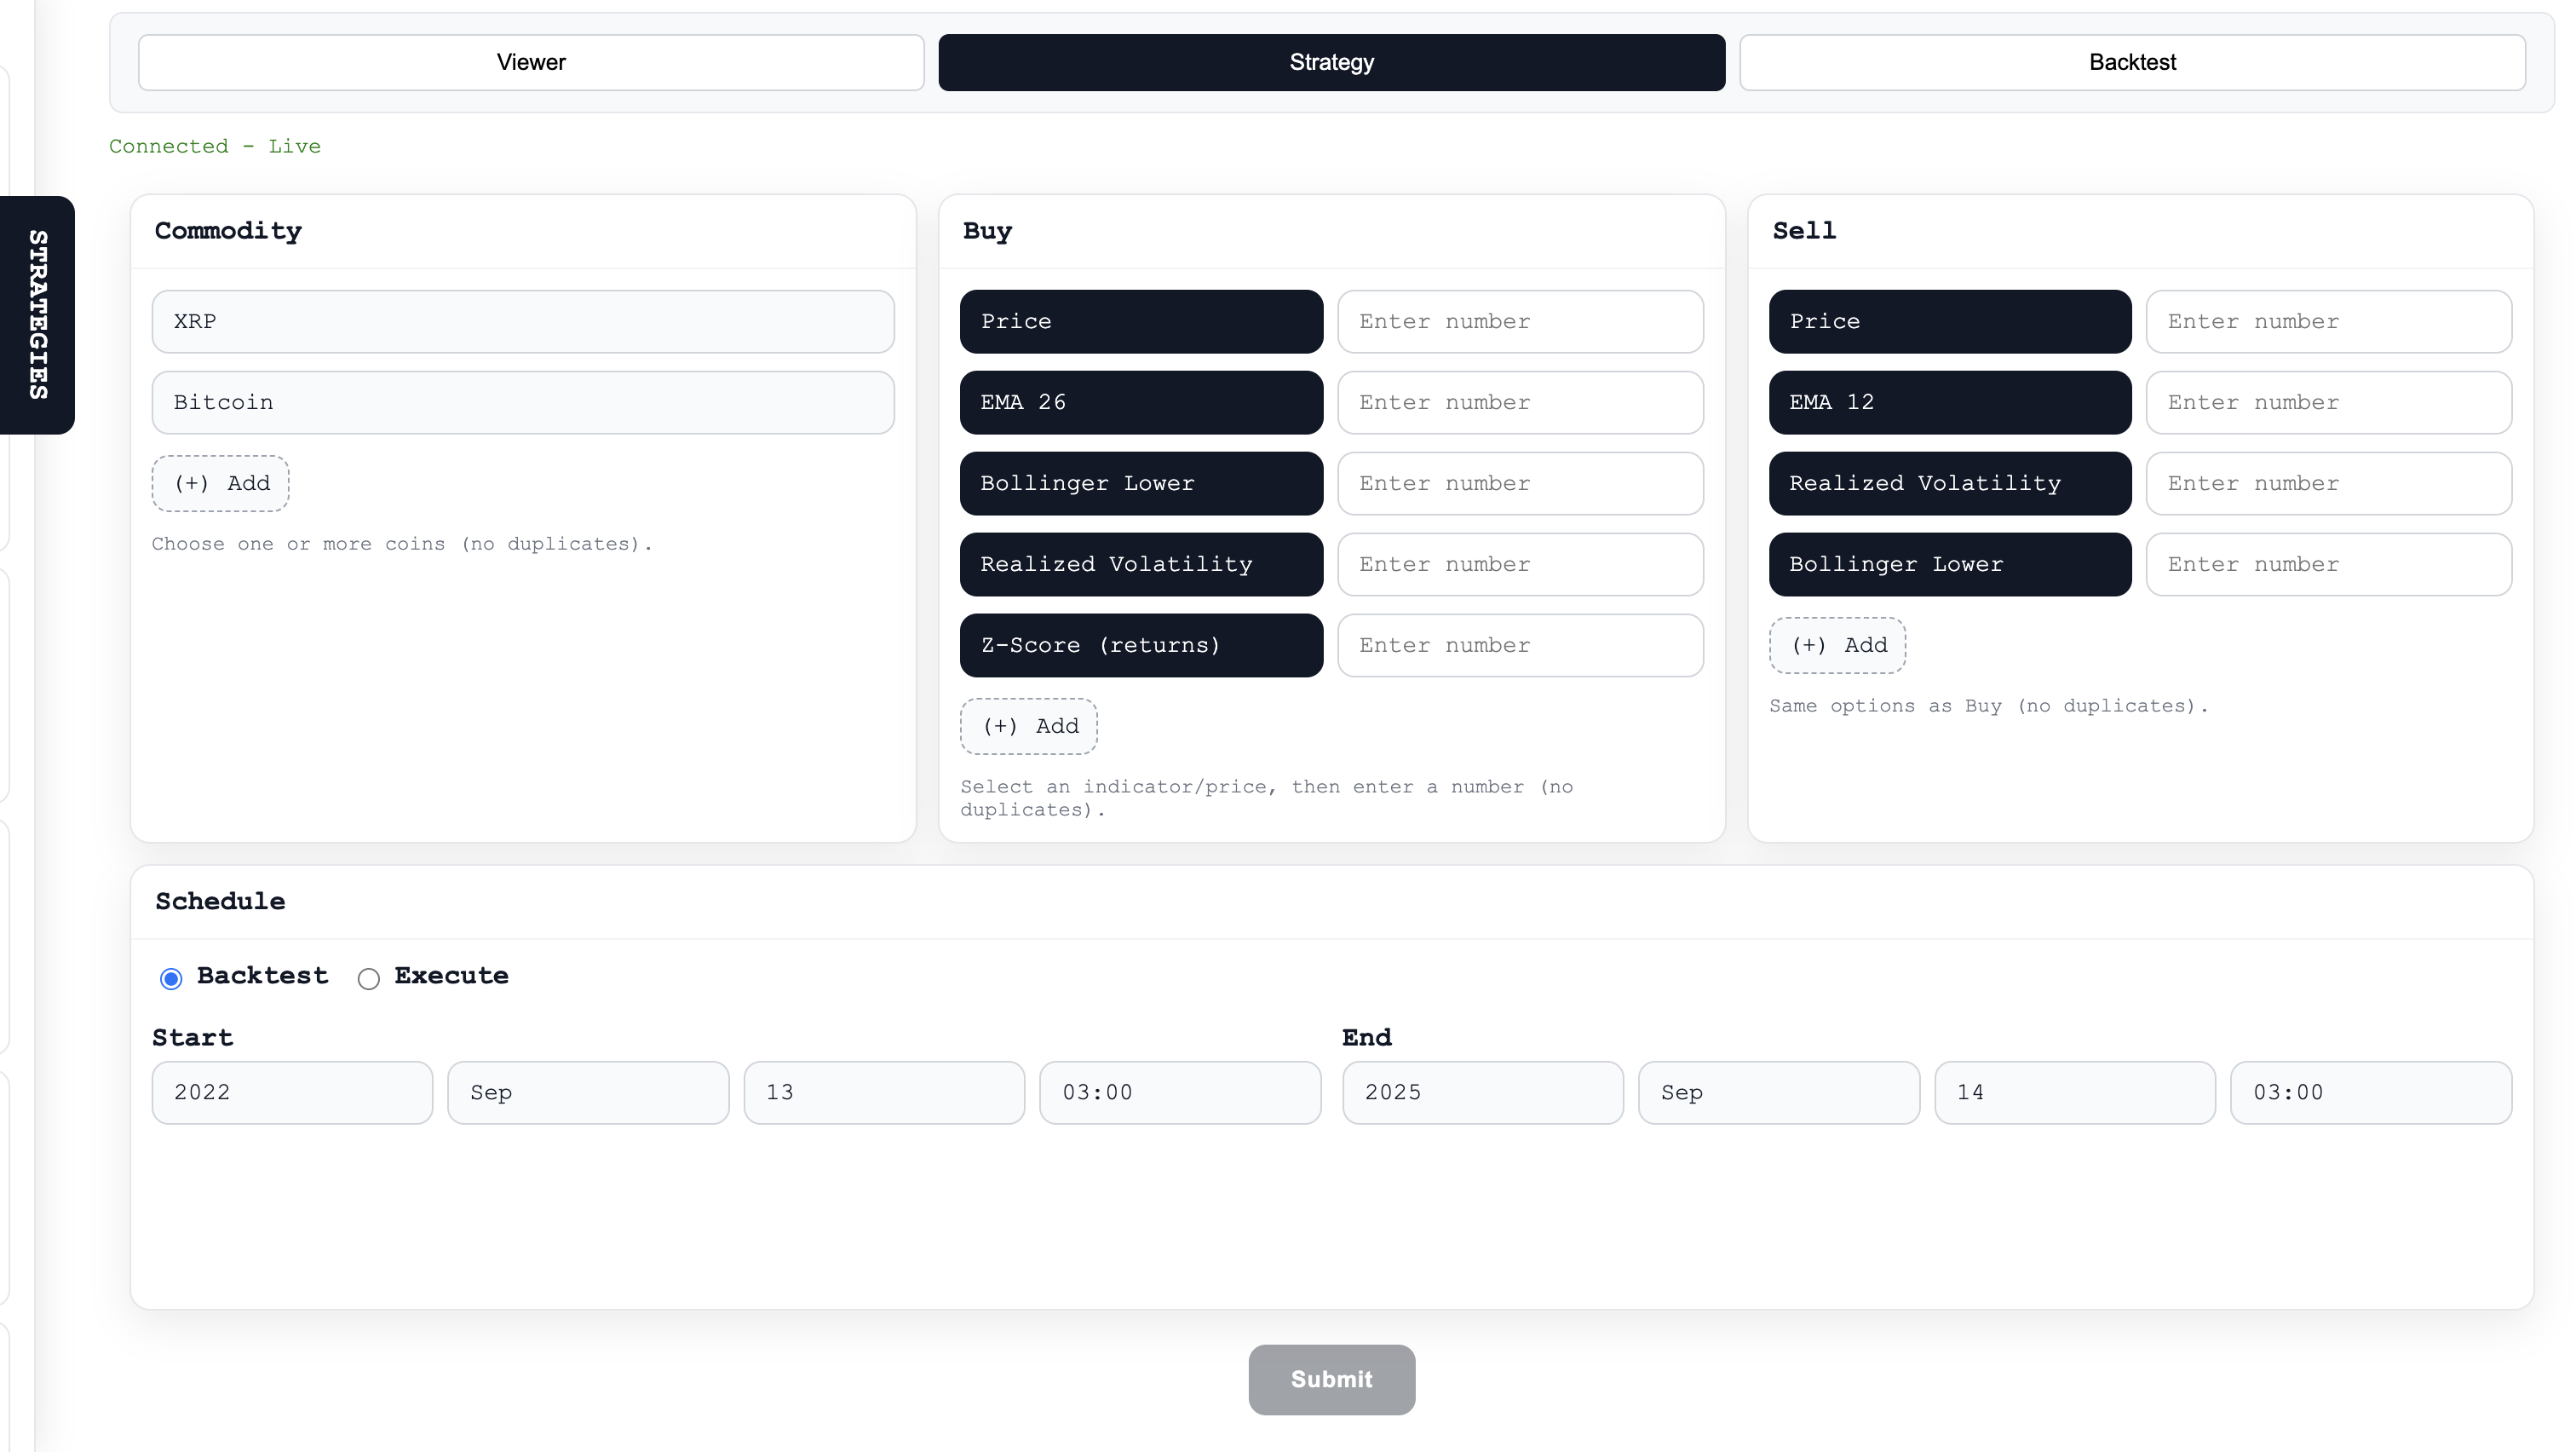
- Strategy builder (no-code): Drag-and-drop / form-driven flow to pick assets, add buy/sell conditions, and schedule runs. Strategies are single-entry / single-exit for quick hypothesis testing.
- Indicators: Server-side implementations of SMA/EMA, Bollinger Bands, Z-scores, realized volatility, and simple VPIN/Hawkes proxies so users get the same signals the backend uses for backtests.
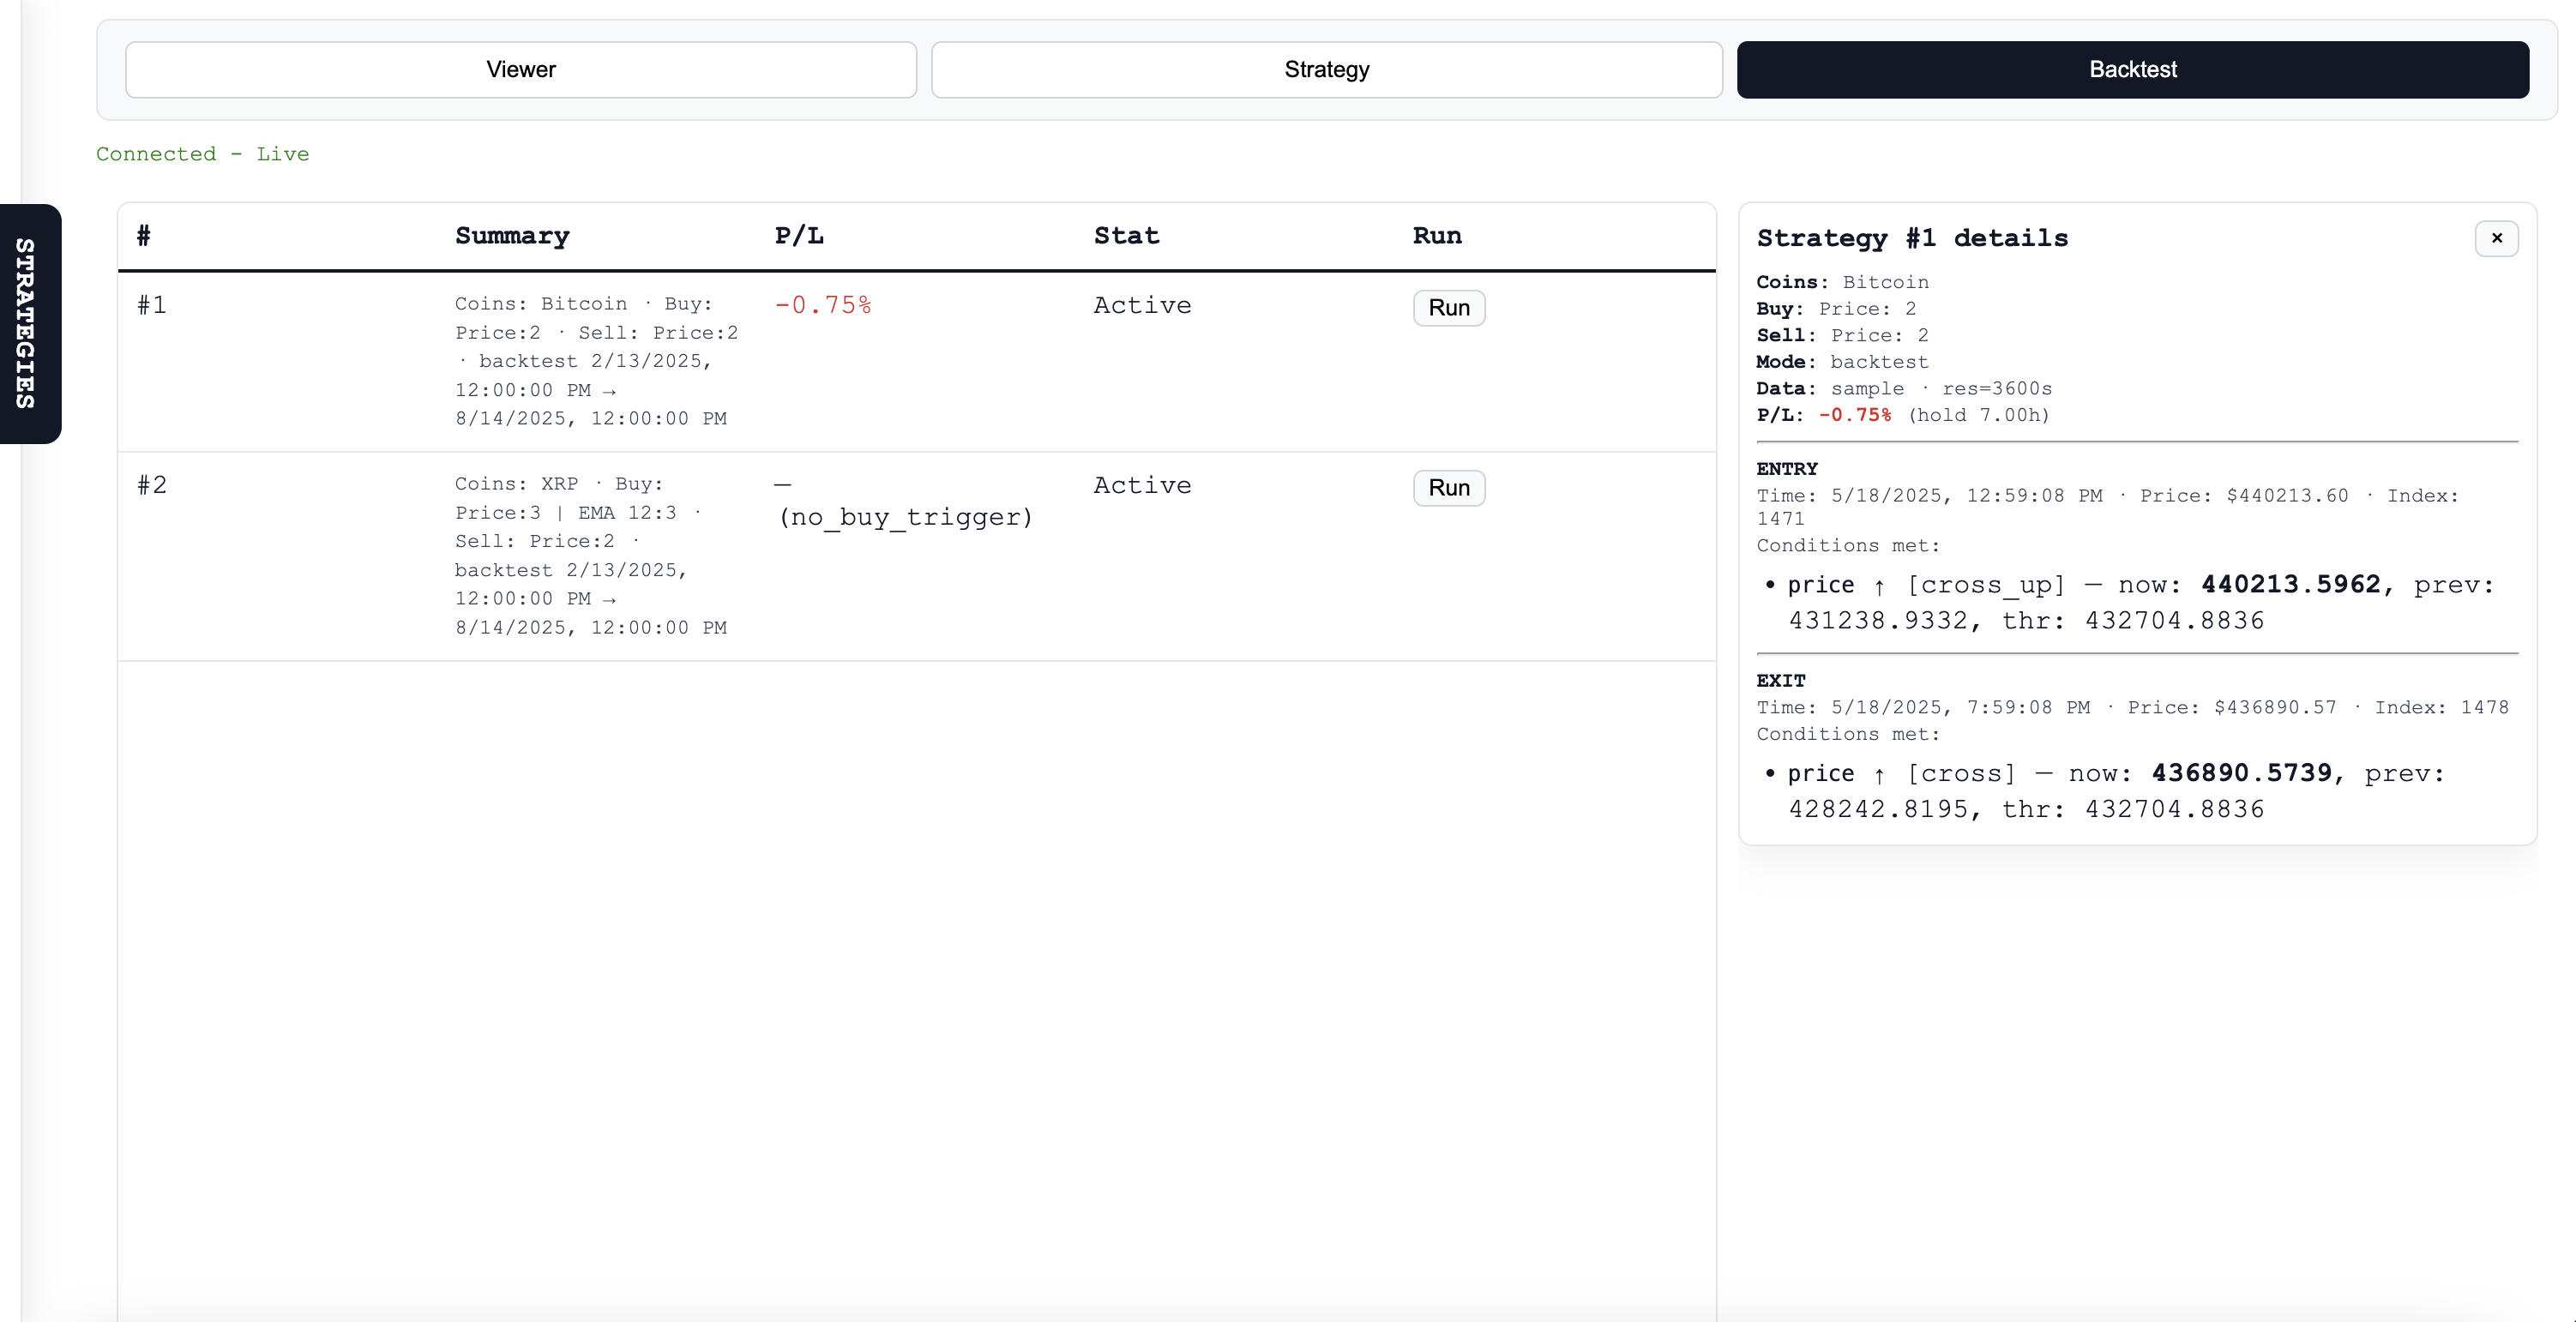
- Automation: Once a strategy is defined, it can run automatically. The system records the entry and exit events and reports P/L.
- Backtesting: Single-run backtester that fetches historical candles (multi-resolution attempts) and, if necessary, falls back to a deterministic synthetic candle generator so tests are reproducible offline. The backtester returns the P/L and the exact entry/exit trades that produced it.
How it’s implemented (high level)
- Backend: Python + FastAPI. A background thread consumes a Finnhub WebSocket trade stream, appends trades to a fixed-length buffer, and an
IndicatorCalculatorcomputes indicators on demand. - Backtester:
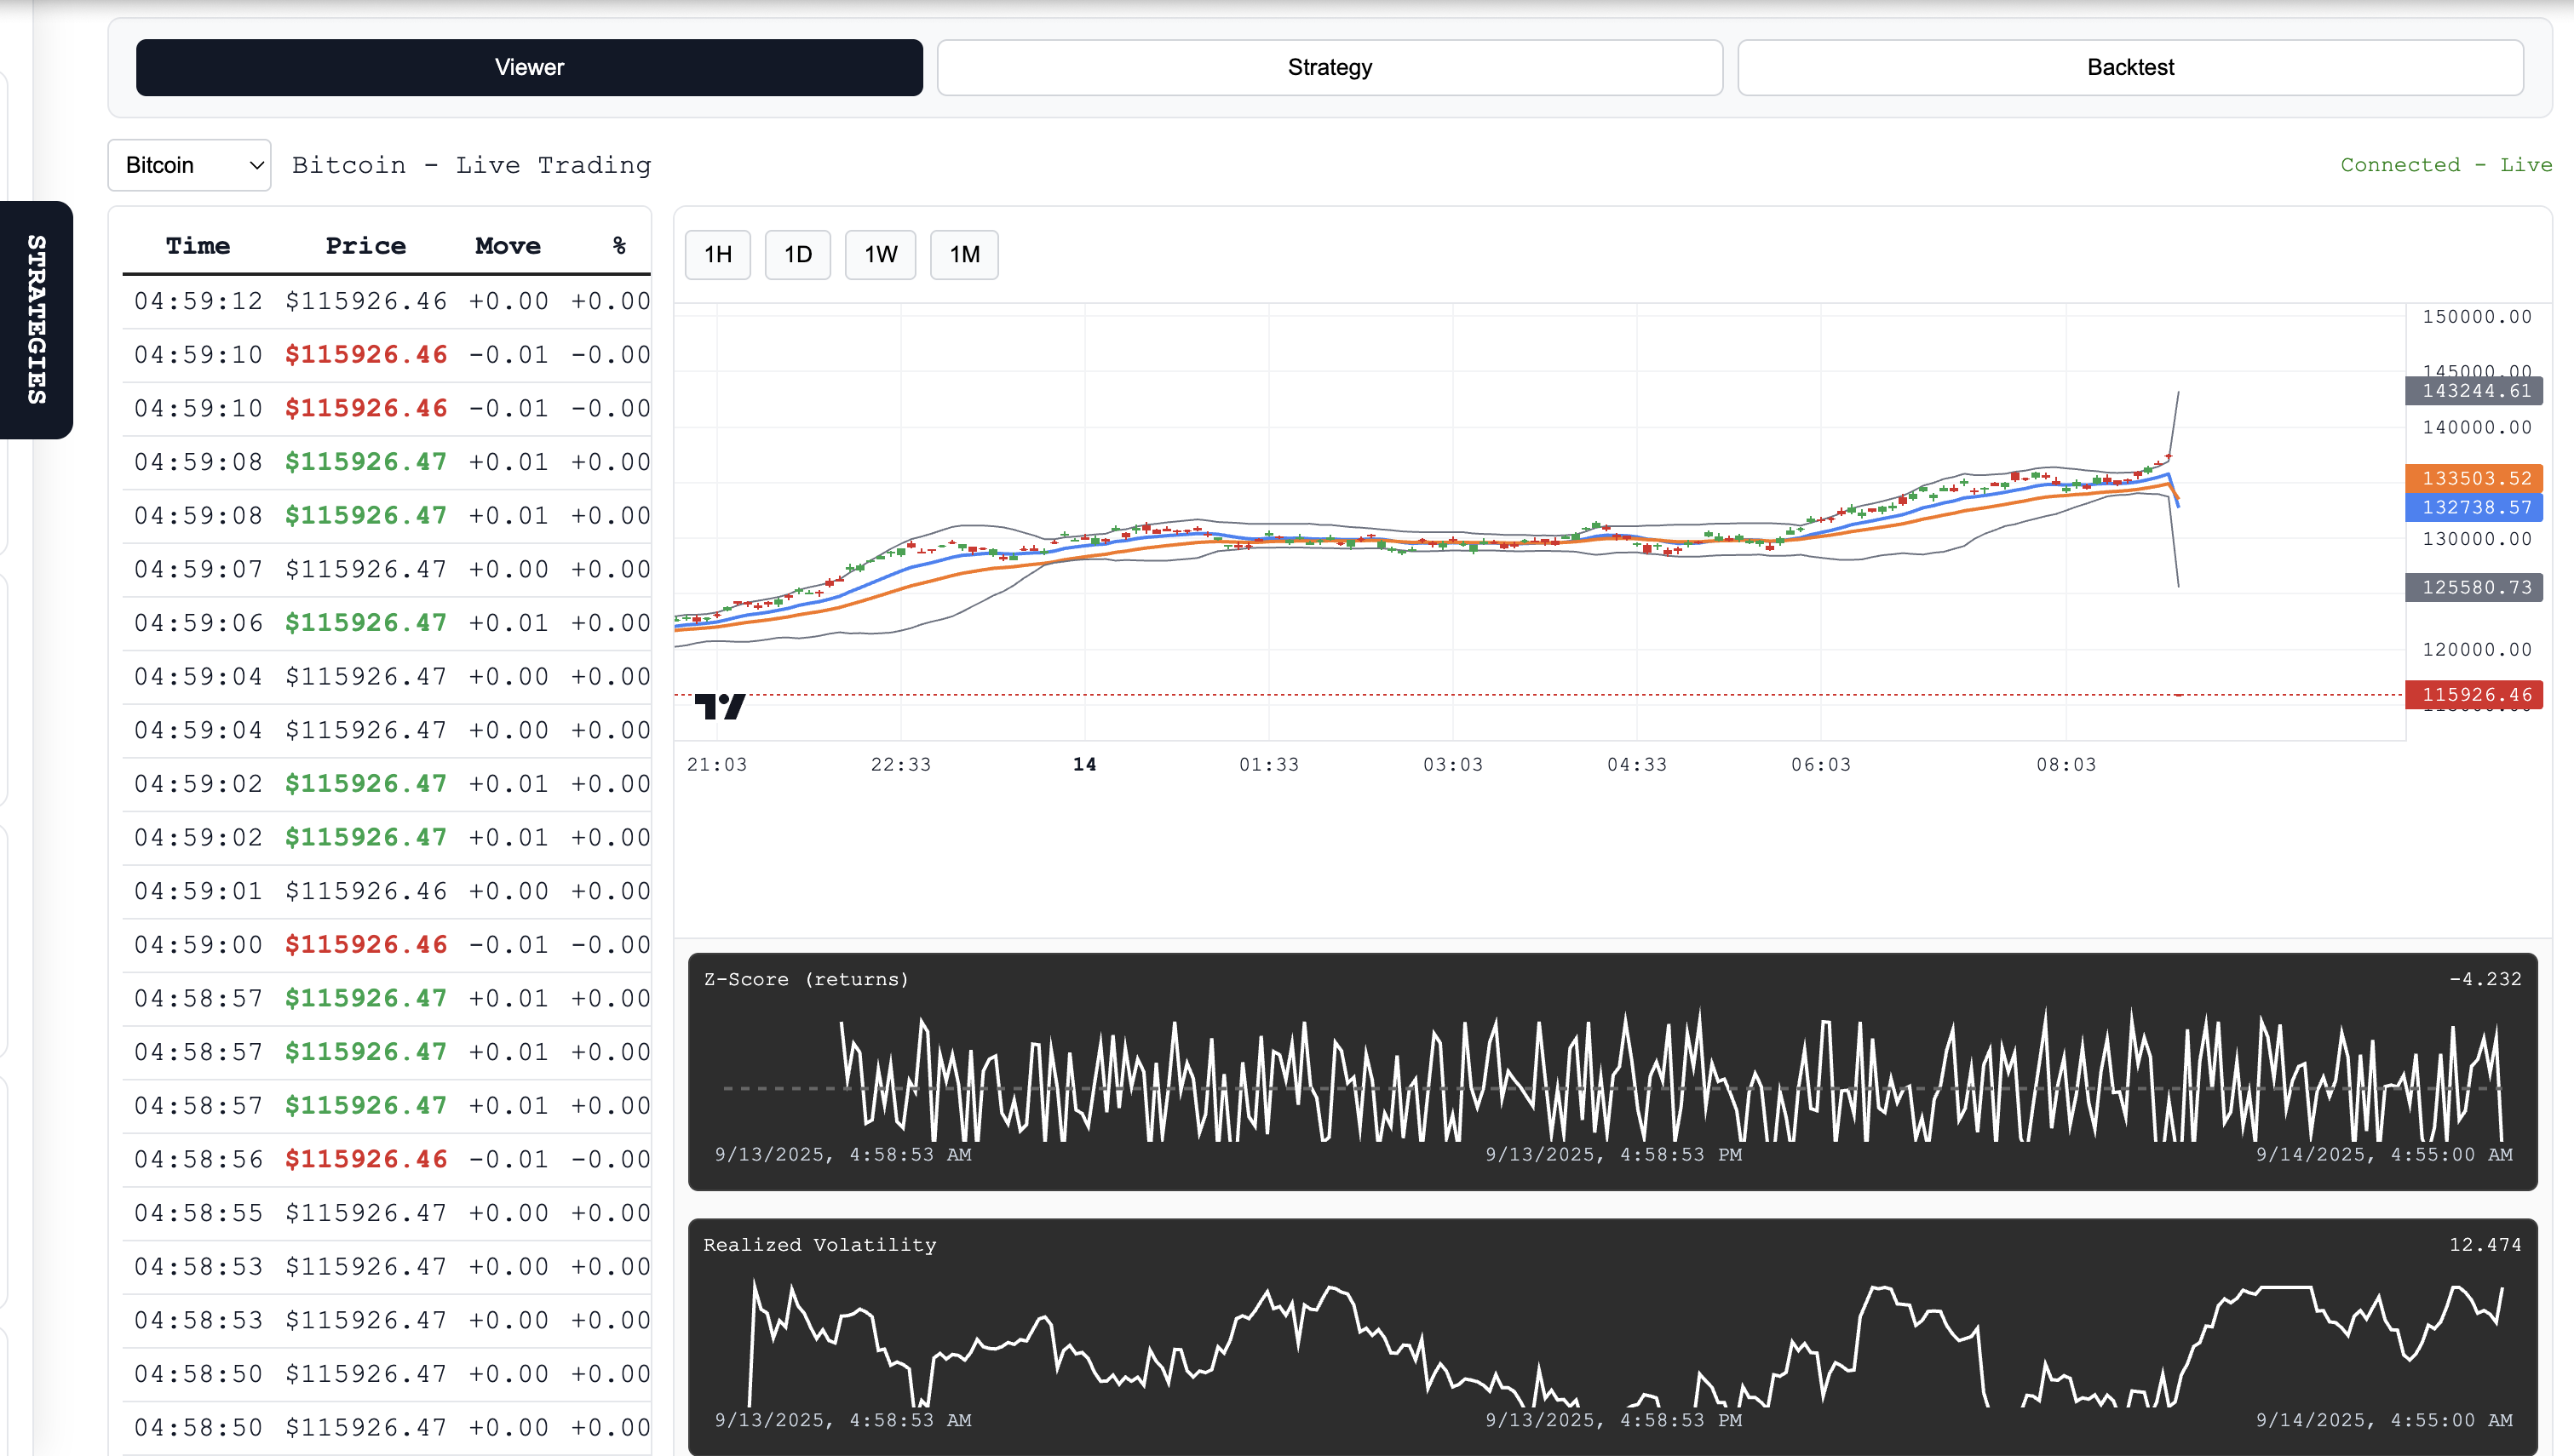
POST /api/backtestfetches Finnhub candles (tries multiple resolutions), computes the same indicators over the historical window, finds the first buy trigger and the first subsequent sell trigger, and returns P/L plus detailed snapshots (time, price, which conditions fired). Small numeric thresholds are treated as percentages around the median price when appropriate so “2” can mean “+2%” instead of \$2 for large-scale assets. - Frontend: Single-page HTML/JS using Lightweight-Charts for candlesticks and a couple of canvas mini-plots. The UI polls
GET /api/price, loads history fromGET /api/history, shows indicator overlays, and calls/api/backtestto compute and display backtest results and the trade path.
What I learned
- Aligning server and client math is crucial — a tiny difference in EMA or rolling windows produces surprising visual and backtest mismatch.
- Real data is messy: multi-resolution fetching + a synthetic fallback makes demos reliable.
- UX matters for backtests: naive level checks will buy/sell on the first bars; crossing/edge logic and percent-vs-absolute threshold inference are necessary to make the tool useful.
Challenges faced
- Data availability: Finnhub sometimes returns sparse data for certain resolutions or symbols. Solved with a prioritized resolution fetch and a deterministic sample generator.
- Backtest semantics: Users expect profit targets to be “above” the buy and stops to be “below.” Added direction inference, crossing detection, and an “edge” fallback that requires a false→true transition to avoid trivial triggers.
- Threshold ambiguity: Users often type small numbers expecting percentages; to avoid misinterpretation the system detects price scale and converts small thresholds into percent targets automatically.
- Keeping UI and server consistent: Had to mirror formulas in both places so overlays and backtests align visually.
Core math (short)
Exponential moving average (EMA)
The EMA is a smoothed average that gives more weight to recent prices. To compute it you:
- Choose a window length N (number of periods).
- Compute the smoothing factor alpha as "two divided by (N plus one)". In words: α = 2 / (N + 1).
- Initialize the first EMA value (commonly using the first price or the simple moving average of the first N prices).
- For each new time step t, update EMA by taking alpha times the current price plus (1 − alpha) times the previous EMA.
- This means the EMA at time t = α * (current price) + (1 − α) * (previous EMA).
- This means the EMA at time t = α * (current price) + (1 − α) * (previous EMA).
- Smaller N produces a noisier EMA that follows price more closely; larger N produces a smoother, slower EMA.
Annualized realized volatility (from log returns)
Realized volatility is estimated from the standard deviation of log returns computed over a rolling window. To get an annualized volatility:
- Compute log returns at the chosen sampling cadence (for example, every minute or every second).
- Over a rolling window of those returns, calculate their standard deviation; call this σ_window (the per-sample volatility).
- Convert σ_window to an annual scale by multiplying by the square root of the number of samples per year. The number of samples per year is "seconds per year divided by the sampling interval in seconds." Seconds per year is 365 × 24 × 3600.
- In plain terms: annualized volatility = σ_window × sqrt( (365 × 24 × 3600) / Δt ), where Δt is the sampling interval in seconds (e.g., Δt = 60 for 1-minute samples).
- In plain terms: annualized volatility = σ_window × sqrt( (365 × 24 × 3600) / Δt ), where Δt is the sampling interval in seconds (e.g., Δt = 60 for 1-minute samples).
- Important: use log returns consistently (same definition on client and server) and identical rolling-window logic to avoid mismatches.
Note: both indicators above require consistent handling of missing data, initialization choices, and windowing on client and server to ensure visual overlays and backtests match.
Tradeoffs & next steps
- The backtester is intentionally simple (single entry, single exit, first-match semantics). That keeps behavior predictable but isn’t a replacement for a production backtest engine (no slippage, fees, or multiple entries).
- Next improvements: add order sizing, simulate slippage/fees, support multiple entries/exits, persist results to a lightweight DB, and add a campaign runner to compare different strategies systematically.
Built With
- css
- fastapi
- finnhub
- gemini
- html
- javascript
- numpy
- pandas
- python
- uvicorn
- websockets


Log in or sign up for Devpost to join the conversation.