Inspiration
Ever since learning about the thousands of exoplanets NASA has discovered, I’ve been fascinated by how astronomers find planets orbiting stars light-years away. They don't see them directly—they measure tiny dips in starlight when a planet passes in front of its star. However, over half of these signals turn out to be false alarms caused by eclipsing binary stars or background star noise. I built OrbitIQ as a solo high school research project to see if machine learning and astrophysical domain knowledge could accurately separate real planet candidates from false positives.
What it does
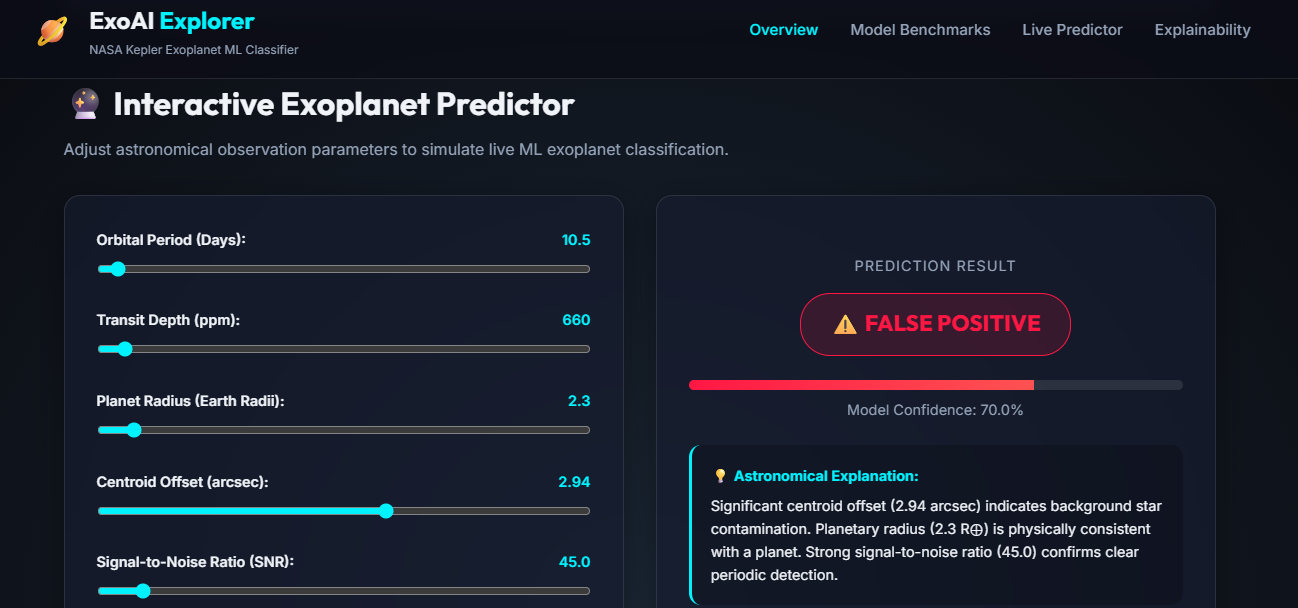
OrbitIQ is an explainable machine learning system that analyzes observational transit data from NASA's Kepler Space Telescope (KOI_Cumulative_clean.csv) containing 9,566 celestial targets. It classifies signals into confirmed exoplanets/candidates versus false positive noise with a 98.85% F1-Score and 0.9987 ROC-AUC. OrbitIQ also features an interactive web dashboard that simulates live planet candidate predictions and provides plain-language explanations for why a signal was flagged.
How we built it
- Data Preprocessing & Cleaning: Cleaned 9,566 NASA Kepler Observations and dropped identifier metadata columns (
kepid,rowid) to prevent data leakage. - Astrophysical Feature Engineering: Engineered 5 physical features based on celestial mechanics:
- Centroid Offset Distance: sqrt(ΔRA² + ΔDEC²) to detect background star light contamination.
- Signal-to-Noise Ratio per Transit: SNR / sqrt(N) to filter out one-off camera glitches.
- Planetary-to-Stellar Radius Ratio: Rp / (109.2 * R*) to catch double star eclipses mistaken for giant planets.
- Thermal Insolation Consistency: Teq / (S^0.25) to verify stellar heat balance.
- False Positive Flag Sum: Aggregating NASA's core diagnostic flags.
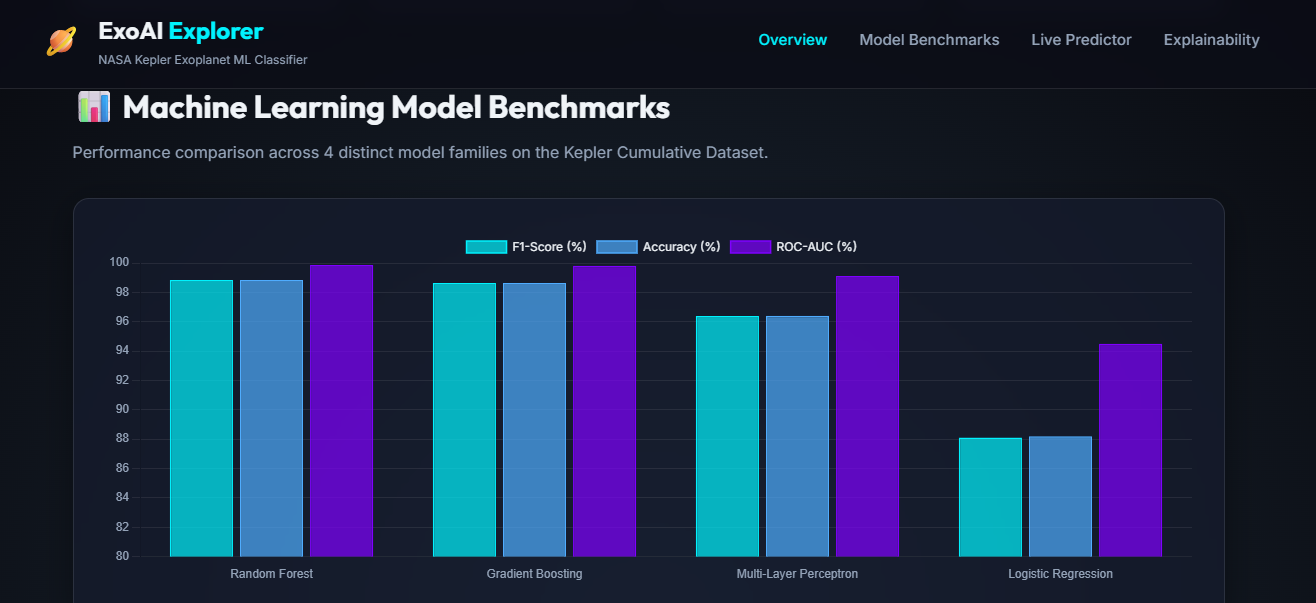
- Machine Learning Benchmark: Trained and evaluated Logistic Regression, Random Forest, Histogram Gradient Boosting, and a Multi-Layer Perceptron (NN) using an 80/20 stratified split in Python (
Scikit-Learn,Pandas). - Interactive Research Dashboard: Built a web dashboard using HTML5, CSS3 Glassmorphism, JavaScript, and Chart.js to let users test observation inputs live.
Challenges we ran into
- Handling Class Imbalance & Missing Data: Nearly half of the NASA dataset consisted of false positives, and several uncertainty columns had missing values. I solved this by using median imputation and stratified cross-validation.
- Data Leakage & Overfitting: Early on, raw ID columns and diagnostic comment flags threatened to artificially inflate accuracy. Removing identifier metadata ensured the model learned true physics rather than memorizing dataset labels.
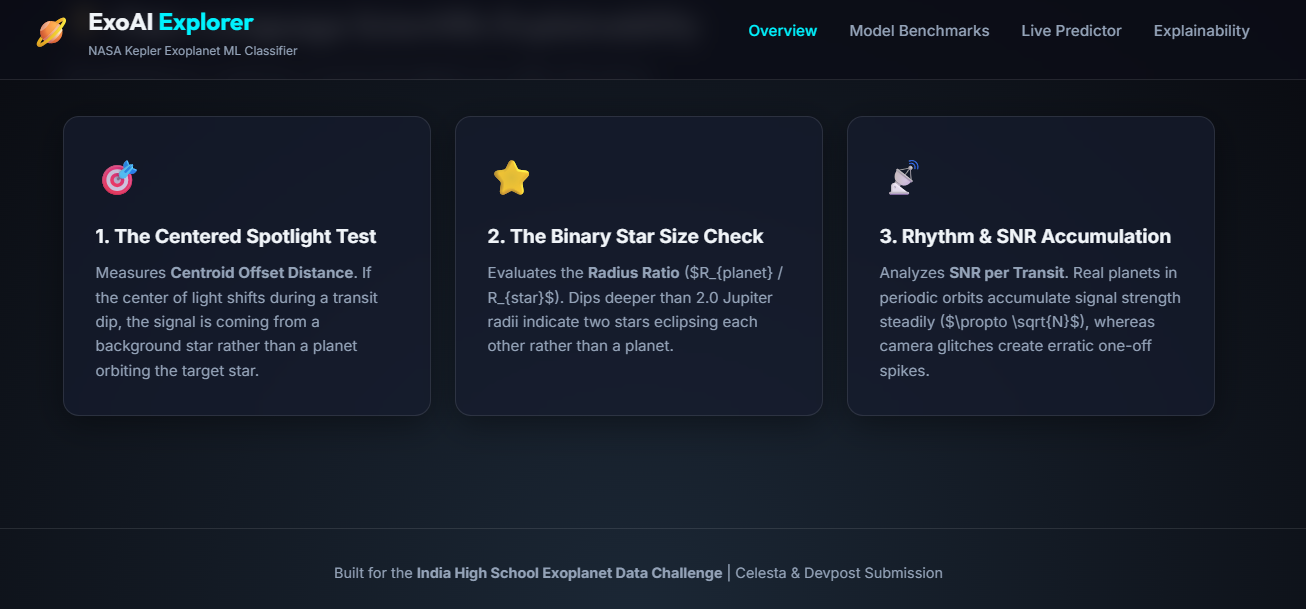
- Making ML Explainable: Translating complex model decisions into plain language without losing scientific accuracy was challenging. I created 3 core explanation rules (Centered Spotlight, Binary Size Check, Rhythm Accumulation) for non-technical audiences.
Accomplishments that we're proud of
- Achieving 98.85% F1-Score and 0.9987 ROC-AUC with the Random Forest model.
- Building 5 custom astrophysical features grounded in celestial physics rather than relying solely on raw numerical data.
- Creating a fully functional, interactive research dashboard (
dashboard/index.html) alongside a reproducible Jupyter Notebook (exoplanet_classification.ipynb). - Completing this entire end-to-end research project as a solo high school participant.
What we learned
- How space telescopes use transit photometry to detect exoplanets.
- How tree-based ensemble models (Random Forest & Gradient Boosting) outperform basic neural networks on structured astronomical tabular data.
- The importance of domain feature engineering in boosting ML performance.
- How to write explainable AI outputs that non-technical judges and space enthusiasts can easily understand.
What's next for OrbitIQ
TESS & JWST Integration: Expanding OrbitIQ to analyze light curves from NASA's TESS mission and atmospheric data from the James Webb Space Telescope.
- Automated Light Curve Fitting: Incorporating deep learning (1D CNNs) directly on raw transit flux light curves alongside tabular metadata.
- Public Open-Source Tool: Publishing OrbitIQ as a Python package so student researchers and amateur astronomers can screen exoplanet candidates easily.
Built With
- astronomy
- boosting
- chart.js
- css3
- featherless.ai
- forest
- gradient
- html5
- javascript
- jupyter
- learning
- machine
- matplotlib
- nasa
- notebook
- numpy
- pandas
- python
- scikit-learn
- visualization


Log in or sign up for Devpost to join the conversation.