Inspiration
We started by looking at what actually exists for satellite ground station operators today. The SatNOGS Network, an open, volunteer-run network of 800+ ground stations with 12 million observations, is genuinely remarkable infrastructure. But the tooling around it is stuck in 2015. Operators get a flat list of upcoming passes and a Grafana dashboard. No signal health. No anomaly detection. No intelligent pass triage. Nothing that tells you whether a pass is actually worth scheduling or whether your station has a problem.
That gap was our brief. We wanted to build the tool that should have existed from the beginning, a real-time intelligence layer on top of open space infrastructure.
What it does
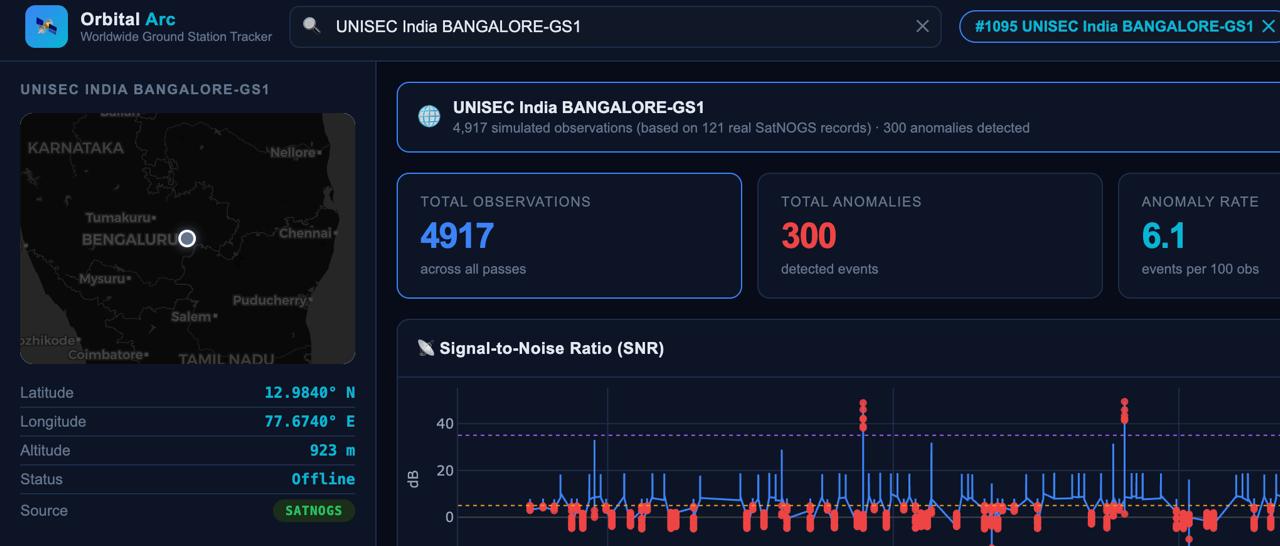
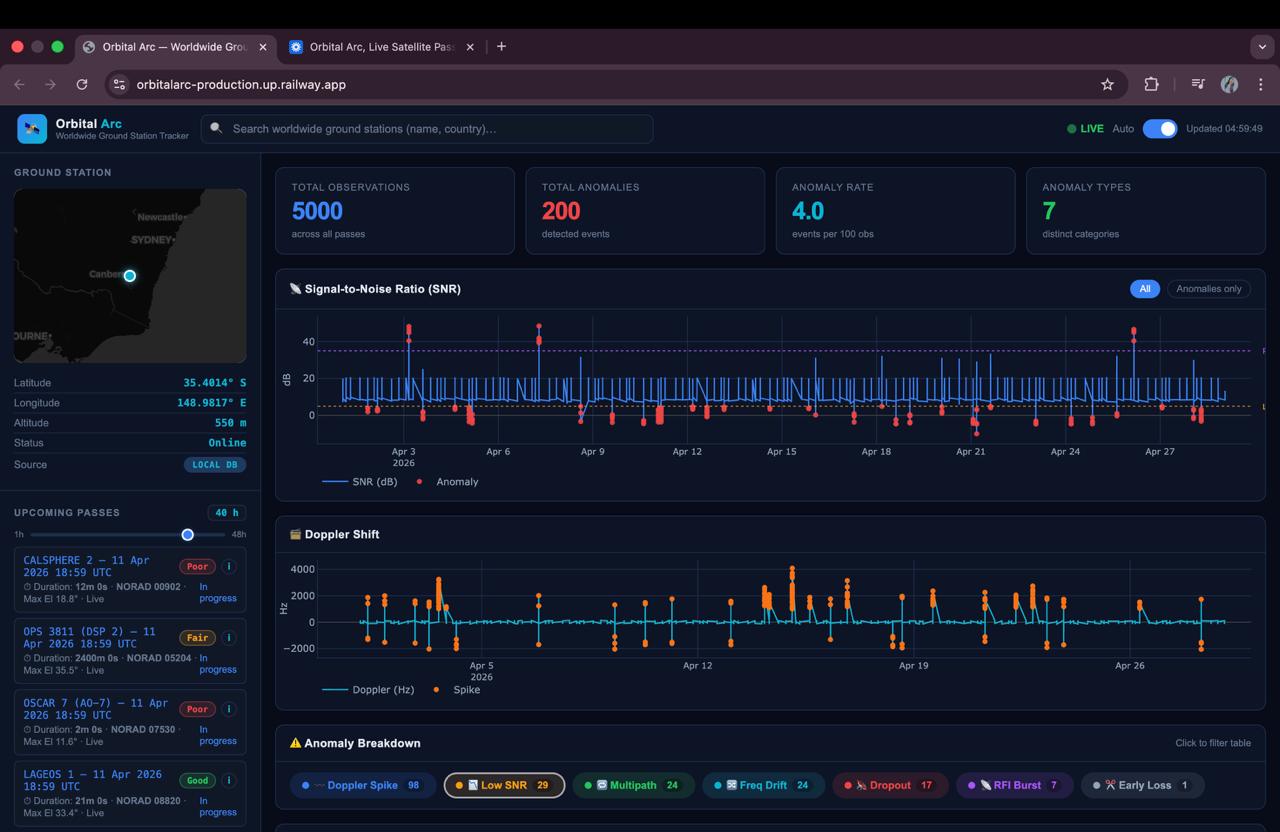
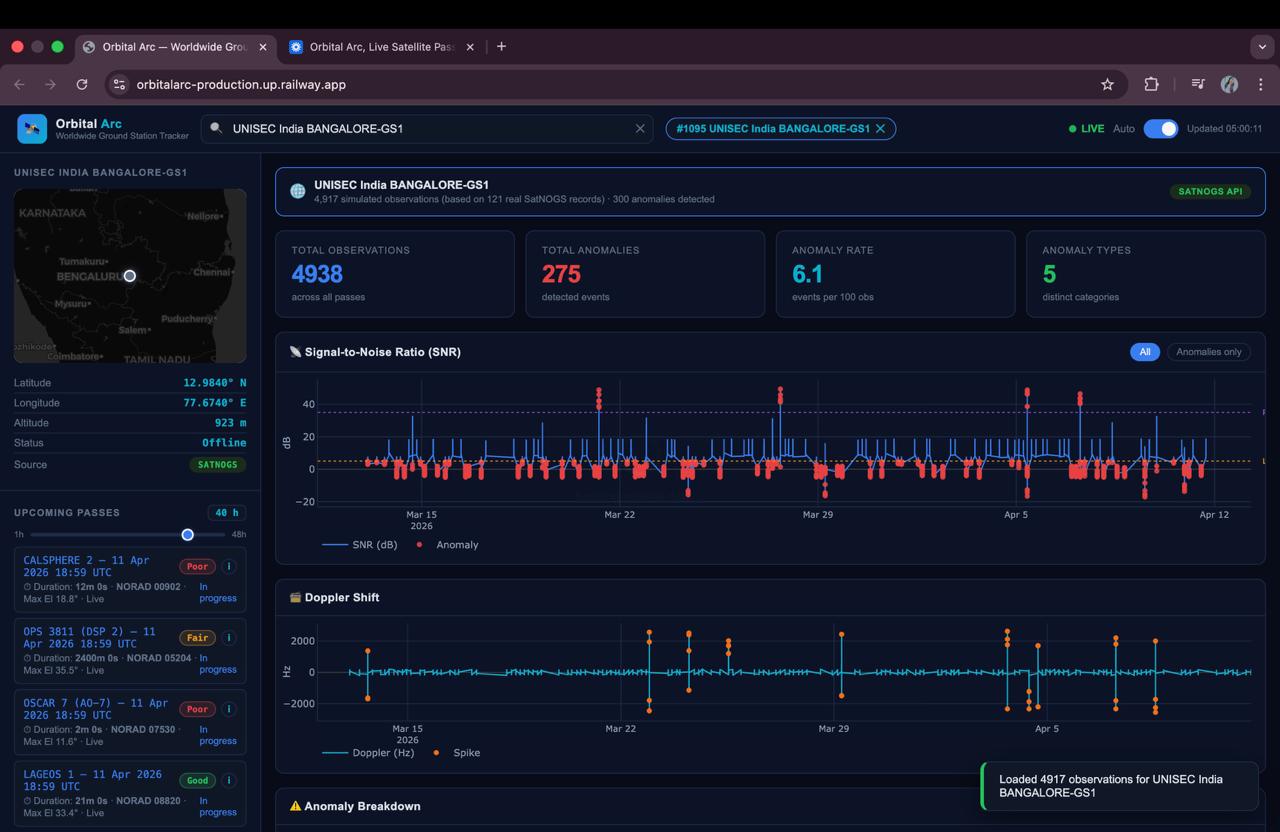
Orbital Arc is a worldwide ground station intelligence platform. You search any of the 800+ SatNOGS stations worldwide, and immediately get:
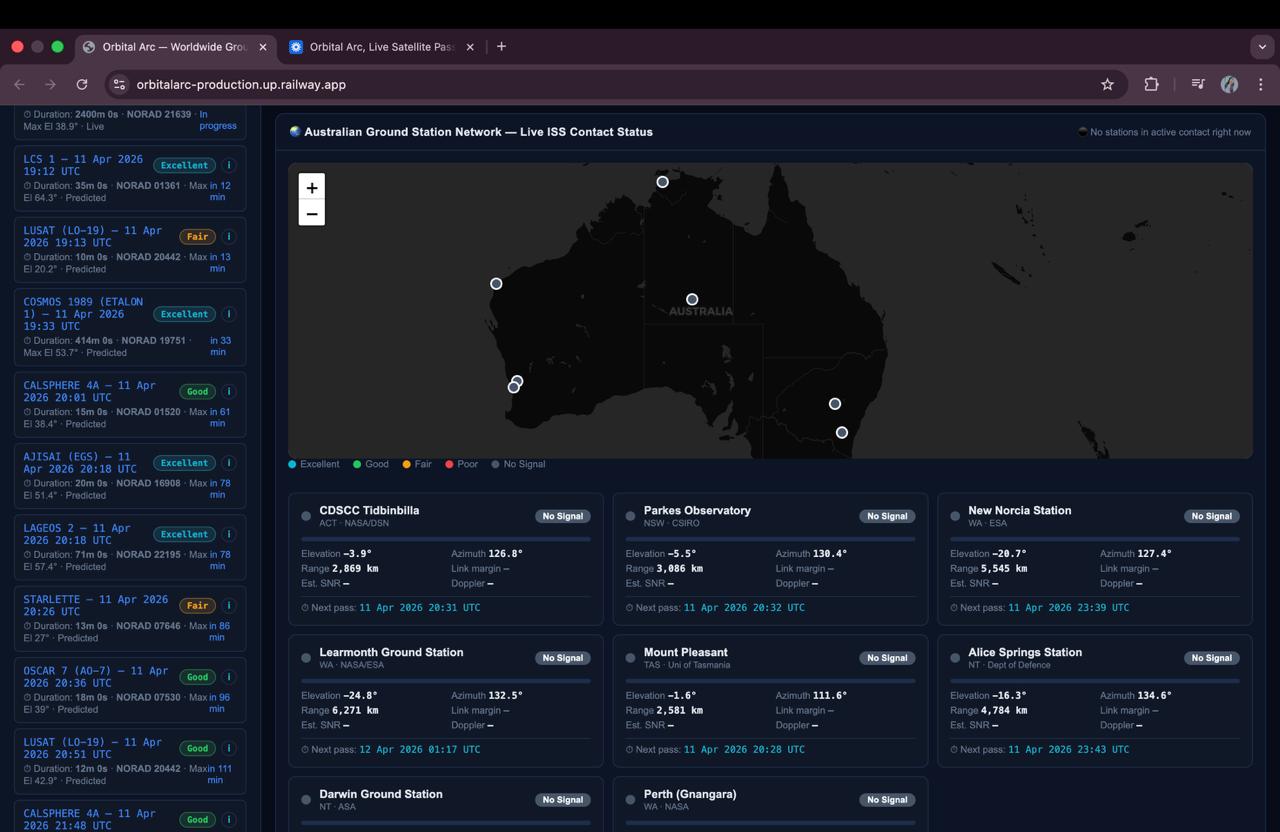
- Live pass predictions computed using real TLE orbital data and SGP4 propagation via Skyfield, the same orbit mechanics used in professional mission control systems
- AI-powered pass triage click any pass to get an LLM-generated one-sentence verdict on whether it's worth scheduling, citing real elevation angles and link quality
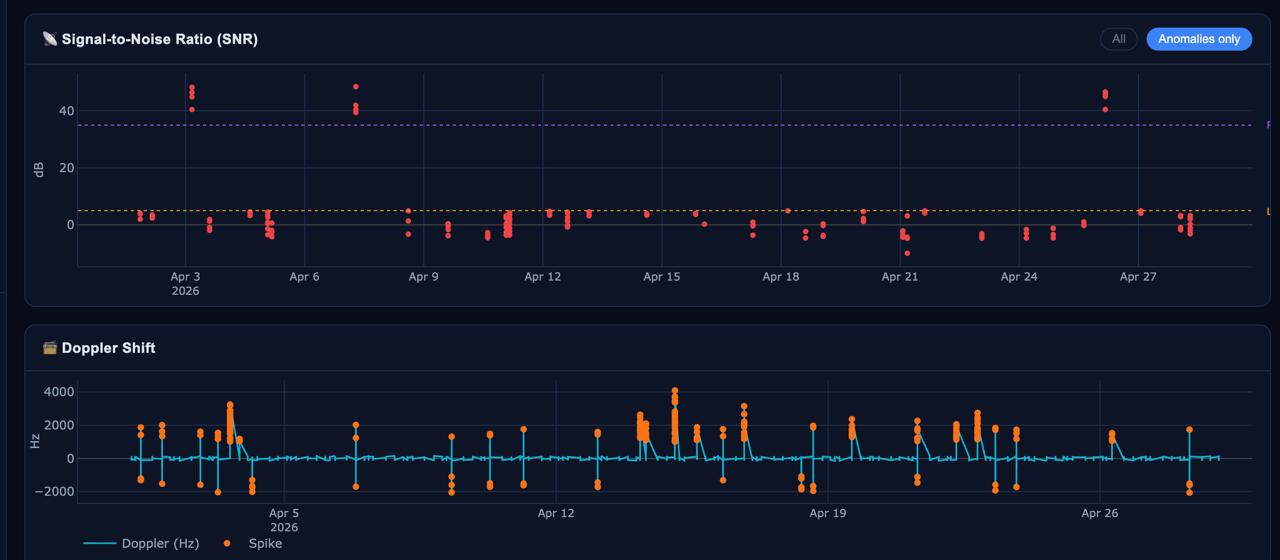
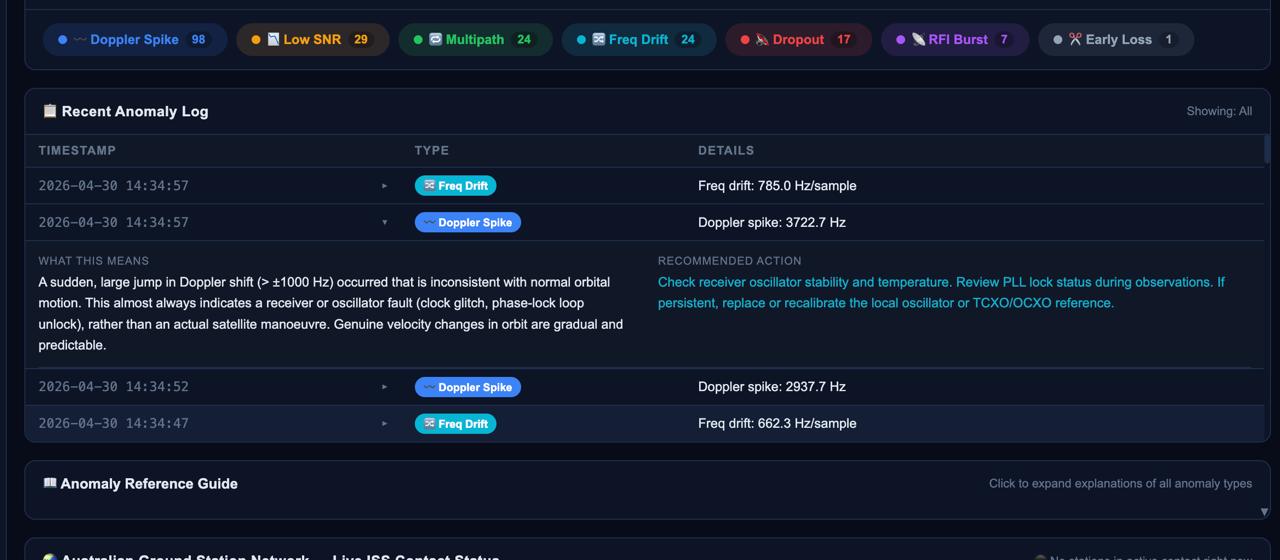
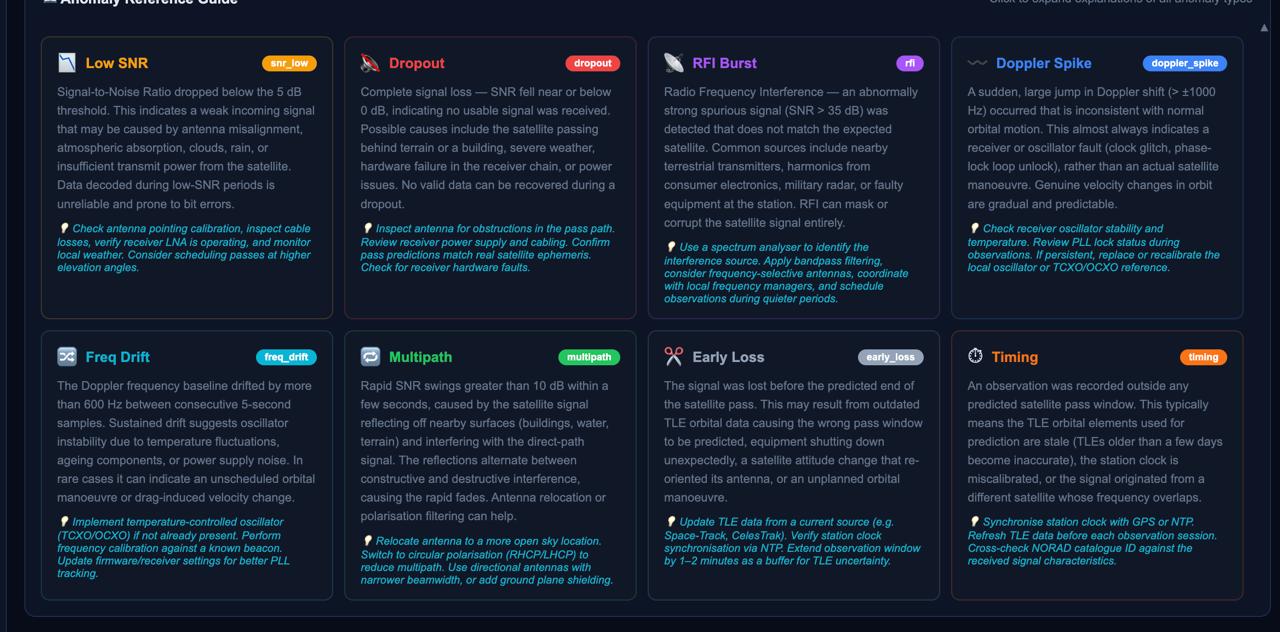
- Signal anomaly detection across 8 anomaly types: Low SNR, Signal Dropout, RFI Burst, Doppler Spike, Frequency Drift, Multipath Fading, Early Signal Loss, and Timing Anomalies, each with a detailed reference explanation and remediation steps
- Australian Ground Station Network live panel showing real-time ISS contact status, elevation, azimuth, estimated SNR and Doppler for 8 major stations
- Anomaly reference guide because when something breaks at 3am, an operator needs an explanation and a next step, not just a flag
How we built it
The backend is a single FastAPI file. We made a deliberate decision early on to keep the architecture simple and the scope honest. Two endpoints do most of the heavy lifting.
The pass prediction engine uses Skyfield to propagate real TLE orbits against any ground station's coordinates. We pull TLEs from CelesTrak first and fall back to the SatNOGS DB API, both cached aggressively to avoid hammering upstream services. For every satellite in our catalog, we compute the full elevation profile over a user-defined window and classify each pass as Excellent, Good, Fair, Poor, or No Signal based on real geometry. The timestep is adaptive, 10 seconds for short windows where precision matters, 60 seconds for 48-hour views where speed matters.
The signal health layer generates observations from real station metadata, total observation count, historical success rate, then runs them through a deterministic anomaly detector. This runs eight detection rules across SNR and Doppler: threshold crossings, inter-sample deltas, sudden loss of signal. Each detected event gets stored with a type and detail string.
The LLM layer is Groq with openai/gpt-oss-120b. It receives structured outputs from the physics pipeline, elevation, duration, quality classification, and translates them into plain English. It never touches the orbit math. A rule-based fallback fires if the API is unavailable, so the system is never dependent on it.
The frontend is vanilla HTML, CSS and JavaScript with Leaflet for maps and Plotly for charts. No framework, no build step. Dark theme, information-dense layout inspired by real mission control interfaces.
The challenges (and they were real)
The SatNOGS rate limiting problem was brutal. Our original plan was to fetch historical observations for each station at runtime, pull 1000+ rows, build satellite profiles, compute anomaly baselines. The SatNOGS API kept returning HTTP 429 errors mid-pagination. We tried 0.5 second delays between pages, then 1 second, then 1.5 seconds. We hit the limit anyway. We tried a background seeder script that fetched per-satellite instead of per-station. Still 429s. The API serves hundreds of thousands of users and simply isn't designed for bulk programmatic access at hackathon pace.
The breakthrough was accepting that fighting the rate limiter was the wrong fight. We pivoted: instead of fetching raw observation time series at runtime, we derive signal characteristics from real station metadata that the API does return cleanly, total observation count and success rate. A station with 400,000 observations and a 70% success rate gets a different signal profile than one with 2,000 and 40%. The result is synthetic data parameterised by real performance data. It loads in milliseconds, it's always available, and it honestly represents the station's observed behaviour.
We also made a deliberate decision not to train any ML model. We had built out a full scikit-learn pipeline earlier, IsolationForest for anomaly detection, a GradientBoostingClassifier trained on status=good/bad labels from the observations API. The models were technically valid. But without enough historical data flowing in, which the rate limiting prevented, the model trained on 200 observations with no meaningful variance, producing AUC scores of 0.55 that told us nothing. Shipping a "machine learning" feature with AUC barely above random felt dishonest. We replaced it with deterministic signal analysis: eight physics-grounded rules on SNR and Doppler thresholds that are explainable, auditable, and actually work with the data we have. The anomaly reference guide we built around them, describing what each anomaly means at the RF physics level and how to fix it, became one of the most genuinely useful parts of the product.
The UI took longer than expected. Making a dark-theme ops dashboard look like it belongs in mission control rather than a student project requires a lot of small decisions, consistent spacing, the right information density, making charts feel live rather than static, animating stat counters, getting the Leaflet map markers to glow correctly for in-pass stations. The anomaly pill tooltips, the expandable table rows with technical descriptions, the pass quality badges, none of these are hard individually, but making them feel coherent took most of day two.
CelesTrak added a new rate limit in March 2026: they now enforce one download per 2-hour update window for high-traffic groups, and will block your IP after 50 HTTP errors. We solved this by caching the full satellite catalog in memory for 6 hours and using the SatNOGS DB TLE endpoint as a parallel source, so we're never dependent on a single upstream.
What we learned
- SGP4 orbit propagation is genuinely accessible to any developer with a Python library and a TLE file. You don't need a physics degree to do real astrodynamics at this level.
- "Working prototype" means ruthlessly scoping to what's actually demonstrable. We cut a full SQLite persistence layer, an APScheduler background pipeline, a per-satellite ML scorer, and a polar plot visualiser, not because they were bad ideas, but because each one added complexity that moved us away from a clean demo.
- Rate limits are a product constraint, not a technical failure. The right response is architecture, not retry loops.
- LLMs are most useful at the output layer of a technical system. Structured data in, plain English out. The pass explain feature works precisely because the LLM never has to reason about orbits, it just has to write one sentence about numbers we've already computed correctly.
- The SatNOGS community has built something extraordinary with almost no institutional support. Every API we hit, every TLE we fetched, every observation we queried, all of it is freely available because individuals decided it should be. That felt worth building on top of.
What's next
- Replace synthetic signal data with real SatNOGS telemetry using a slow, rate-limit-aware background seeder that runs off the critical path
- Introduce the ML pass scorer once enough real observation history is accumulated, the feature engineering is already done, we just need data density
- Polar plot visualisation for pass geometry, matching the native SatNOGS station view
- Cross-satellite anomaly correlation, flagging when multiple satellites show degraded SNR simultaneously, which indicates a station hardware problem rather than individual satellite issues
Built With
- 3.1
- api
- celestrak
- data
- fastapi
- groq
- html/css
- javascript
- leaflet.js
- llama
- orbital
- plotly
- python
- satnogs
- sgp4
- skyfield
- sqlite
- tle

Log in or sign up for Devpost to join the conversation.