-
-
Project Demo

Inspiration
While spaceship and satellite launching by big companies such as SpaceX is revolutionary and cool, we realized that earth's orbit also a limited resource that is often overlooked. So, we decided to build a program that would visualize the growth of "space junk" over the past decades.
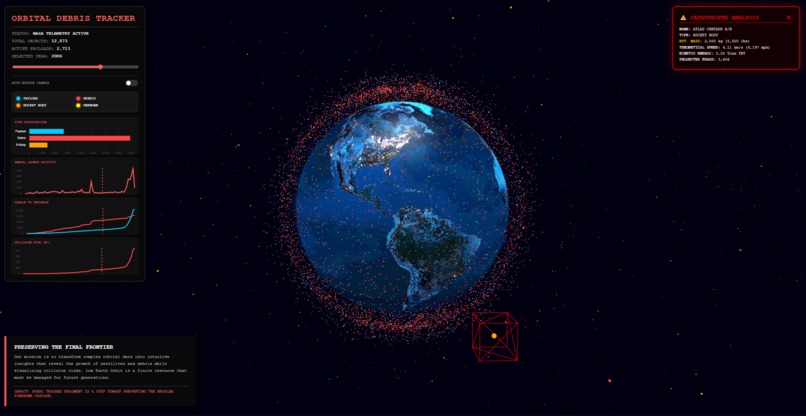
What it does
Our visualization shows a 3D model of earth and depicts the different types of orbiting objects. Using a slider, users can see the growth and congestion of such debris over time. Additionally, we created graphs of launch activity, usuable vs unusable satellites, and predicted collision risk over time to give users an understanding of the past and current orbital activity around earth.
How we built it
The interface is built with a SGP4 propagation model and optimized three.js rendering, which tracked over 25,000 objects. Using this model, we visualized the exponential growth of the Kessler Syndrome. We also used a synchronized quad-chart dashboard and a catastrophe analysis HUD, which calculated velocities exceeding 17,000 mph and kinetic energy transformed into units in tons of TNT.
Challenges we ran into
While changing our code, we ran into problems rendering the model with three.js. We had to resolve a conflict between using three.js and globe.gl to create a unified 3D environment. While making the quad charts, we also ran into problems with a custom scrubber plugin for chart.js to synchronize the 4 dashboards and graphs.
Accomplishments that we're proud of
We are proud that we were able to create an aesthetically pleasing and informational tool that we can share with those around us.
What we learned
The biggest thing we learned was that space is limited, even in the vastness of space, and we wanted to share this knowledge using a visualization interface that anyone can use. Additionally, we learned to implement new python libraries and how each work together to optimize and render 3D models.
What's next for Orbital Debris Tracker
In the future, we hope to implement a predictive Kessler Syndrome simulator that uses historical models to predict collisions based on current launch trends. Ultimately, we want to implement this project into an education platform using Augmented Reality capabilities, allowing anyone to look up at the sky to see the invincible "cloud" of debris up in the sky... imagine that 🚀✨
Built With
- globe.gl
- python
- satelite.js
- sgp4
- space-track.org
- three.js

Log in or sign up for Devpost to join the conversation.