
Inspiration
Unregulated fishing is one of the biggest threats to ecosystems and biodiversity within the oceans, Especially coral reefs and protected ocean zones. Current tools may exist, but are often hard to understand and limited from the public.
We wanted to build something that makes global maritime activity easy to understand while helping identify suspicious vessels using modern visualization and Ai to inform users more about the importance of awareness of the topic.
What it does
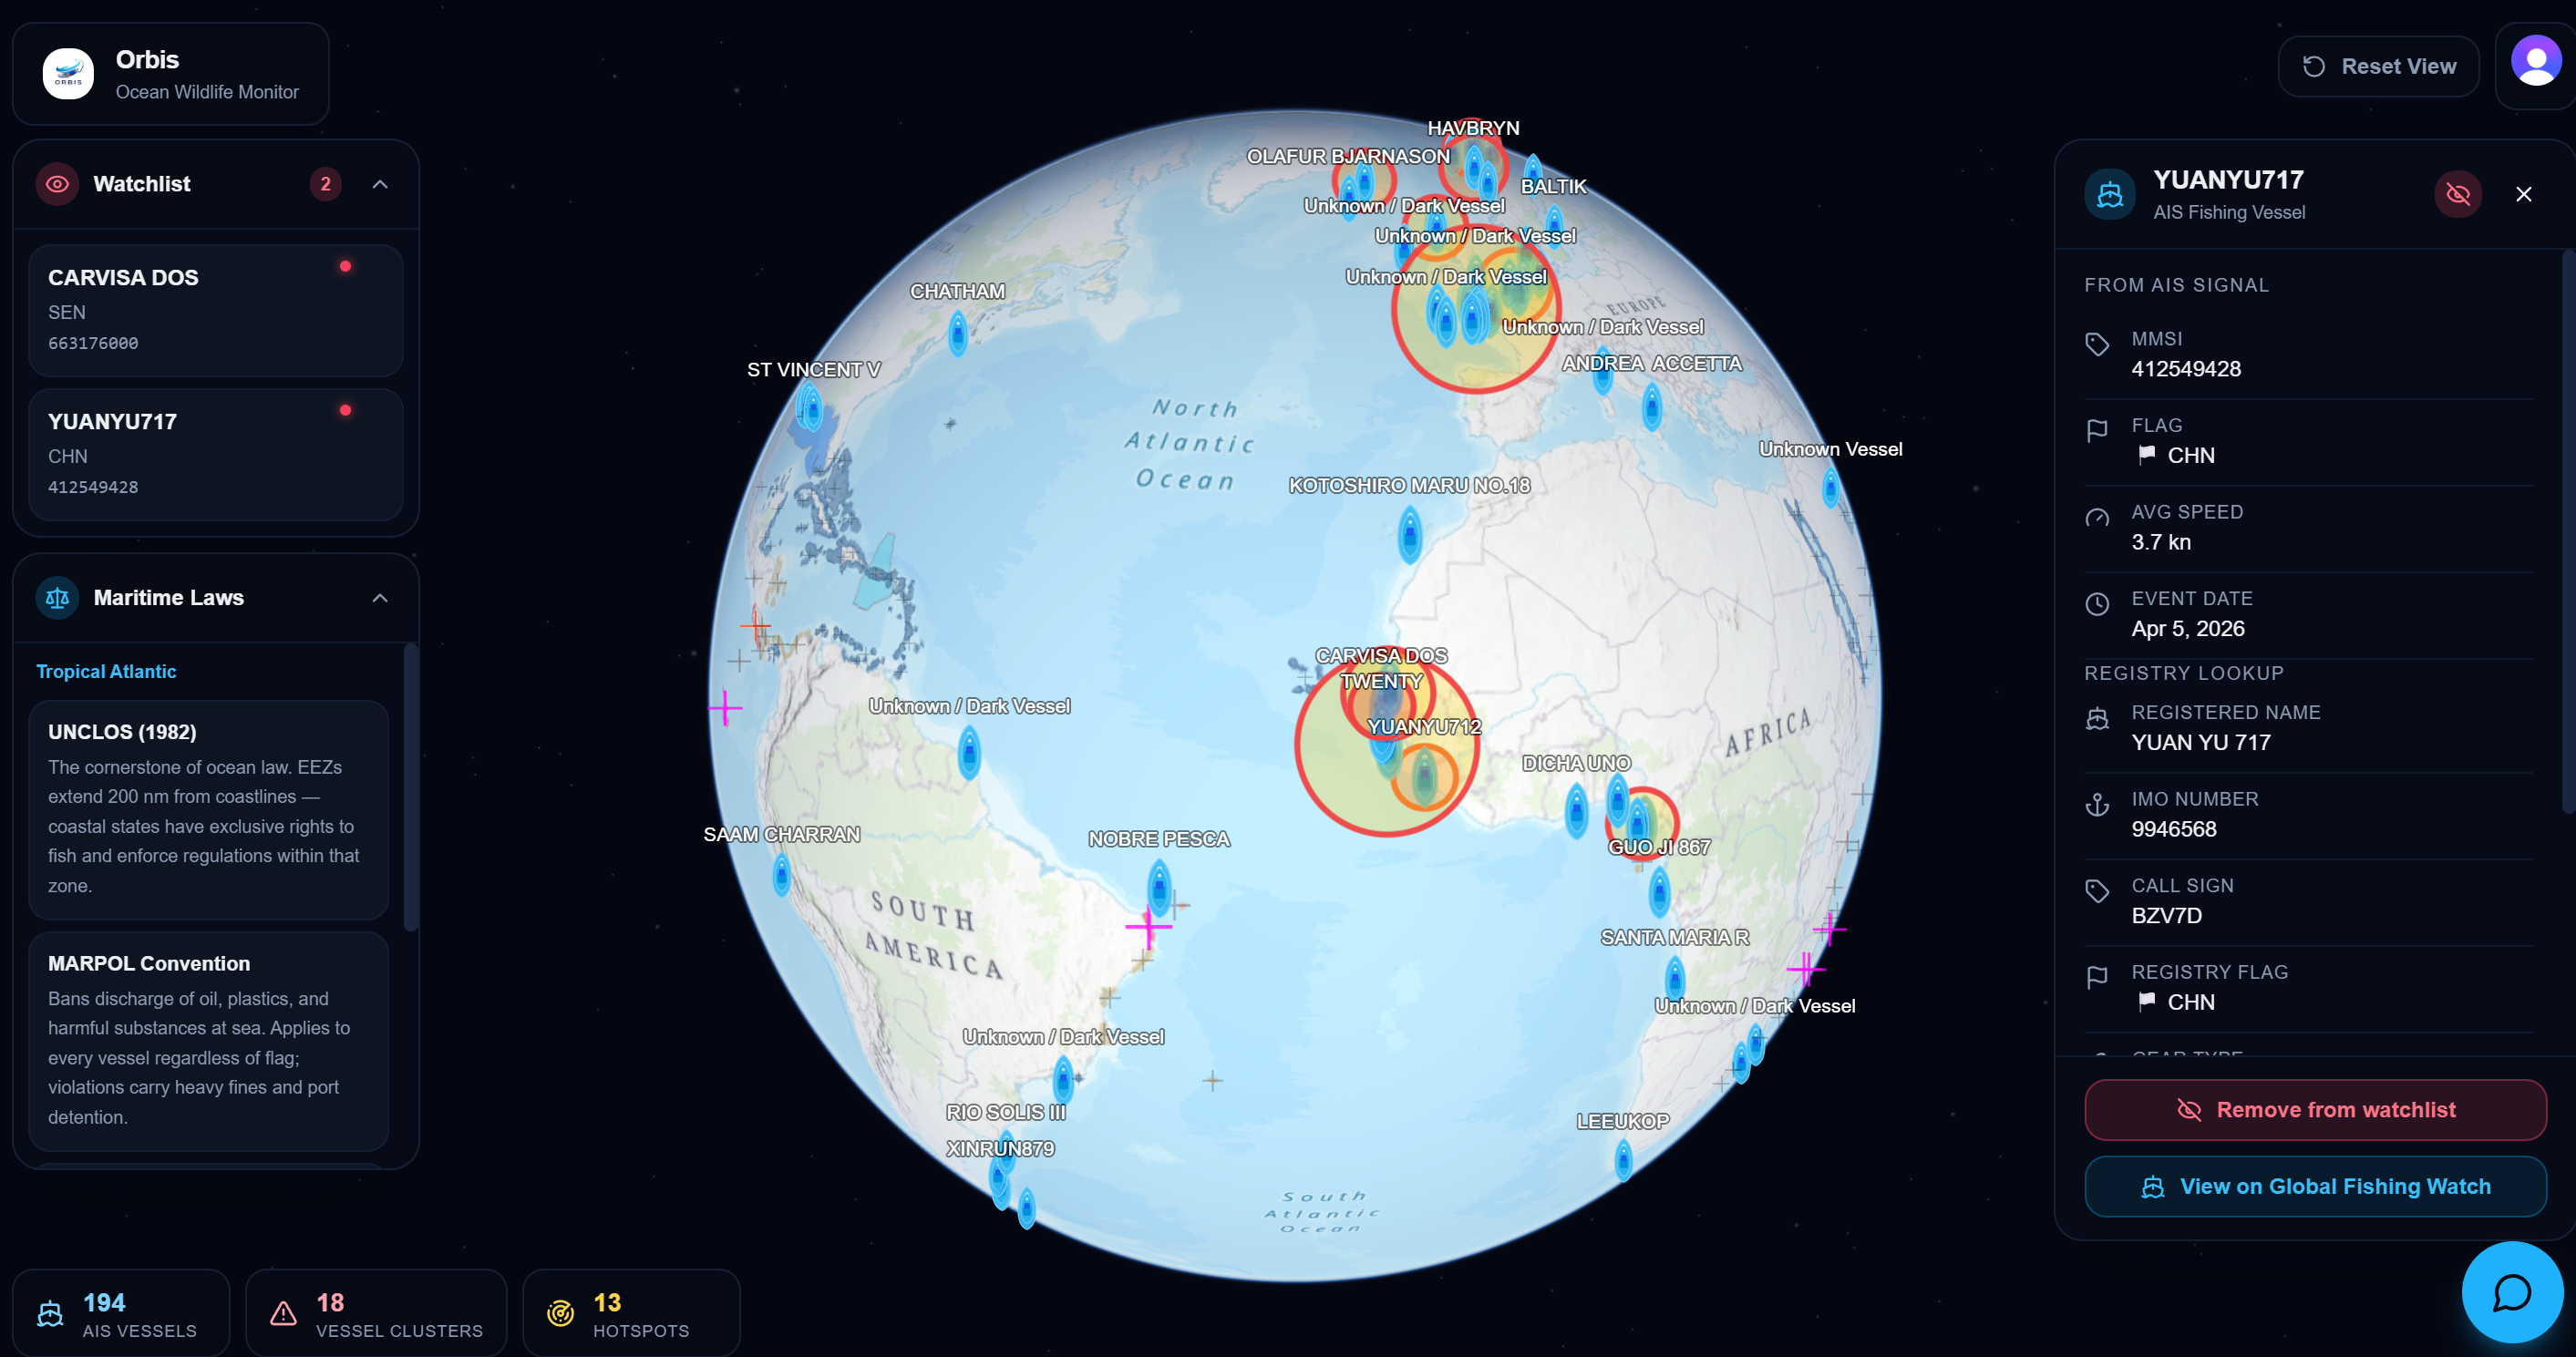
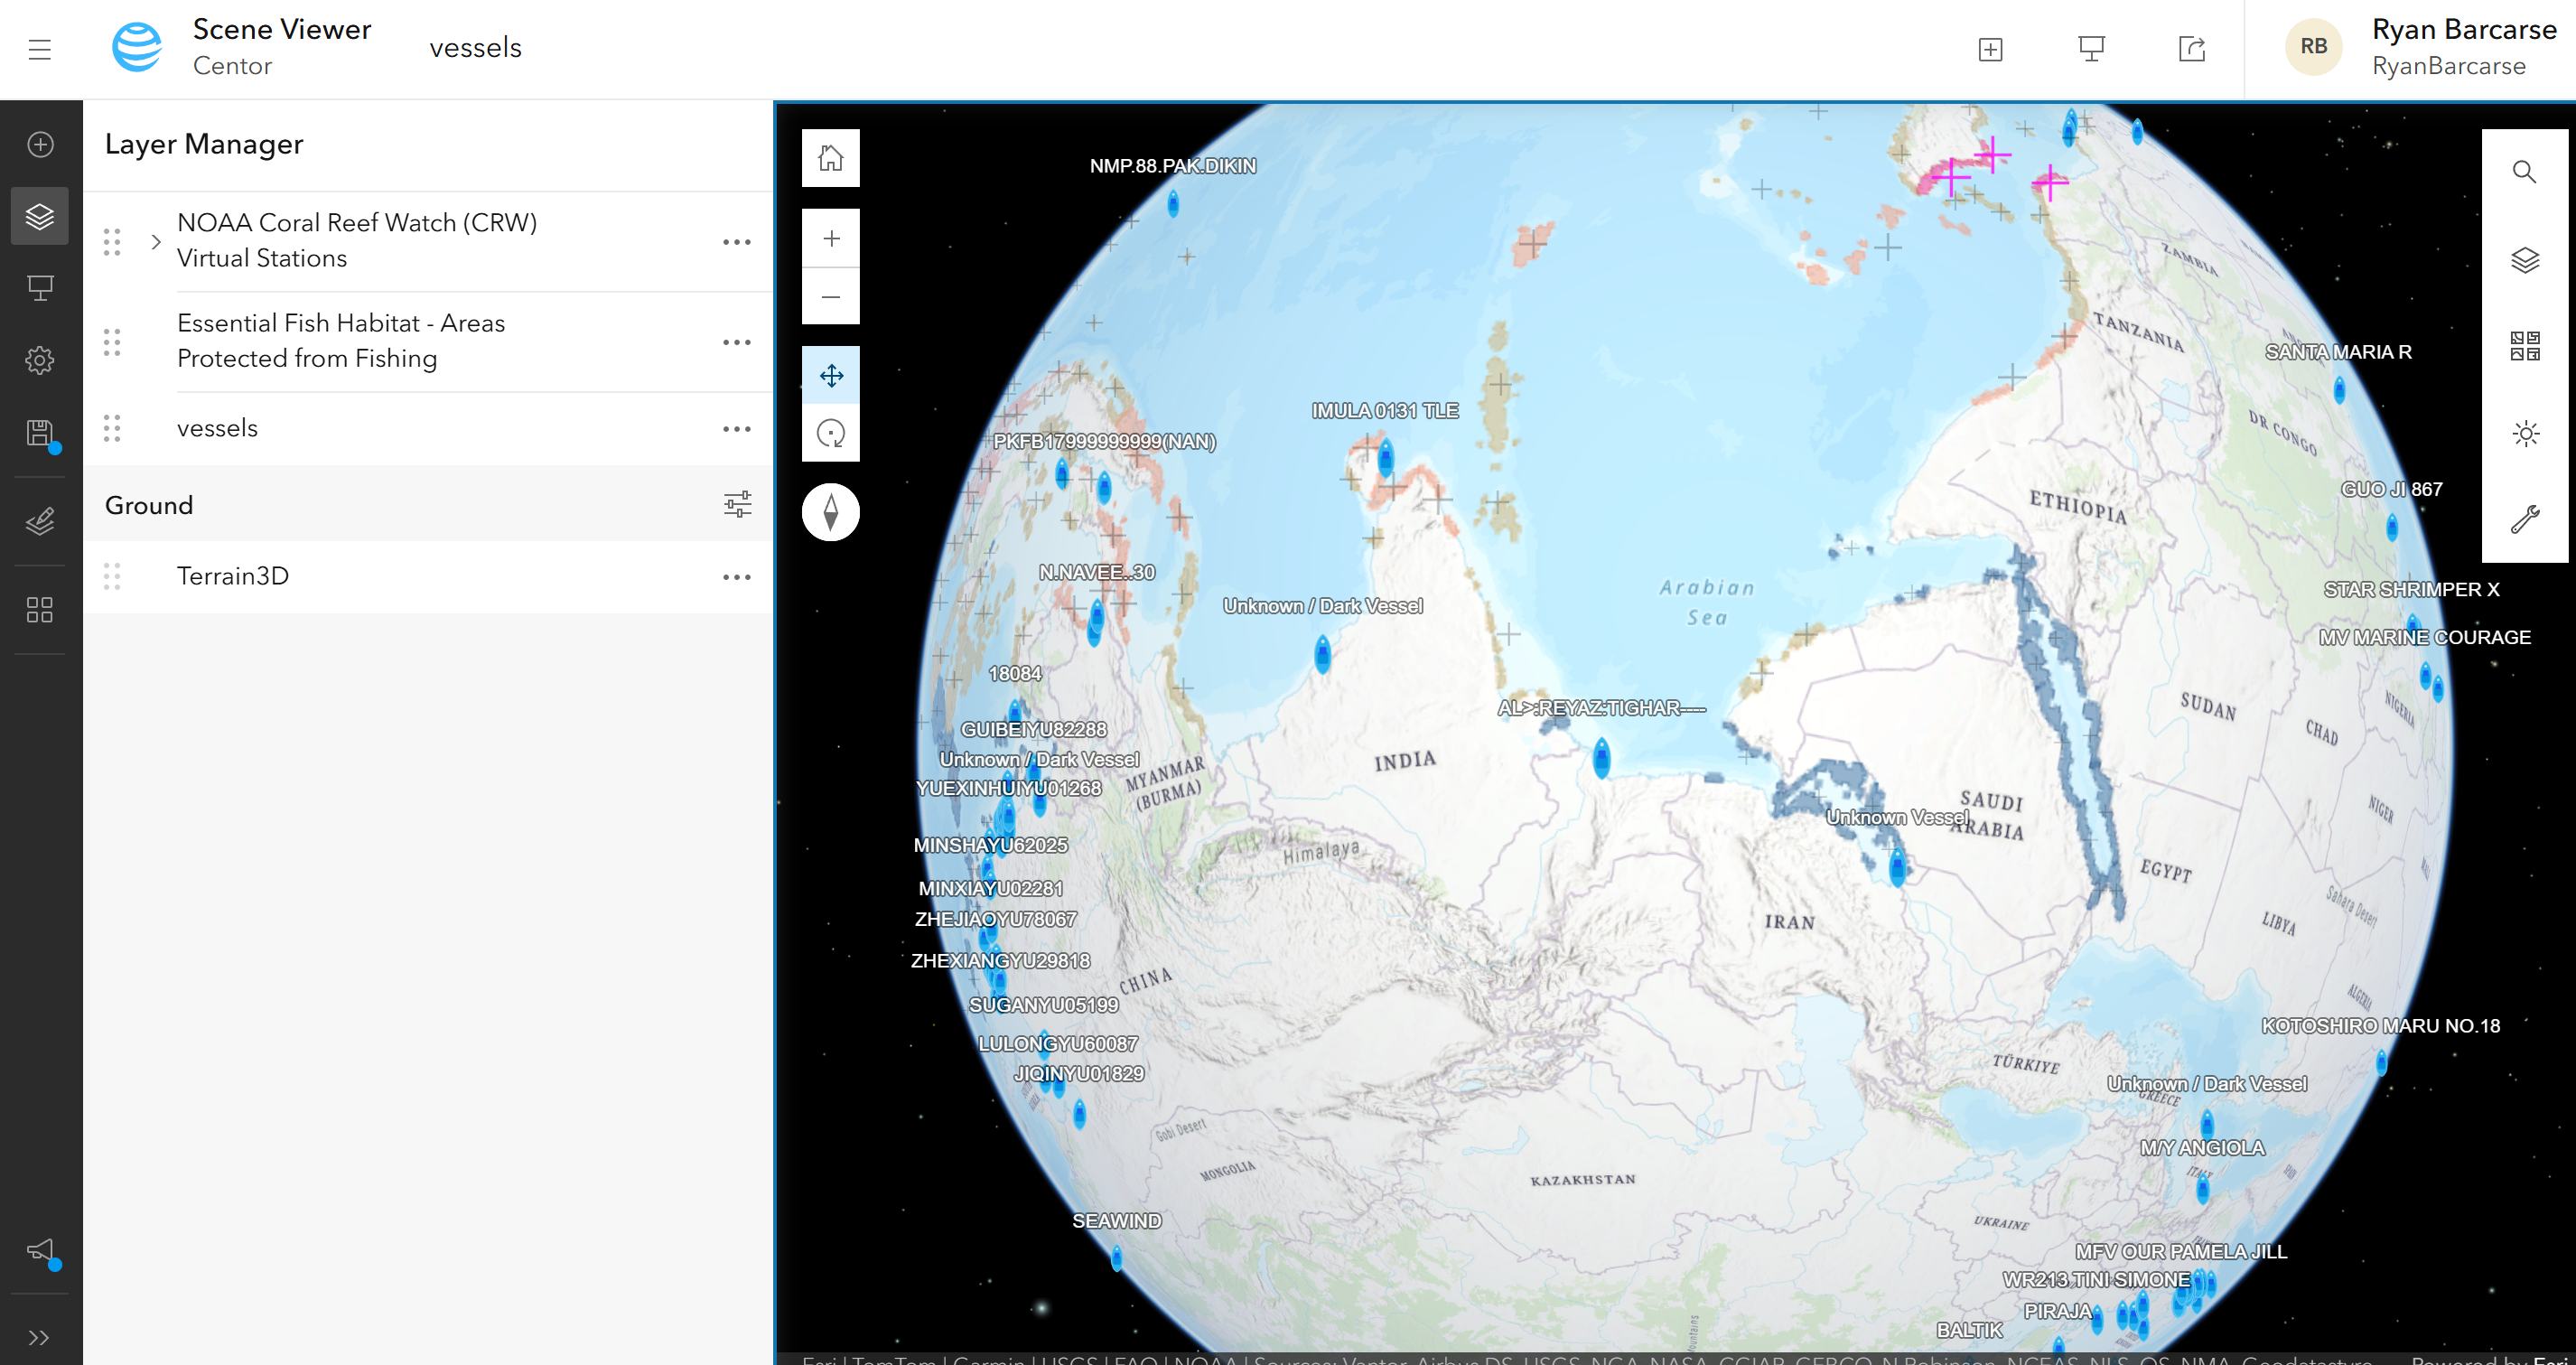
We built an interactive globe using Arcgis, displaying multiple layers of information, this is then analyzed and simplified to readable and easy to understand information for our users.
We have many features such as:
Clusters: Which identifies certain densities of live vessel locations in a certain area, which can be a cause of overfishing
Coral reefs & Protected zones locations: Providing us an insight on weather ships are resting on protected waters possibly fishing and ruining the habitat.
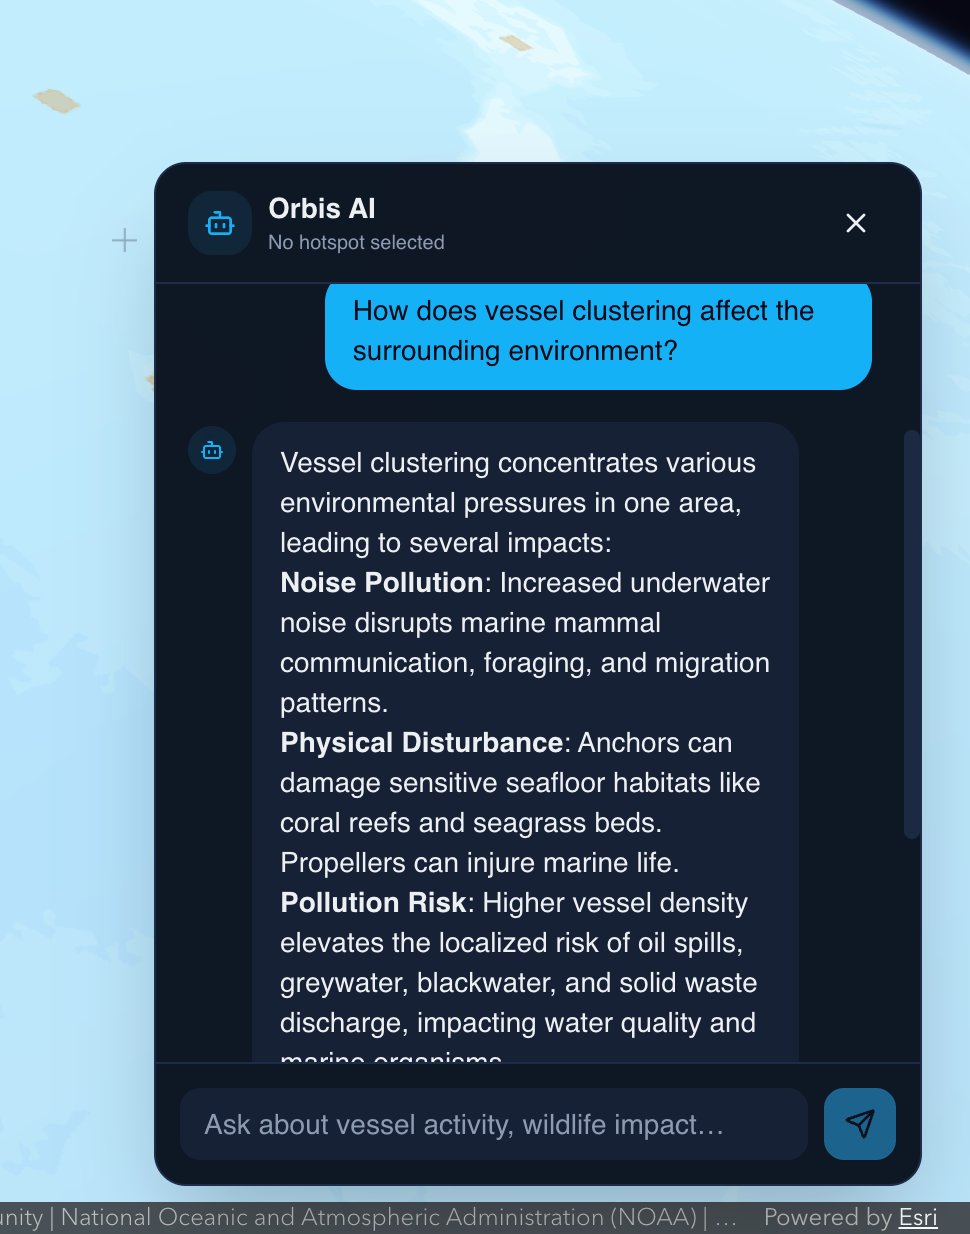
Ai generated information: Giving detailed info on boats located in a cluster, possible fish being affected in that area, and a chatbot to answer further questions about hotspots.
Watchlist features: Users can highlight suspicious vessels that have been on certain waters, looking for trends that may occur, proving illegal activity.
How we built it
We built Orbis using a combination of tool and technologies:
- ArcGIS or the 3D globe and spatial rendering
- Node.js + Express backend to serve vessel GeoJSON data
- AIS vessel data for real-time ship tracking
- Custom UI components for vessel details, hotspots, and filters
- React + Vite We focused heavily on performance and smooth interaction to handle large-scale global data.
Challenges we ran into
One of the main challenges we ran into was figuring out how to put the Esri mapping onto our react app. After many hours we discovered and implemented the ArcGIS JavaScript SDK, which allowed us to properly initialize and manage the map within our app.
Accomplishments that we're proud of
One of our biggest accomplishments was figuring out how to display the live data and where to get free sources for our vessel locators. After coming to a conclusion that we possibly might not be able to display our vessels, we did not give up and did further research, figuring out how to implement it into our code.
What we learned
We learned how to use Arcgis, finding out that it is a very useful tool for displaying data on maps, giving visuals on useful information. After spending nearly 24 hours on this project, determination is what got us to our end goal and we learned a valuable lesson in time crunches and deadlines.
What's next for Orbis
Orbis can be way bigger than what it is right now, we can feed it more accurate data, actual tracking components, and history if ships in the ocean. Orbis can expand to help become a beacon of protection to ocean life and keep our ocean habitats alive and well.
Built With
- clerk
- esri
- globalfishingwatchapi
- google-gemini
- javascript
- react


Log in or sign up for Devpost to join the conversation.