
Inspiration?
We wanted to experiment with Machine learning and dip our feet in its large area of study.
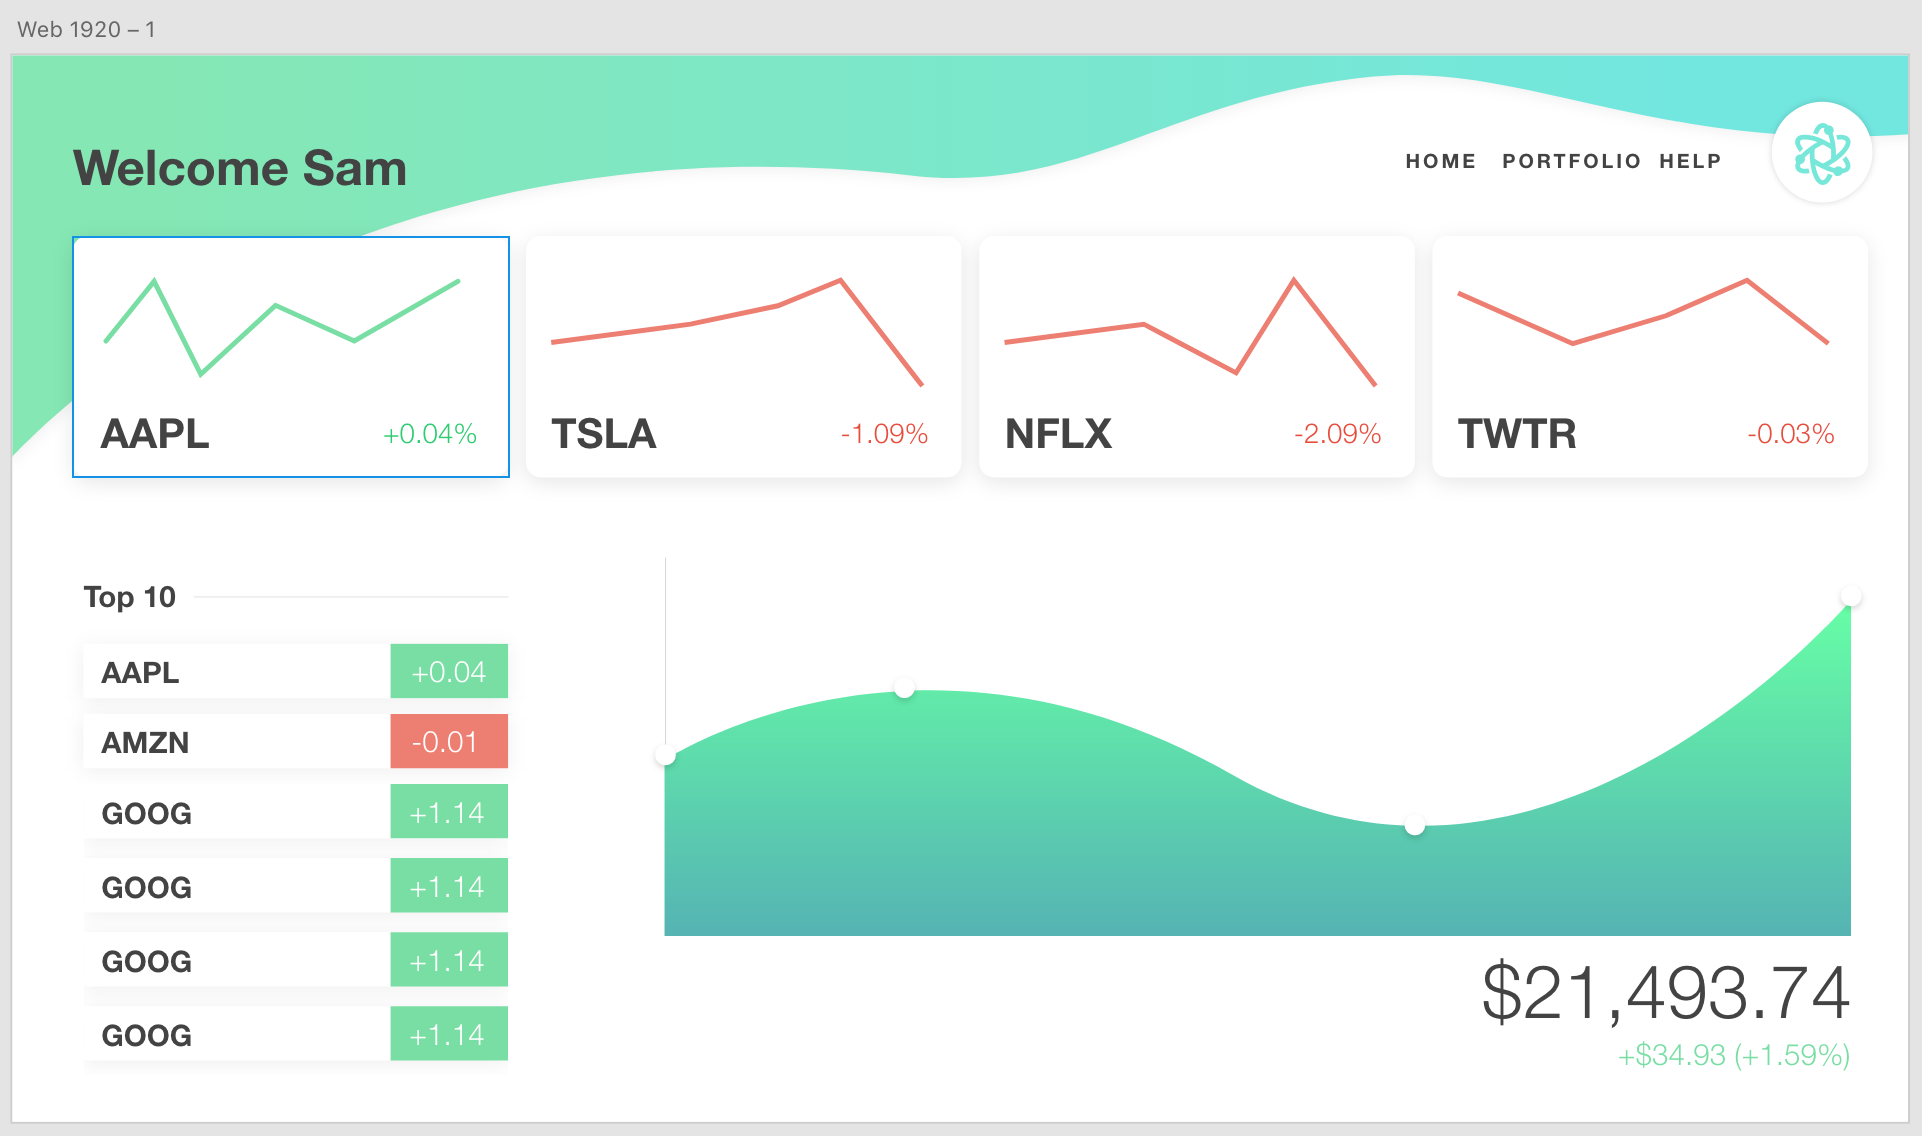
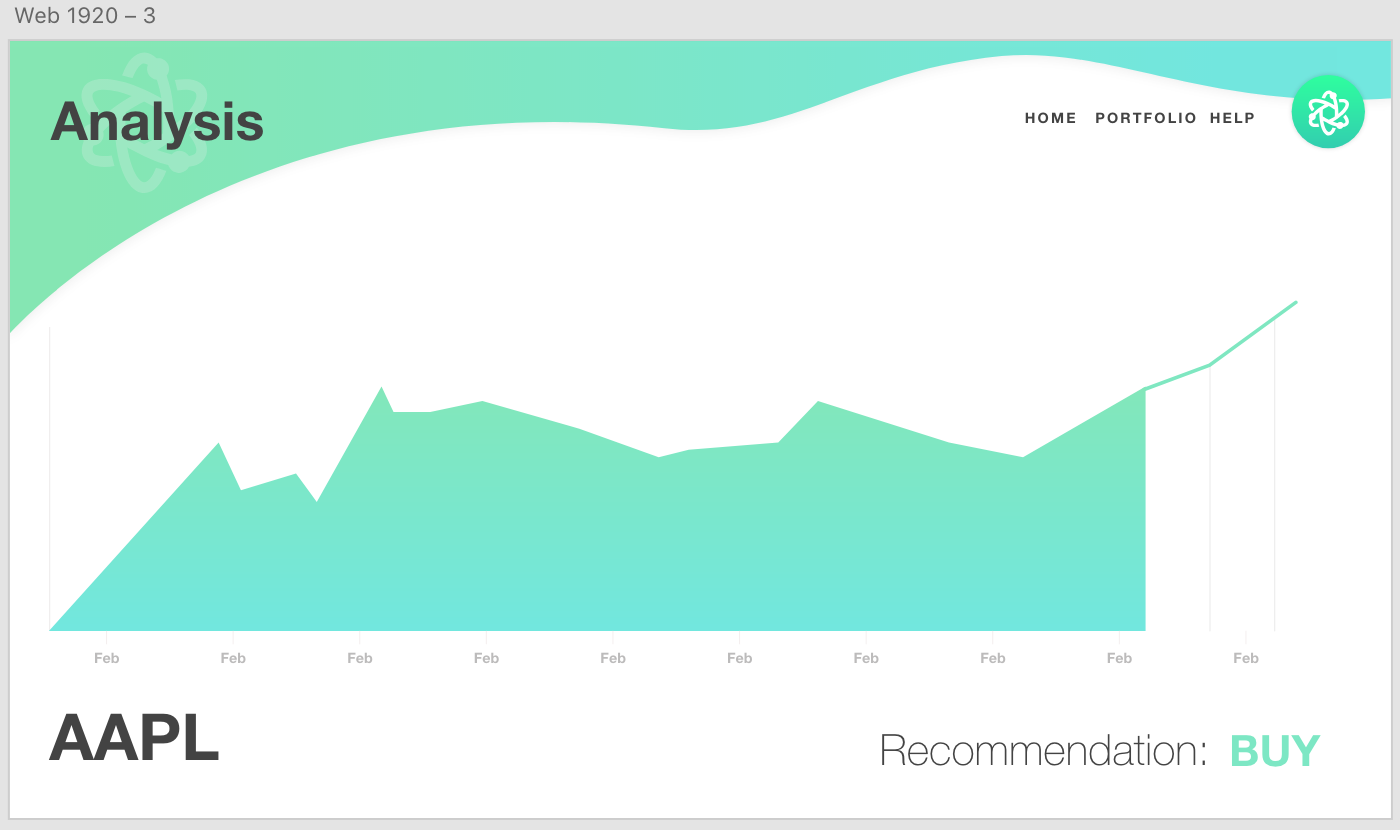
What it does?
It’s a financial dashboard that lets you preview stocks and cryptocurrency prices for certain companies and uses linear regression algorithms to predict the trend of the stock based on factors such as Google trend scores and closing stock prices for up to the past five years.
How I built it?
We used View.JS for the front-end of the dashboard while we used python and Node.JS for the back-end.
Challenges I ran into?
Some of the challenges we ran into were choosing which technique would be the best for analyzing the data that we had derived from the two APIs and optimizing our algorithm specifically for our mission.
Accomplishments?
I believe one of our biggest accomplishments would be to implement a machine learning algorithm from the beginning.
What I learned?
If I had to state, the one thing I learned from this project is that it is exciting and thrilling to team up and work with new people with unique experiences and different ideas.
What’s next?
Integrating a seamless transition between our back-end in python and our front-end in View.JS.
Built With
- linear
- machine-learning
- node.js
- numpy
- pandas
- python
- regression
- scikit-learn
- vue


Log in or sign up for Devpost to join the conversation.