-
-
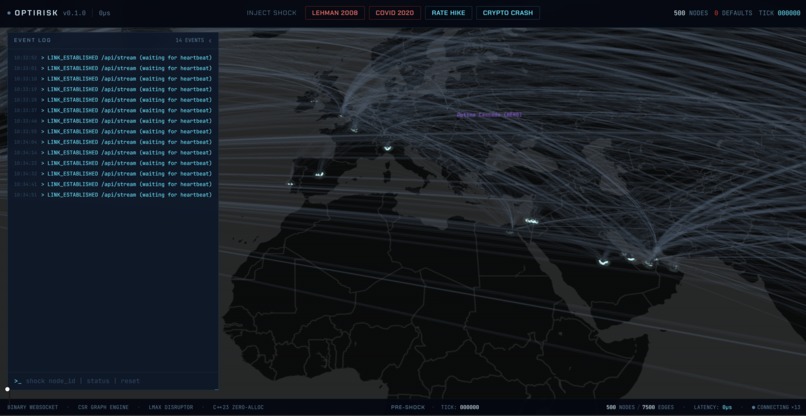
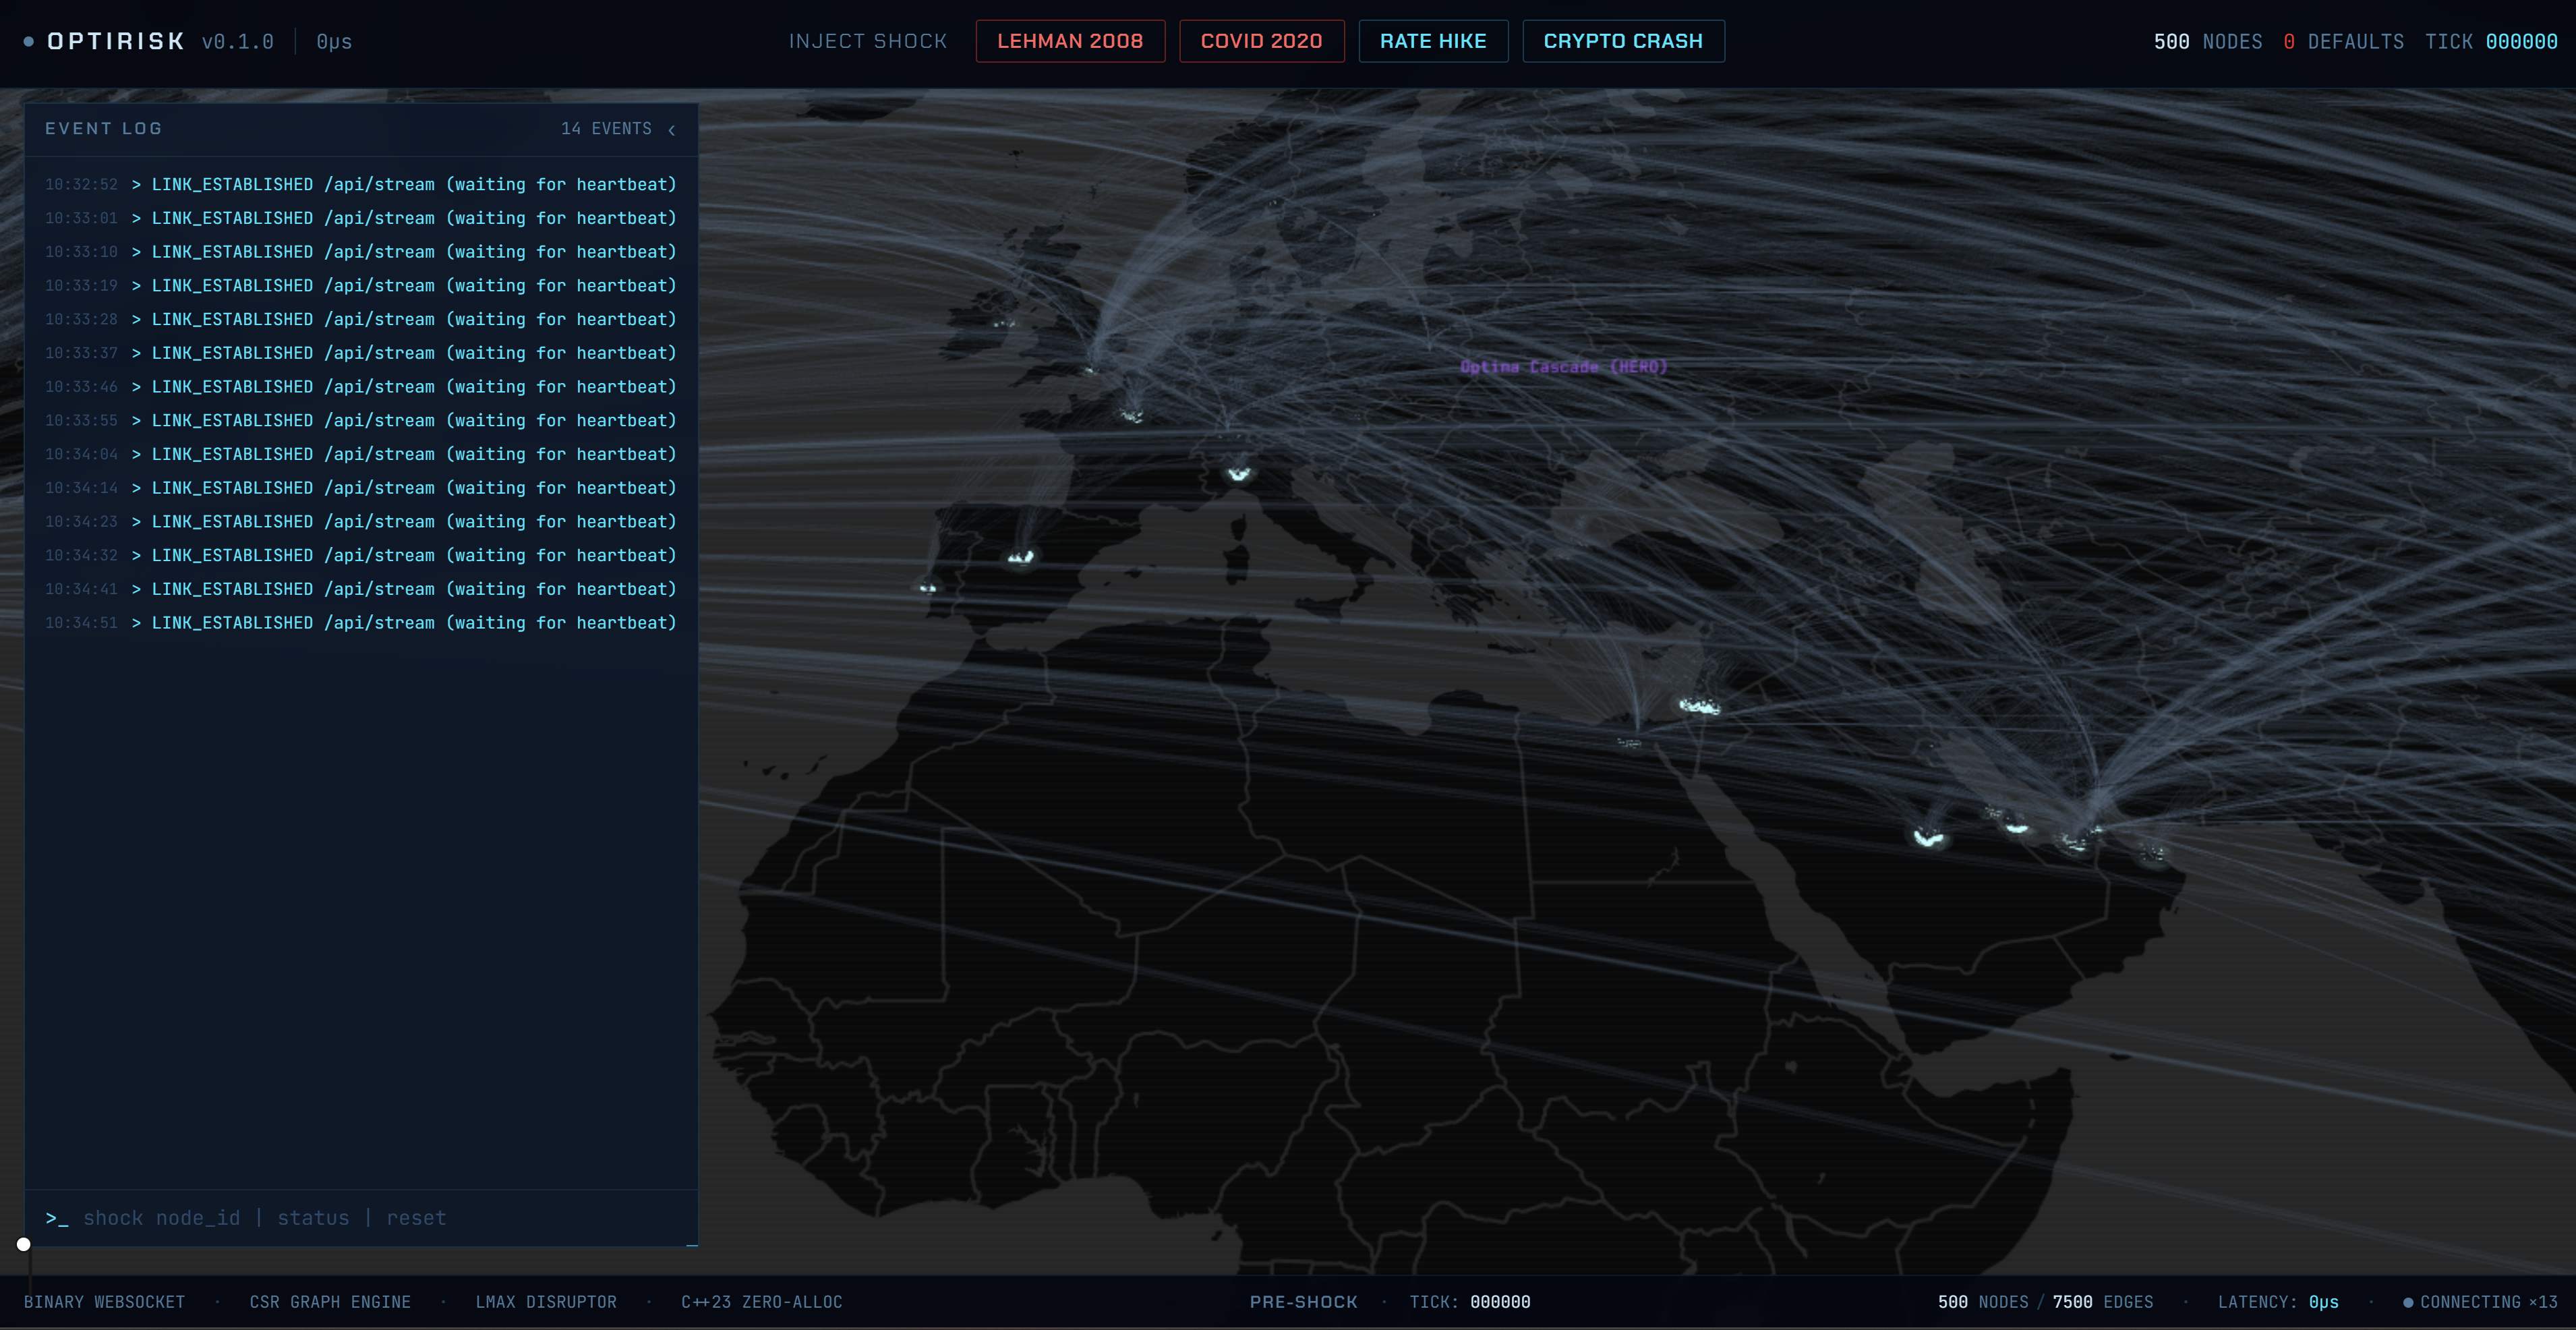
Overview financial map of the world
-
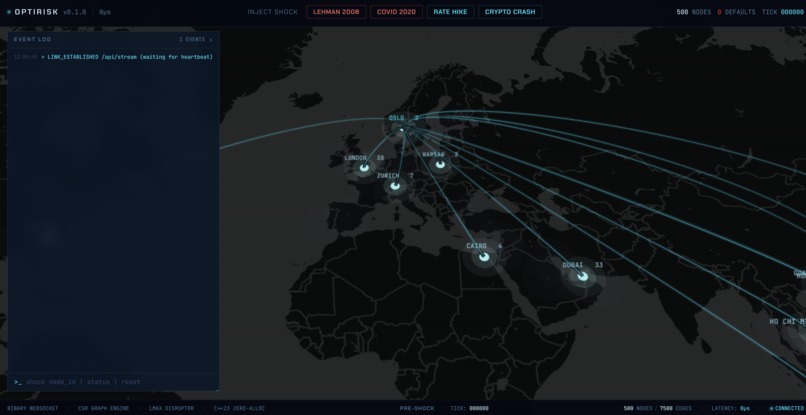
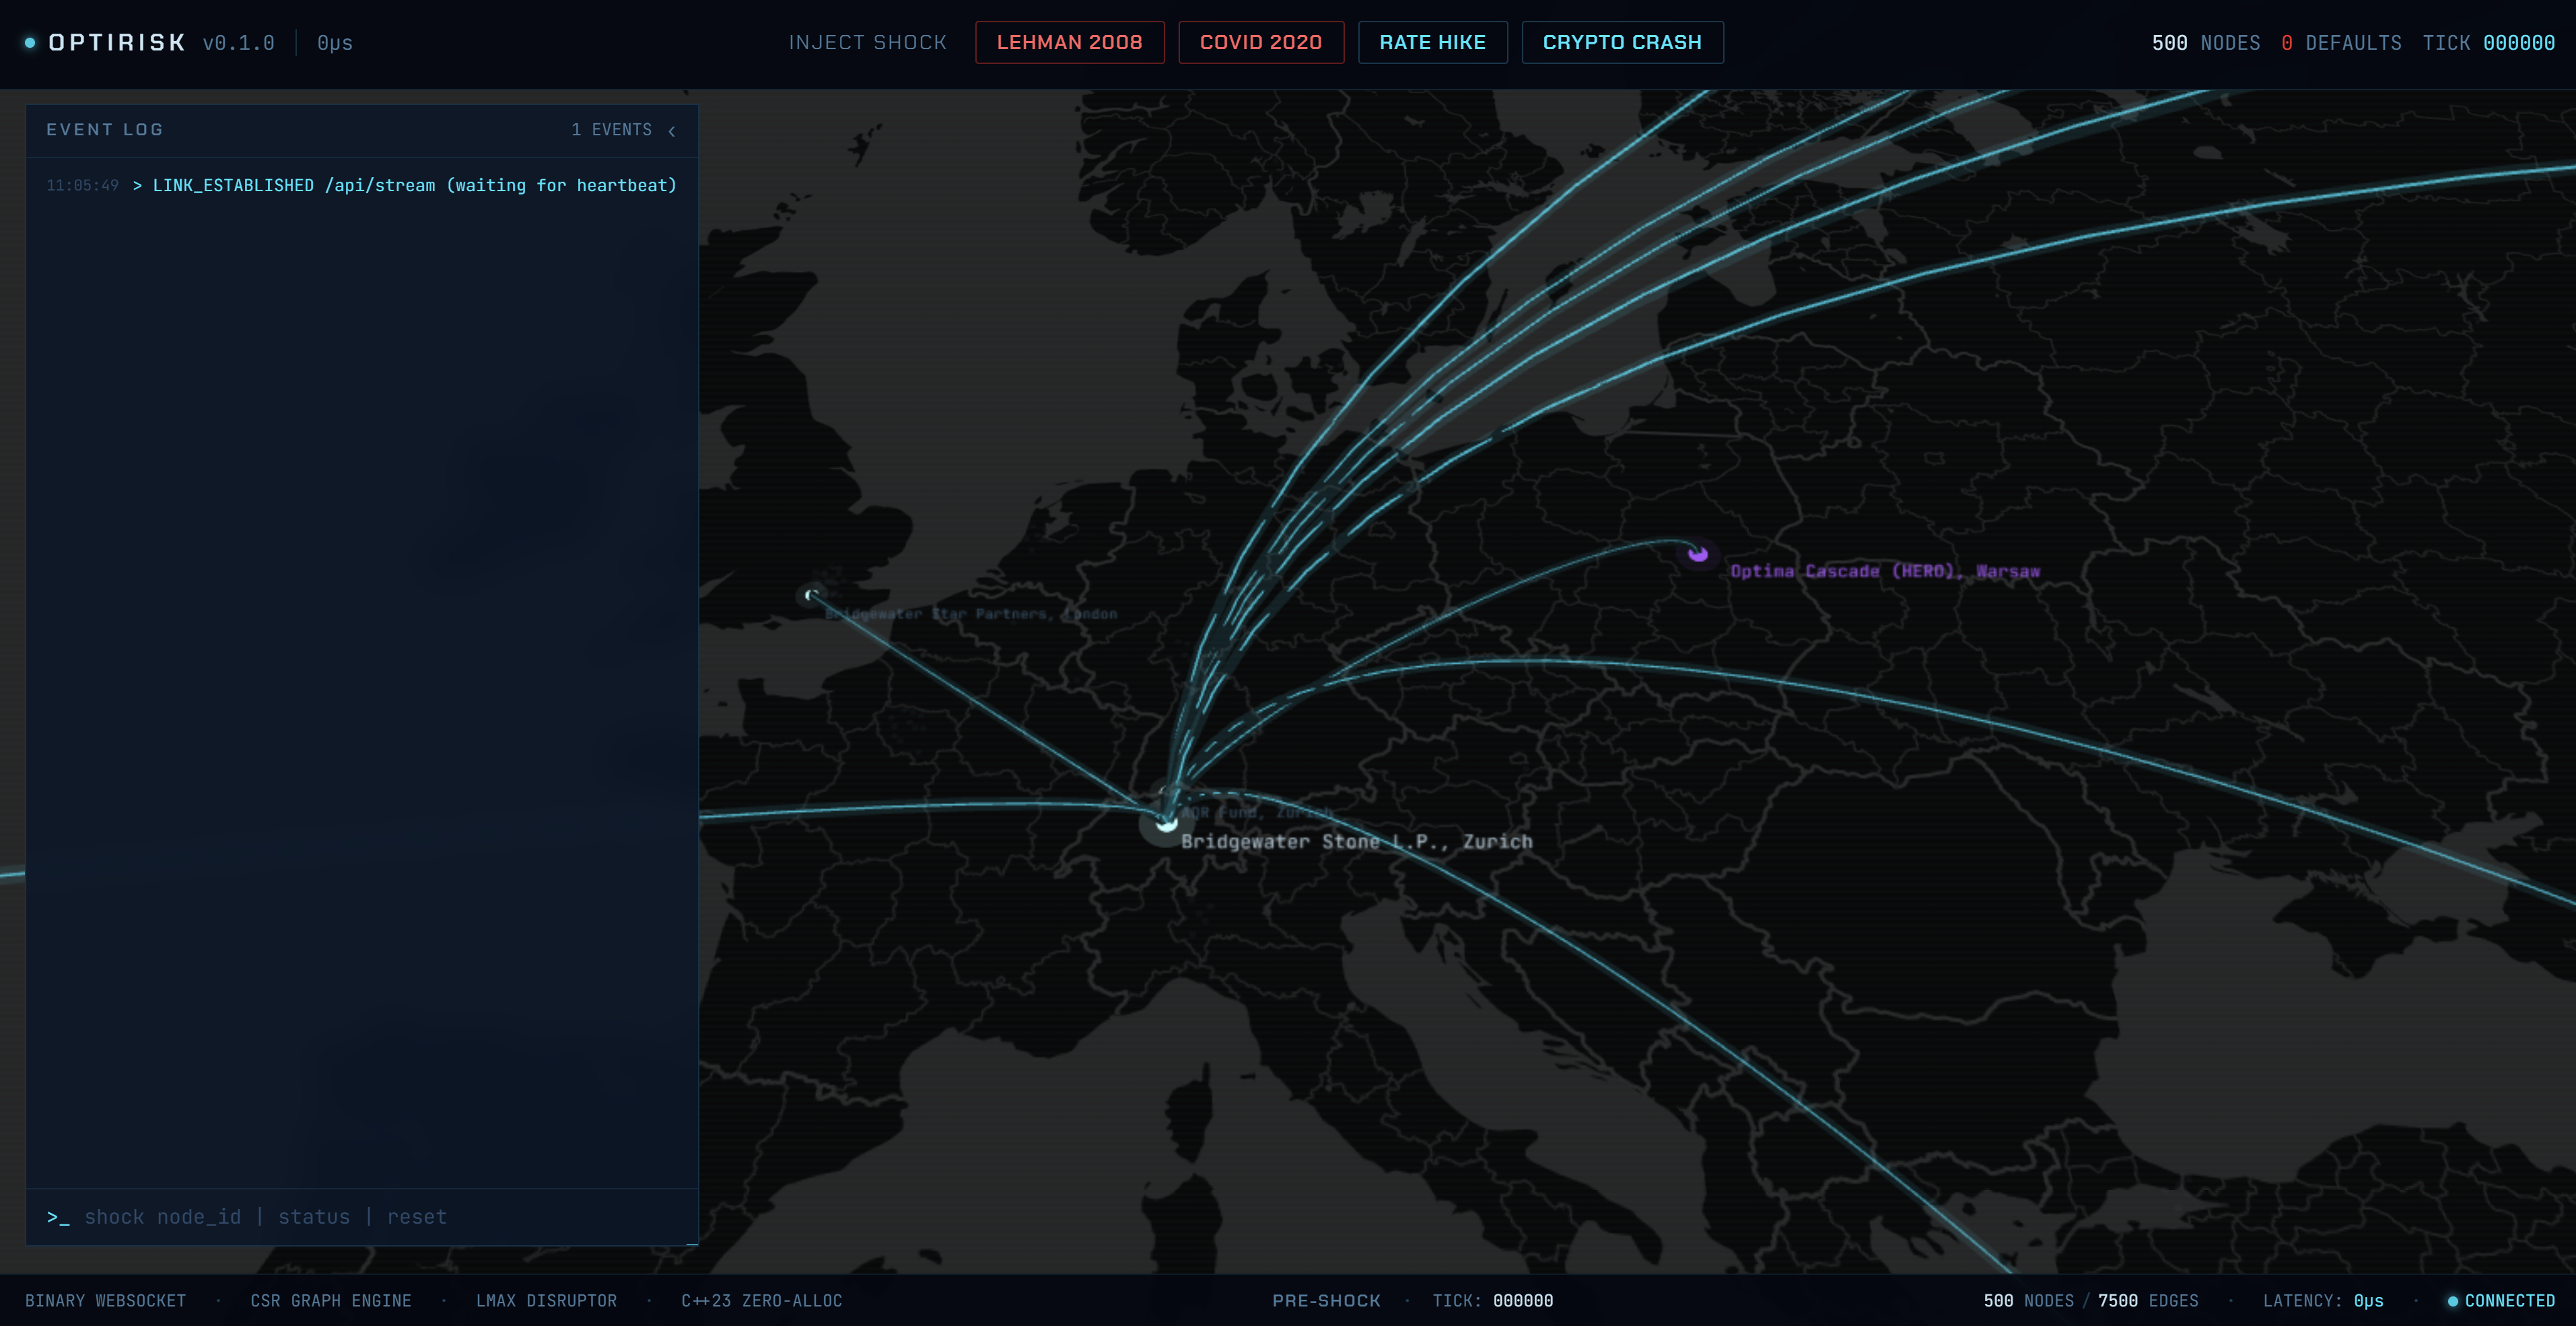
Higher view of city hub connection
-
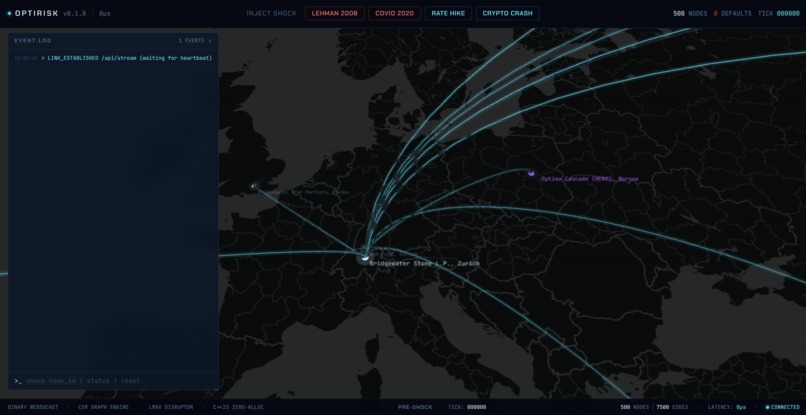
Detailed connection of firms and bank
-
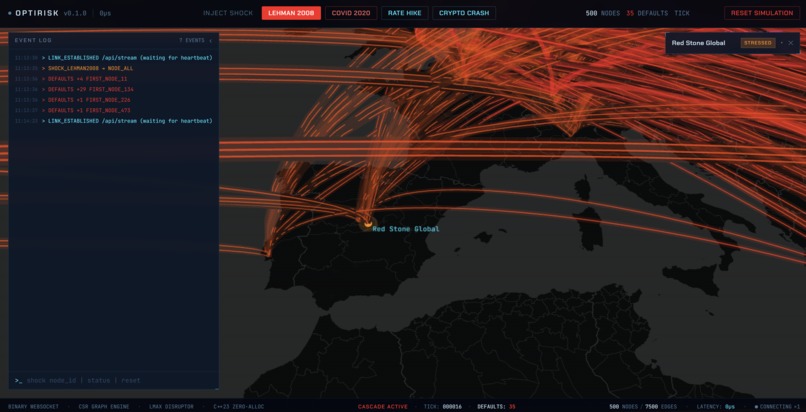
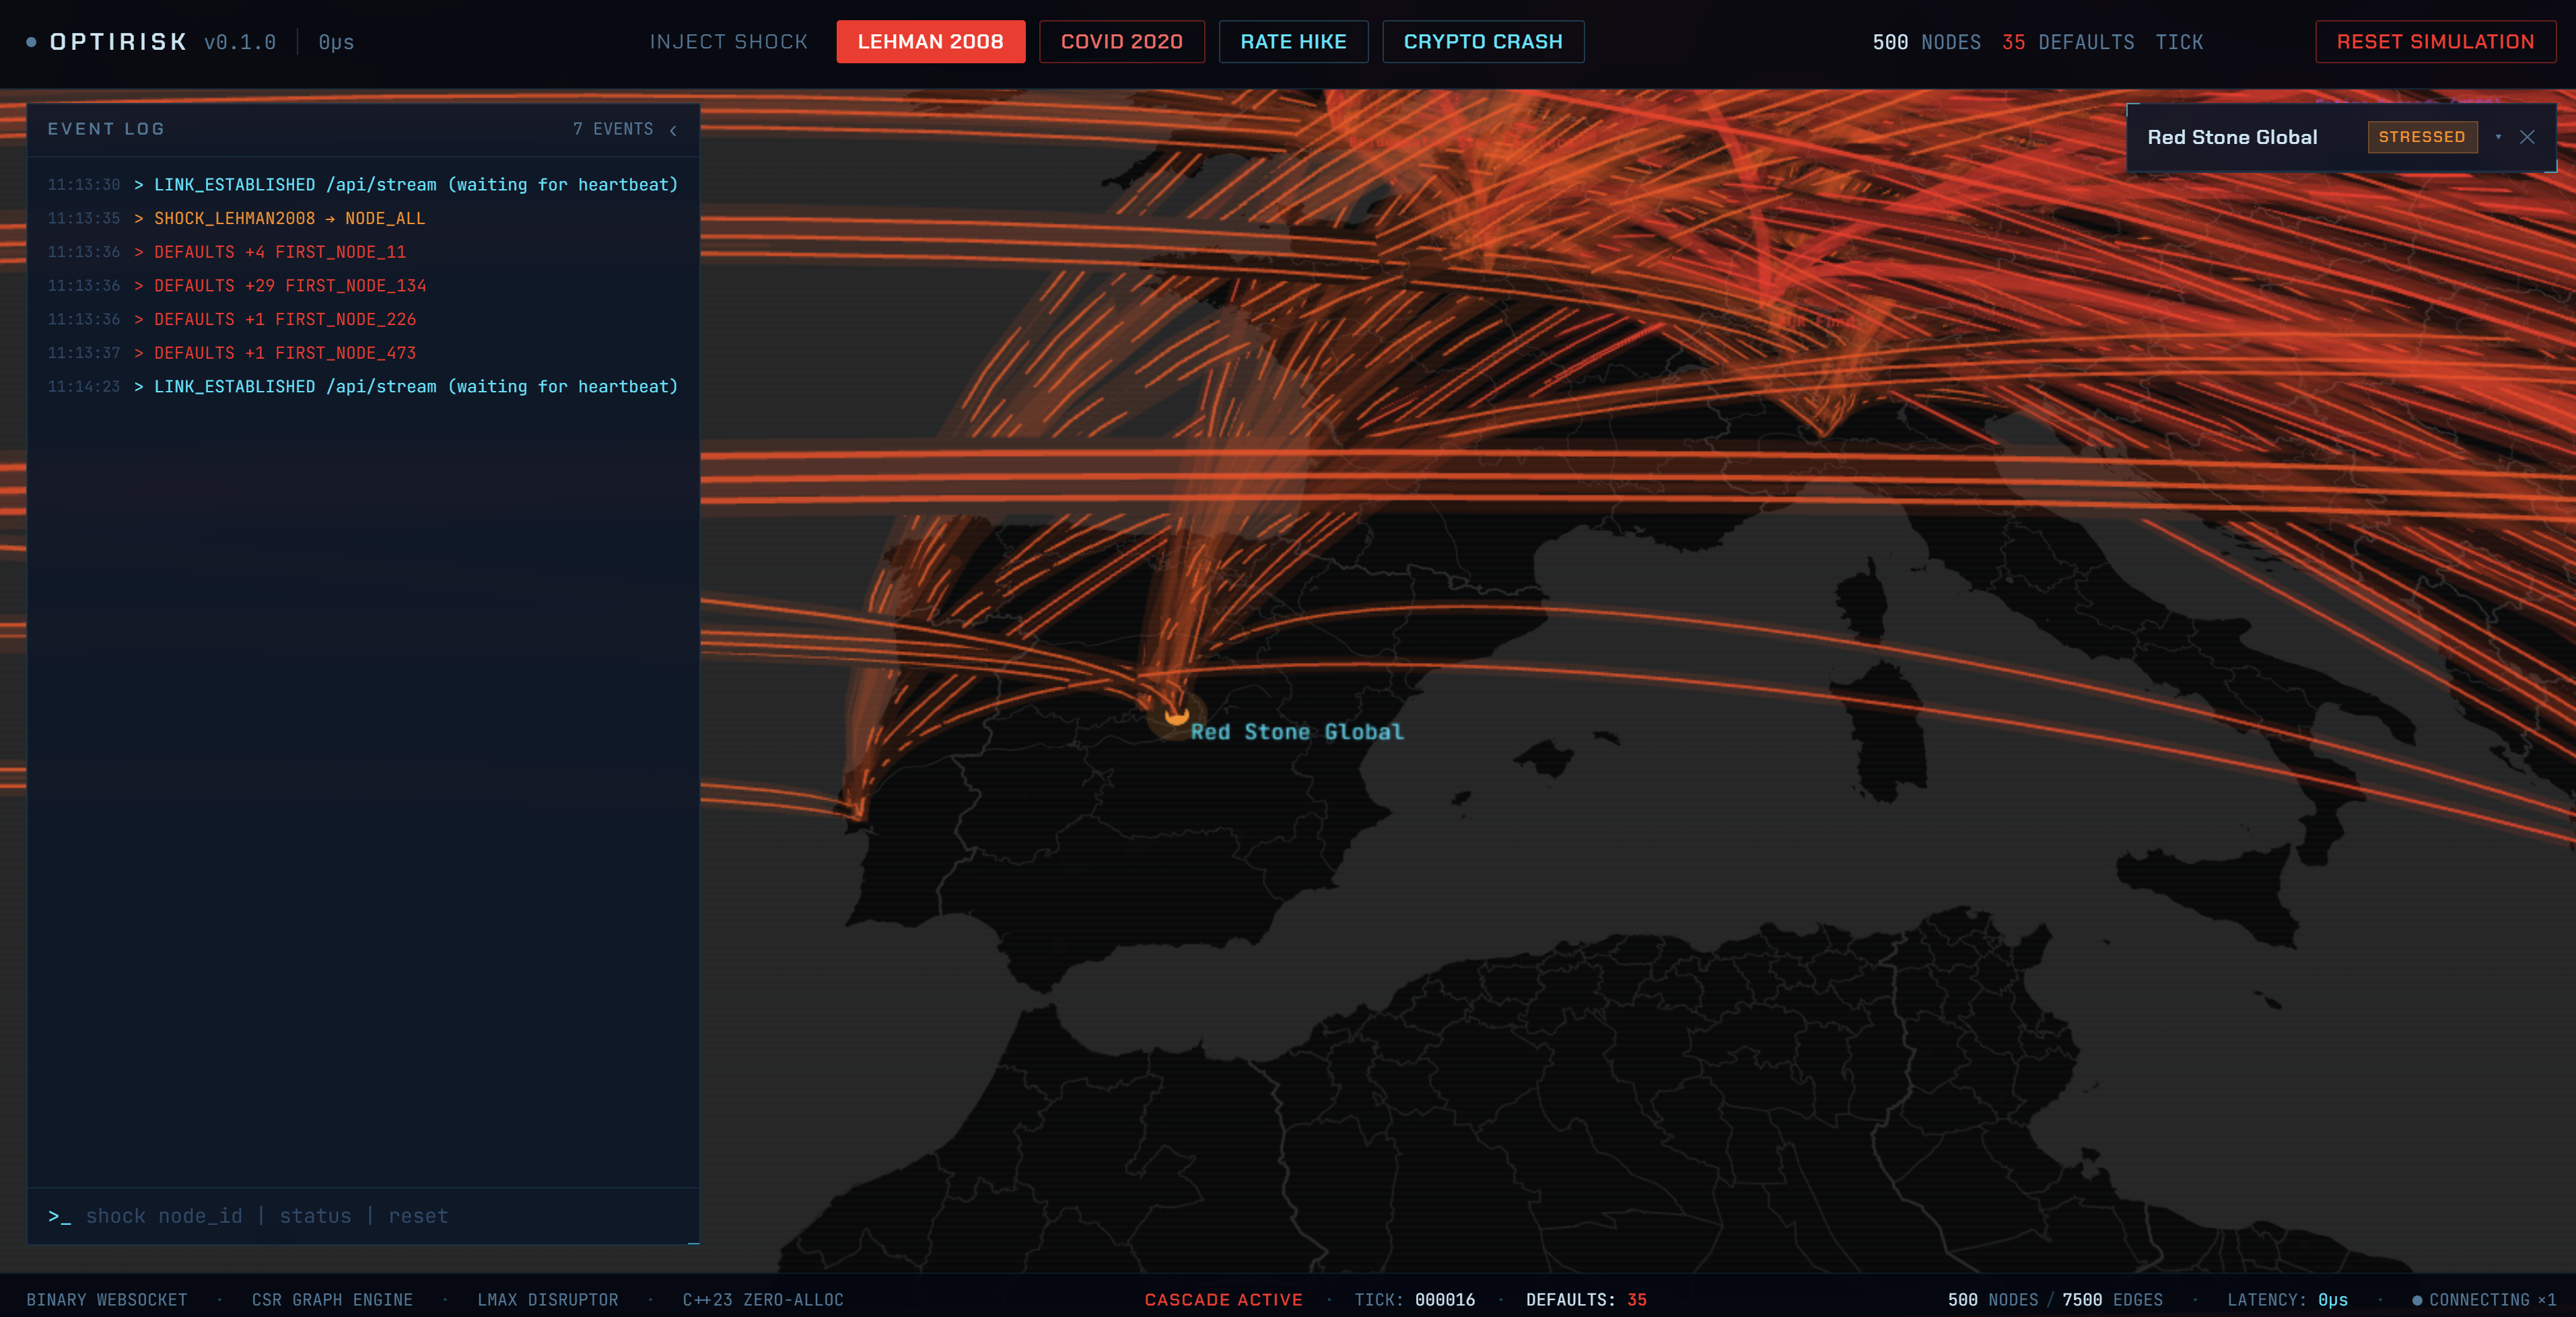
Risk simulation view

Inspiration
In September 2008, the collapse of Lehman Brothers, a Wall Street giant at the center of global finance, did not stay contained to just their firm. It triggered panic across the financial system, froze liquidity, and showed how quickly hidden counterparty exposure can spread far beyond Wall Street into pensions, businesses, and households. That moment made one thing clear: systemic risk is incredibly hard to see before it is already unfolding.
Financial crises rarely stay contained. A failure at one institution can ripple through counterparties, trigger forced liquidations, and quickly scale into a broader systemic problem. The problem is that most tools for understanding this risk are either too static, too slow, or too hard for decision-makers to use in the moment.
Therefore, we wanted to build a system that makes contagion visible, explainable, and actionable. Instead of forcing risk management teams to interpret disconnected spreadsheets and dashboards to inform their decisions, we imagined a live command center where a user can describe a probable market event in plain English, watch it spread across the financial network, and test interventions before losses cascade further.
OptiRisk was inspired by the idea that better financial infrastructure is not just good for trading firms, it matters for the real economy too. Systemic failures affect pensions, payroll, access to credit, and broader economic stability. If institutions can understand contagion earlier, they can act earlier.
What it does
OptiRisk is an AI-powered counterparty risk simulator for banks, prime brokerages, and institutional risk teams.
Users can trigger a stress scenario in natural language, such as a regional bank failure, a rates shock, or a commodity collapse. OptiRisk translates that scenario into simulation parameters, runs a high-frequency contagion model over a network of banks, firms, and sectors, and visualizes the spread of risk on an interactive geo-spatial graph.
The platform helps users:
- Simulate how a localized shock propagates through direct and indirect exposures
- Identify the most vulnerable counterparties and sectors
- Test interventions such as reducing exposure, increasing collateral, or isolating a failing node
- Compare before-and-after outcomes
- Generate a concise explanation of what happened and why
Instead of being just another finance dashboard, OptiRisk is built as a decision-support system for understanding second and third-order risk in real time.
How we built it
OptiRisk has two major layers: a high-performance simulation backend and an interactive AI-driven frontend. The architecture is based on a bare-metal C++23 backend and a Next.js/WebGL frontend, with a binary pipeline between them for low-latency updates.
1. Scenario Parser
A reasoning model takes a natural language stress prompt and converts it into structured shock parameters, such as affected asset classes, severity, geographies, and institution types.
2. Simulation Engine
The core contagion engine runs in C++23 and owns the simulation physics. It models the network in pre-shock mode and then transitions into simulation mode once a user-triggered event starts the cascade. The engine is designed around low-latency systems principles, with strict hot-path constraints, lock-free communication, and binary data structures.
3. Graph and Risk Propagation Layer
The backend updates node and edge state at high tick intervals as margin stress, defaults, and spillover propagate across the graph. The frontend does not compute the simulation itself. It receives frequent binary updates and renders the evolving contagion state.
4. Geo-Spatial Visualization
On the frontend, we used Next.js, TypeScript, MapLibre, and deck.gl to build a dark, desktop-first, Obsidian-inspired geo-graph interface. Banks, firms, and sectors are placed on a world map, and users can see the system move from a stable pre-shock network into an active contagion event.
5. Risk Explanation
After the simulation runs, the AI layer generates a plain-English explanation of the highest-risk paths, the exposed institutions, and which intervention most reduced projected damage.
Challenges we ran into
One of the hardest parts was balancing realism, speed, and clarity in a hackathon setting.
On the systems side, we had to design a backend that could support simulation updates without turning the whole project into an infrastructure rabbit hole. That meant being very intentional about where performance mattered most and keeping the hot path clean.
On the frontend side, rendering a dense graph on top of a world map in a way that still felt readable was surprisingly hard. We wanted it to look cinematic and intuitive, not like a cluttered quant terminal. Getting the map, edge animation, node updates, and user controls to feel coherent took a lot of iteration.
Another challenge was product framing. A pure risk tool can sound abstract or overly niche, so we had to make the story concrete: this is not just about banks protecting themselves, it is about making financial systems more understandable and more resilient.
Accomplishments that we're proud of
- Built a full loop from natural language shock input to simulation to intervention testing to explanation
- Connected a high-performance C++ backend with a modern geo-spatial frontend
- Created a visualization that makes systemic contagion legible to humans
- Turned a highly technical finance problem into something interactive, visual, and decision-oriented
Most of all, we are proud that the project captures how a local shock can evolve into a global cascade, and how the right intervention can meaningfully reduce its impact.
What we learned
We learned that financial risk is much easier to talk about than to communicate visually. Building OptiRisk pushed us to think not just like engineers, but like product designers for high-stakes systems.
We also learned that architecture choices matter when the experience depends on fast feedback. Keeping the simulation engine separate from the UI, using binary transport instead of text-heavy messaging, and treating the frontend as a visualization layer made the system much more responsive.
What's next for OptiRisk
Our next step is to move from a hackathon prototype toward a more realistic internal risk operations tool.
We would like to add:
- Richer intervention logic for hedging, collateral management, and exposure caps
- Support for ingesting real portfolio and counterparty data
- Scenario libraries based on historical crises and macro events
- Collaborative risk briefings for multiple team members
- Streaming agent updates so users can watch the system reason through the shock in real time
- Internal chat or ops workflow integration so risk teams can trigger simulations directly from their work stack
Longer term, we see OptiRisk as a system that helps institutions move from reactive crisis response to proactive resilience and prevention planning.
Built With
- c++23
- clob
- deck.gl
- k2-think-v2
- maplibre
- python
- react
- typescript
- ultra-low-latency-systems
- webgl


Log in or sign up for Devpost to join the conversation.