

Inspiration
Options trading gives retail traders flexibility and leverage, but the moment you try to understand your actual profit and loss, everything becomes confusing. Broker CSVs are cryptic, multi‑leg strategies get mixed together, and even experienced traders struggle to reconstruct what happened. I’ve personally traded options for years, and every time I tried to calculate P&L from raw statements, it felt like detective work. The inspiration for Option P&L Explainer came from that frustration: Why isn’t there a simple, AI‑powered tool that reads your brokerage CSV and tells you—in plain English—what you traded, why you made or lost money, and what the strategy actually means? So I built one.
What it does
Option P&L Explainer takes a raw brokerage CSV and transforms it into a clean, intuitive breakdown of your trades.
- Automatically detects strategies (credit spreads, debit spreads, single options, etc.)
- Groups legs correctly—even when the CSV is messy
- Computes realized P&L, max profit, max loss, and lifecycle dates
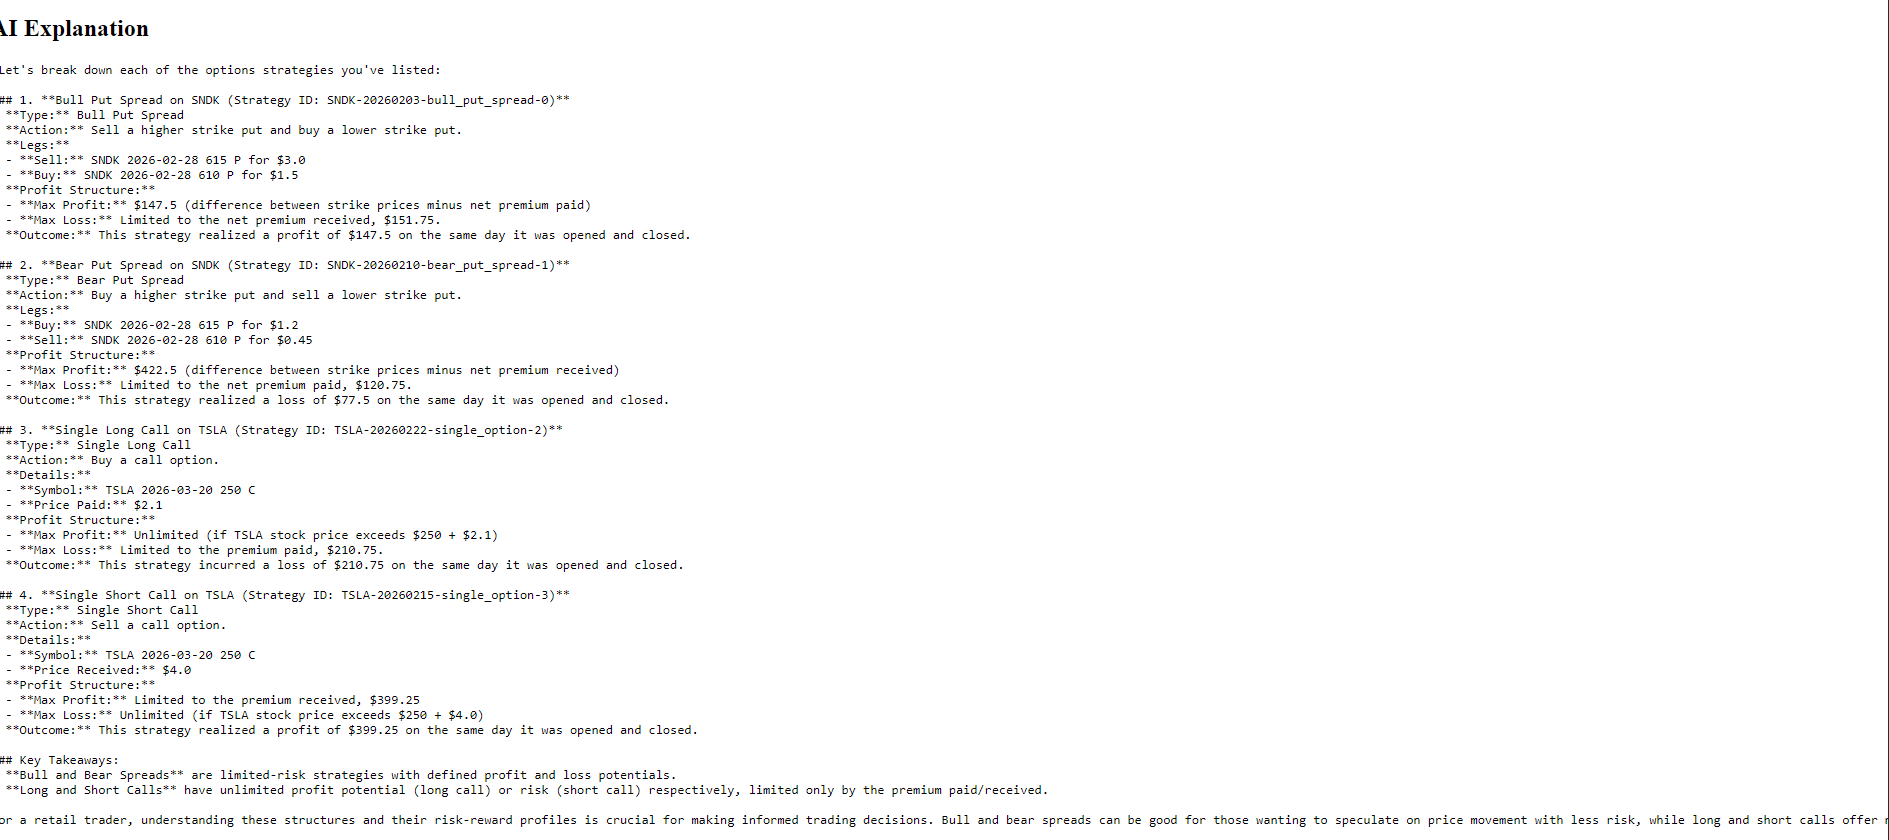
- Generates a natural‑language explanation using Reka
- Displays everything in a clean React UI with strategy cards and an explanation panel In short: It turns confusing CSVs into clear, explainable insights for retail traders.
How I built it
The project is a full‑stack system built from the ground up: Backend (FastAPI)
- Parses CSV files with robust UTF‑8 / cp1252 decoding
- Uses Pandas to normalize and clean trade data
- Groups trades into strategies using rule‑based logic
- Computes P&L, max profit, max loss, and open/close dates
- Sends structured strategy data to Reka for explanation
- Returns JSON to the UI AI Layer (Reka)
- Takes strategy metadata
- Generates a human‑readable explanation
- Describes risk, payoff, and outcome
- Helps beginners understand what they actually traded Frontend (Next.js)
- CSV upload component
- Strategy cards with P&L
- Leg breakdowns
- AI explanation viewer
- Clean, fintech‑style layout Everything runs locally with a single script that launches both backend and UI.
Challenges I ran into
Several real‑world challenges shaped the final product:
- CSV encoding issues — brokerage files often use cp1252 instead of UTF‑8
- Strategy grouping — multi‑leg trades don’t always appear in order
- P&L reconstruction — net credit/debit must be computed from multiple legs
- CORS issues — UI and backend run on different ports
- AI prompt engineering — getting Reka to produce consistent, structured explanations
- UI rendering — ensuring React updates correctly after file upload Each challenge forced us to refine the architecture and make the system more robust.
🟦 Accomplishments that we're proud of
- Built a full backend engine that accurately reconstructs options strategies
- Created a clean UI that makes complex trades easy to understand
- Integrated Reka to generate clear, beginner‑friendly explanations
- Solved CSV decoding and strategy grouping in a deterministic way
- Delivered a polished, hackathon‑ready demo with real data
- Turned a personal pain point into a tool that can help thousands of traders The biggest accomplishment: making options P&L understandable for the first time.
🟦 What we learned
- Retail brokerage data is messy and inconsistent
- Multi‑leg options strategies require careful rule‑based grouping
- AI explanations dramatically improve user understanding
- A clean UI matters as much as backend accuracy
- Small details (like CORS, encoding, or JSON shape) can block the entire pipeline
- Building a full‑stack AI product requires tight integration between backend, UI, and LLMs Most importantly, we learned that AI can bridge the gap between complex financial data and human understanding.
🟦 What's next for Option P&L Explainer Several powerful enhancements are already planned:
- P&L charts and visualizations
- Strategy timelines (open → close → expiration)
- Greeks estimation and risk metrics
- Multi‑account support
- Exportable PDF reports
- Real‑time brokerage integration
- A mobile‑friendly UI
- A “What‑If Simulator” powered by AI The long‑term vision is to build a full AI‑native options analytics platform that helps retail traders understand risk, probability, and outcomes with clarity and confidence.
If you want, I can also generate a GitLab project description, hackathon pitch script, or LinkedIn announcement based on this.
Accomplishments that I'm proud of
- Built a full backend engine that accurately reconstructs options strategies
- Created a clean UI that makes complex trades easy to understand
- Integrated Reka to generate clear, beginner‑friendly explanations
- Solved CSV decoding and strategy grouping in a deterministic way
- Delivered a polished, hackathon‑ready demo with real data
- Turned a personal pain point into a tool that can help thousands of traders The biggest accomplishment: making options P&L understandable for the first time.
🟦 What we learned
- Retail brokerage data is messy and inconsistent
- Multi‑leg options strategies require careful rule‑based grouping
- AI explanations dramatically improve user understanding
- A clean UI matters as much as backend accuracy
- Small details (like CORS, encoding, or JSON shape) can block the entire pipeline
- Building a full‑stack AI product requires tight integration between backend, UI, and LLMs Most importantly, we learned that AI can bridge the gap between complex financial data and human understanding.
🟦 What's next for Option P&L Explainer Several powerful enhancements are already planned:
- P&L charts and visualizations
- Strategy timelines (open → close → expiration)
- Greeks estimation and risk metrics
- Multi‑account support
- Exportable PDF reports
- Real‑time brokerage integration
- A mobile‑friendly UI
- A “What‑If Simulator” powered by AI The long‑term vision is to build a full AI‑native options analytics platform that helps retail traders understand risk, probability, and outcomes with clarity and confidence.
If you want, I can also generate a GitLab project description, hackathon pitch script, or LinkedIn announcement based on this.

Log in or sign up for Devpost to join the conversation.