-
-
Overall Dashboard Overview
-
x86 Laptop Benchmark Results
-
x86 Optimization Performance Comparison
-
AWS Graviton ARM Benchmark Results
-
Cross-Platform Optimization Results
OptiArm Cloud Studio
What We Built
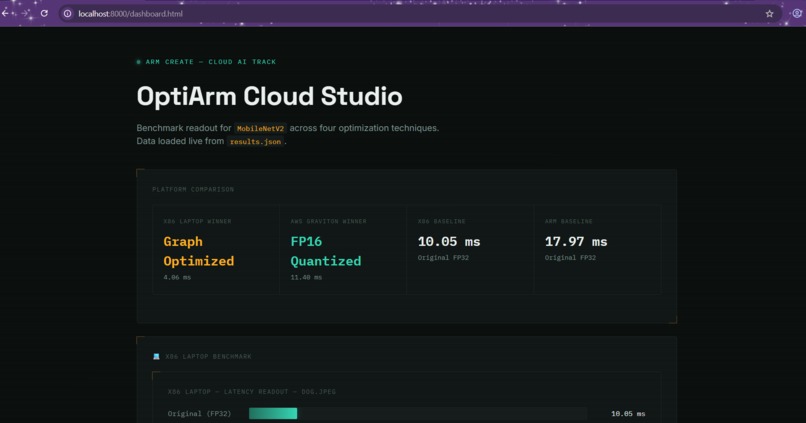
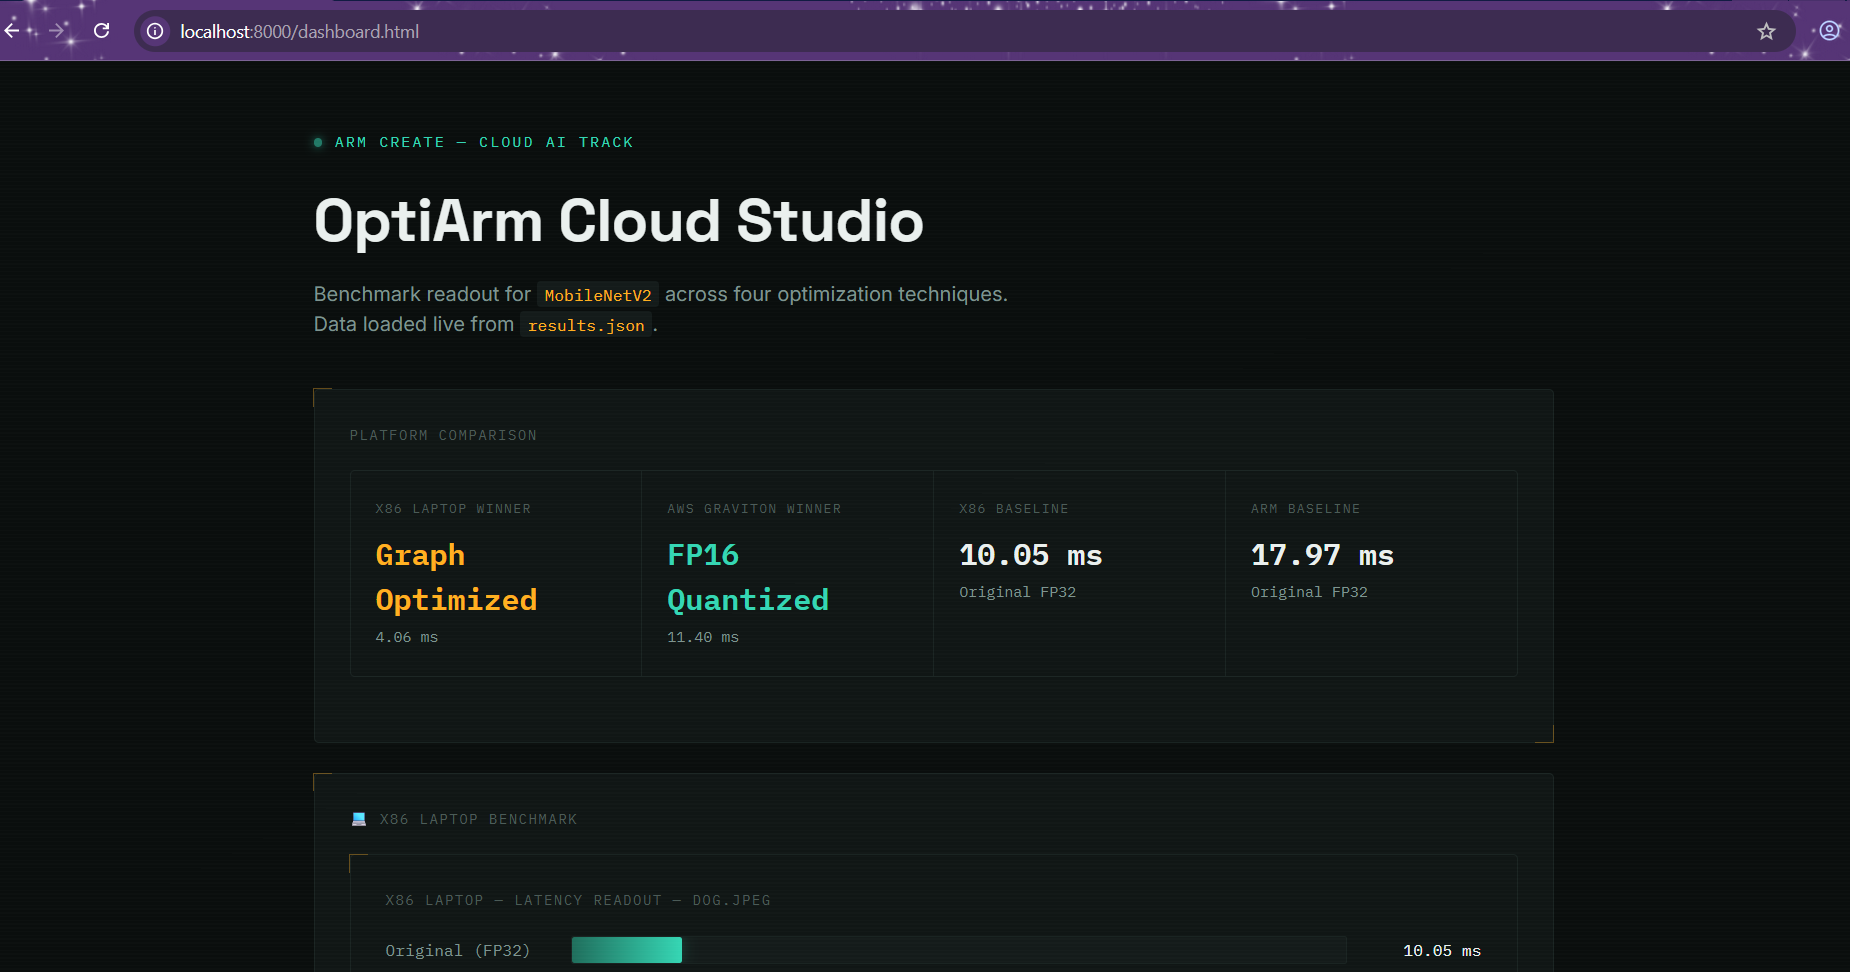
OptiArm Cloud Studio is a benchmarking and optimization workflow built around MobileNetV2. The main idea was simple: instead of assuming that one optimization technique works best everywhere, we wanted to actually test different techniques on different hardware and see what happens.
We tested four versions of MobileNetV2:
- Original FP32 model
- INT8 Quantized model
- FP16 Quantized model
- Graph Optimized model
Each version was tested on both a local x86 laptop and AWS Graviton/Arm hardware. We measured inference latency, model size, CPU usage, memory usage, and whether the optimized model produced the same prediction as the original model.
The results are presented through an interactive dashboard that makes it easier to compare the two platforms and choose the best optimization for each one.
What Inspired Us
One question motivated us throughout the project:
Does an optimization that works well on a normal laptop also work well on Arm hardware?
It is easy to assume that techniques such as quantization will always make an AI model faster or smaller. But hardware can behave very differently.
So, rather than making assumptions, we decided to build a small benchmarking workflow that could give us actual measurements. This became especially interesting when we started comparing our laptop results with AWS Graviton, an Arm-based cloud platform.
Our goal was to make the optimization process more practical:
Optimize → Benchmark → Compare → Visualize → Recommend
How We Built It
We started with ONNX MobileNetV2 as our baseline model and created different optimized versions using quantization and graph optimization techniques.
We then ran the same inference workflow for every model variant using the same reference image. The benchmark collected:
- Inference latency
- CPU usage
- Memory usage
- Model size
- Predicted class
- Prediction consistency
The benchmark results were saved as JSON data and connected to a custom HTML dashboard.
The dashboard has three main sections:
- x86 Laptop Benchmark
- AWS Graviton / Arm Benchmark
- Final Cross-Platform Comparison
Instead of only displaying raw terminal results, the dashboard highlights the fastest and smallest models and gives a recommendation for each platform.
What the Results Showed
x86 Laptop
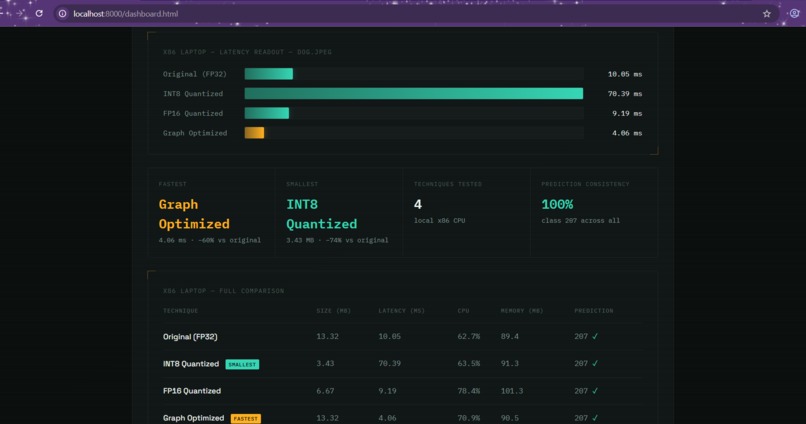
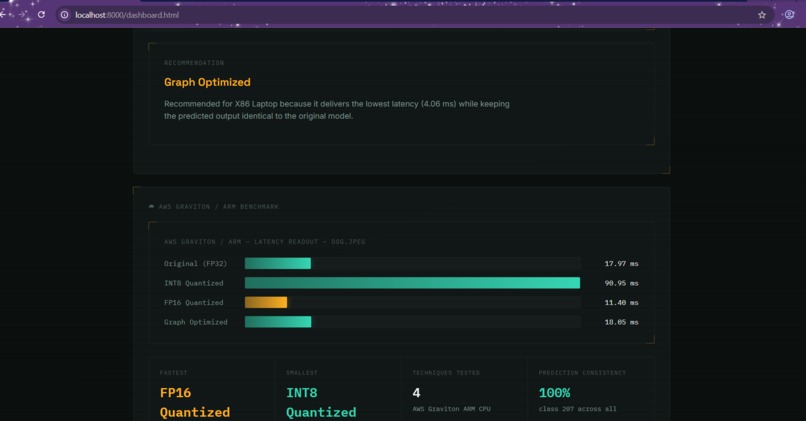
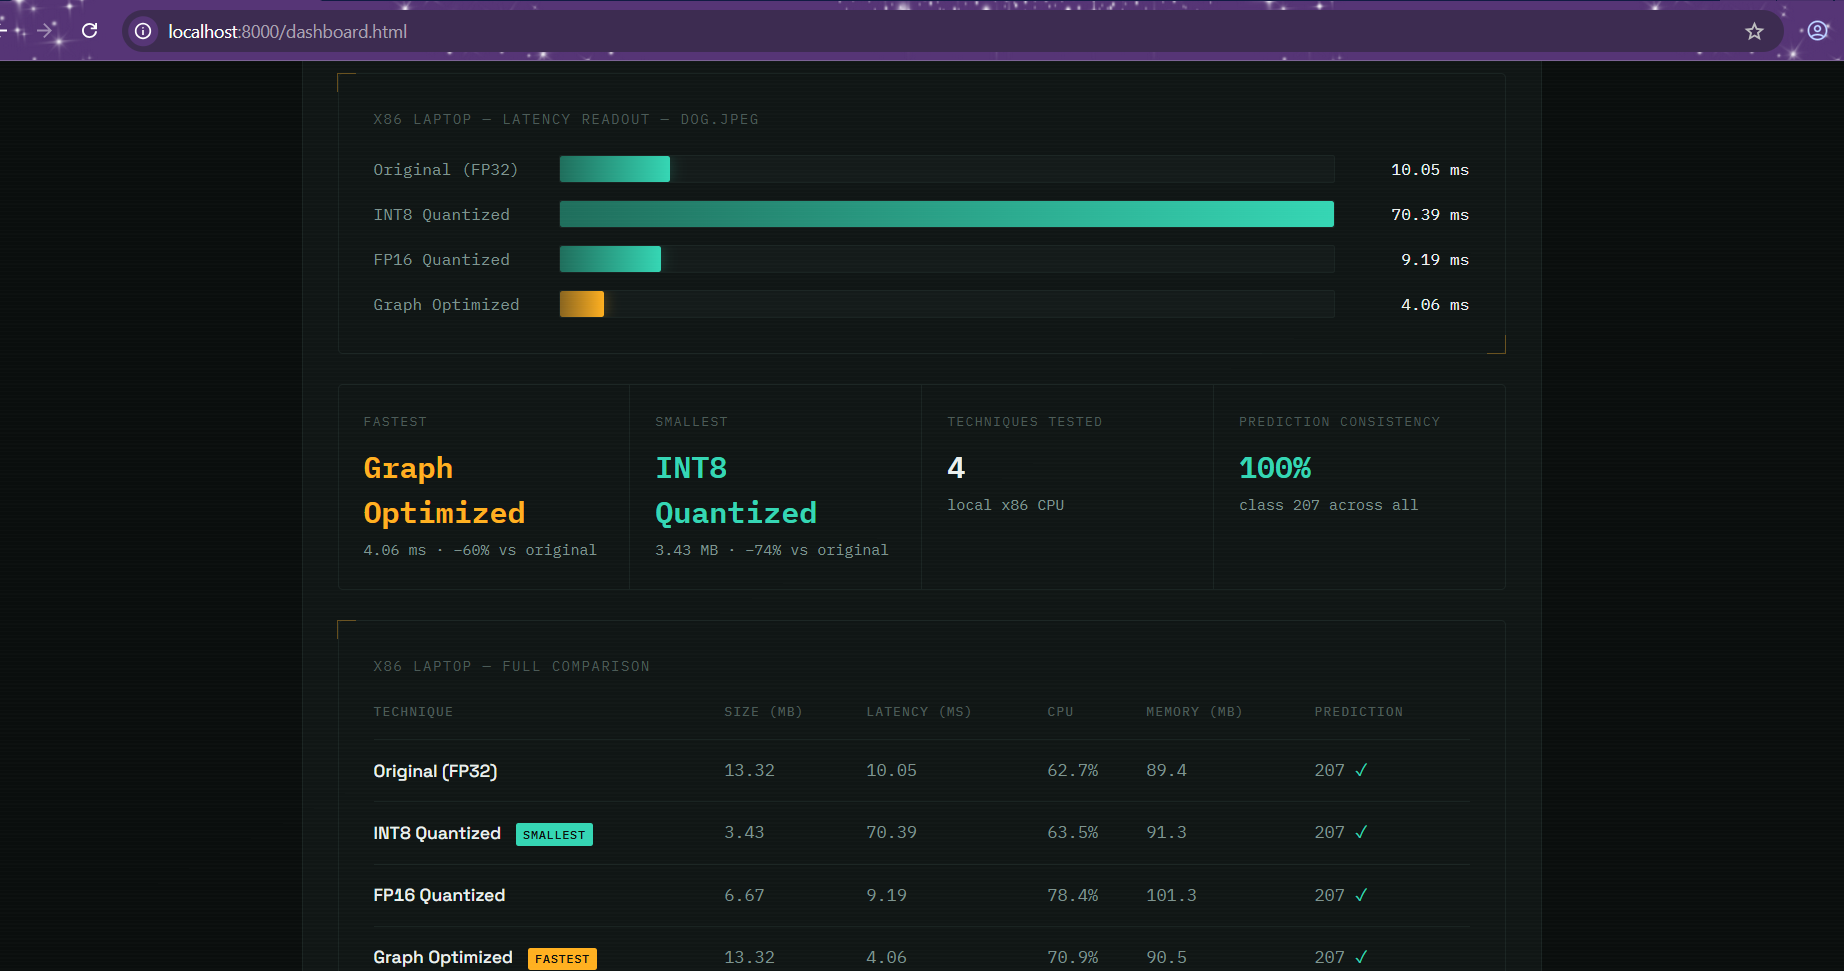
Our x86 laptop produced the following latency results:
| Optimization | Latency |
|---|---|
| Original FP32 | 10.05 ms |
| INT8 Quantized | 70.39 ms |
| FP16 Quantized | 9.19 ms |
| Graph Optimized | 4.06 ms |
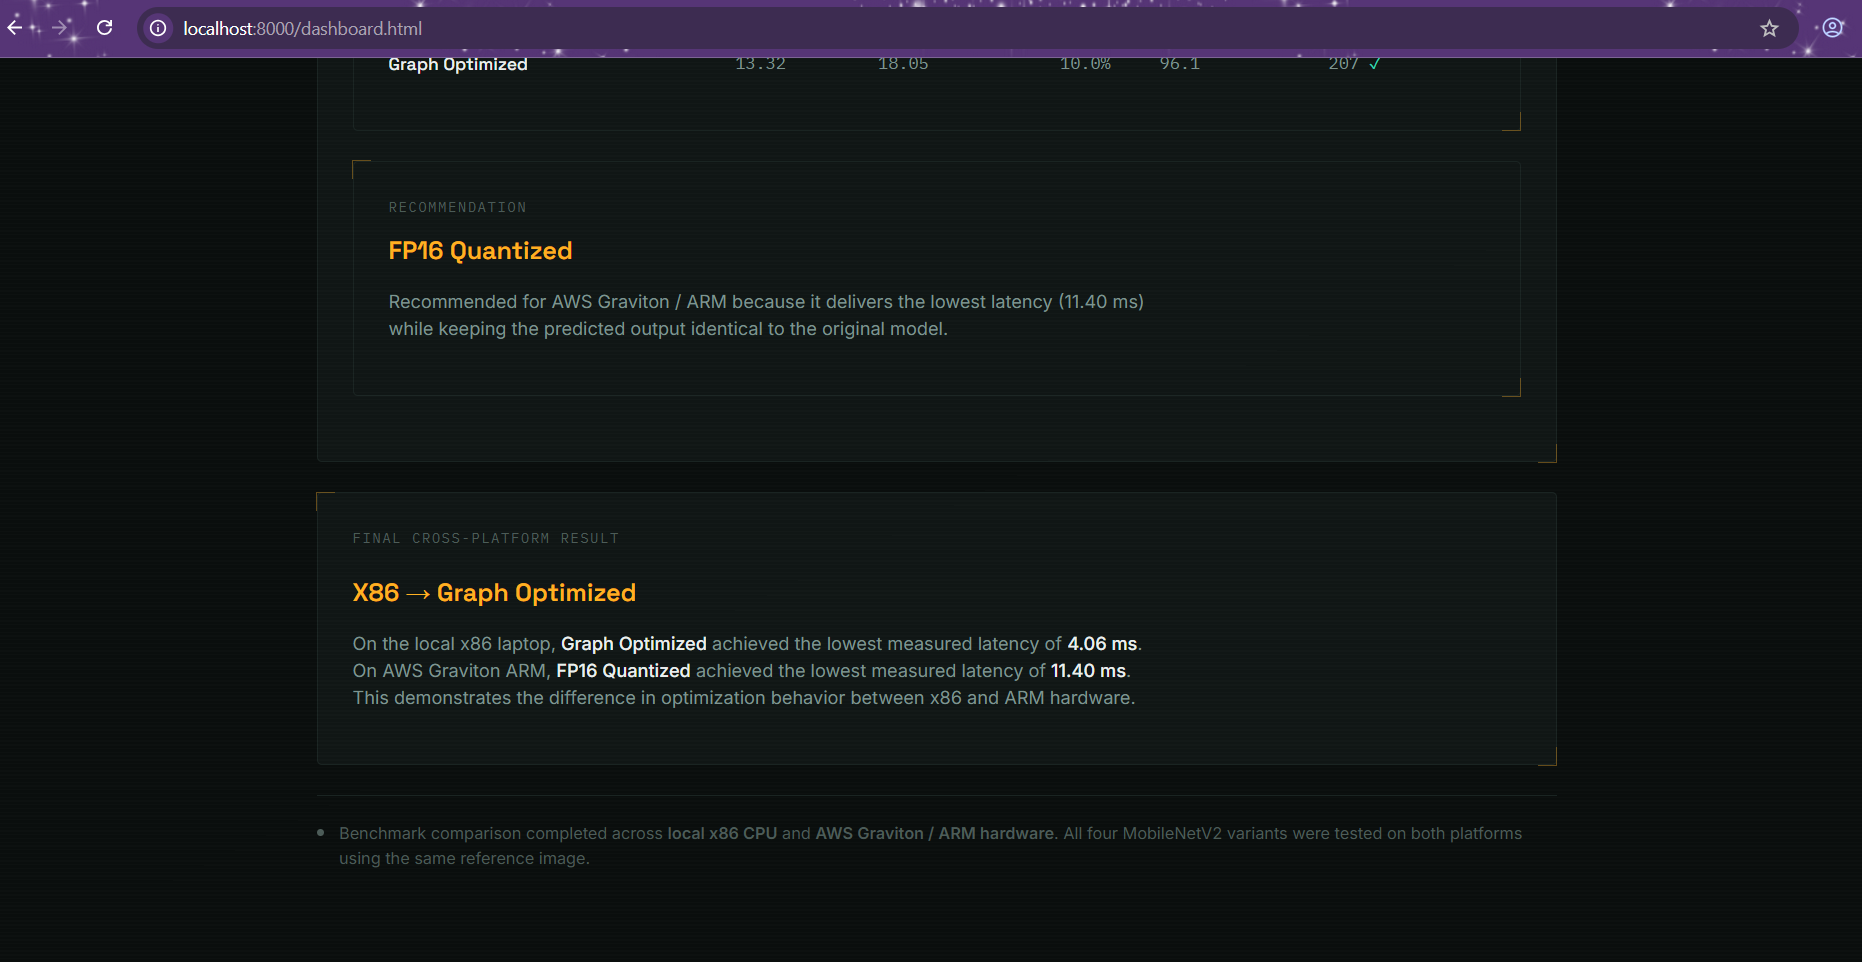
On the x86 laptop, Graph Optimization was the fastest, reaching a measured latency of 4.06 ms.
Interestingly, INT8 was not faster in this particular test. This was a useful reminder that simply reducing numerical precision does not automatically guarantee better inference performance.
AWS Graviton / Arm
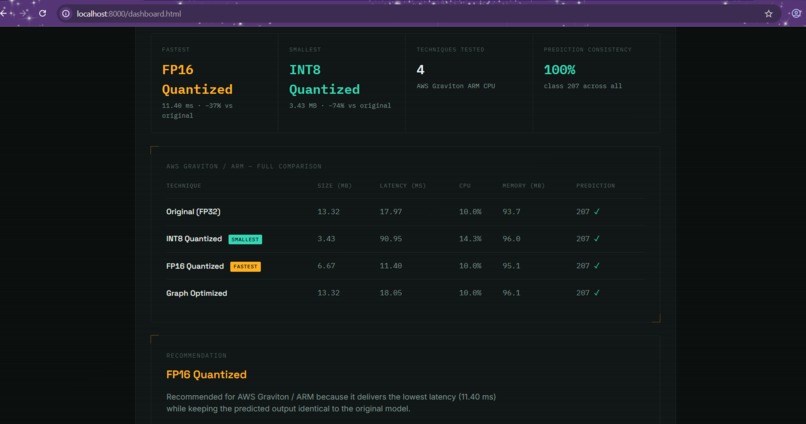
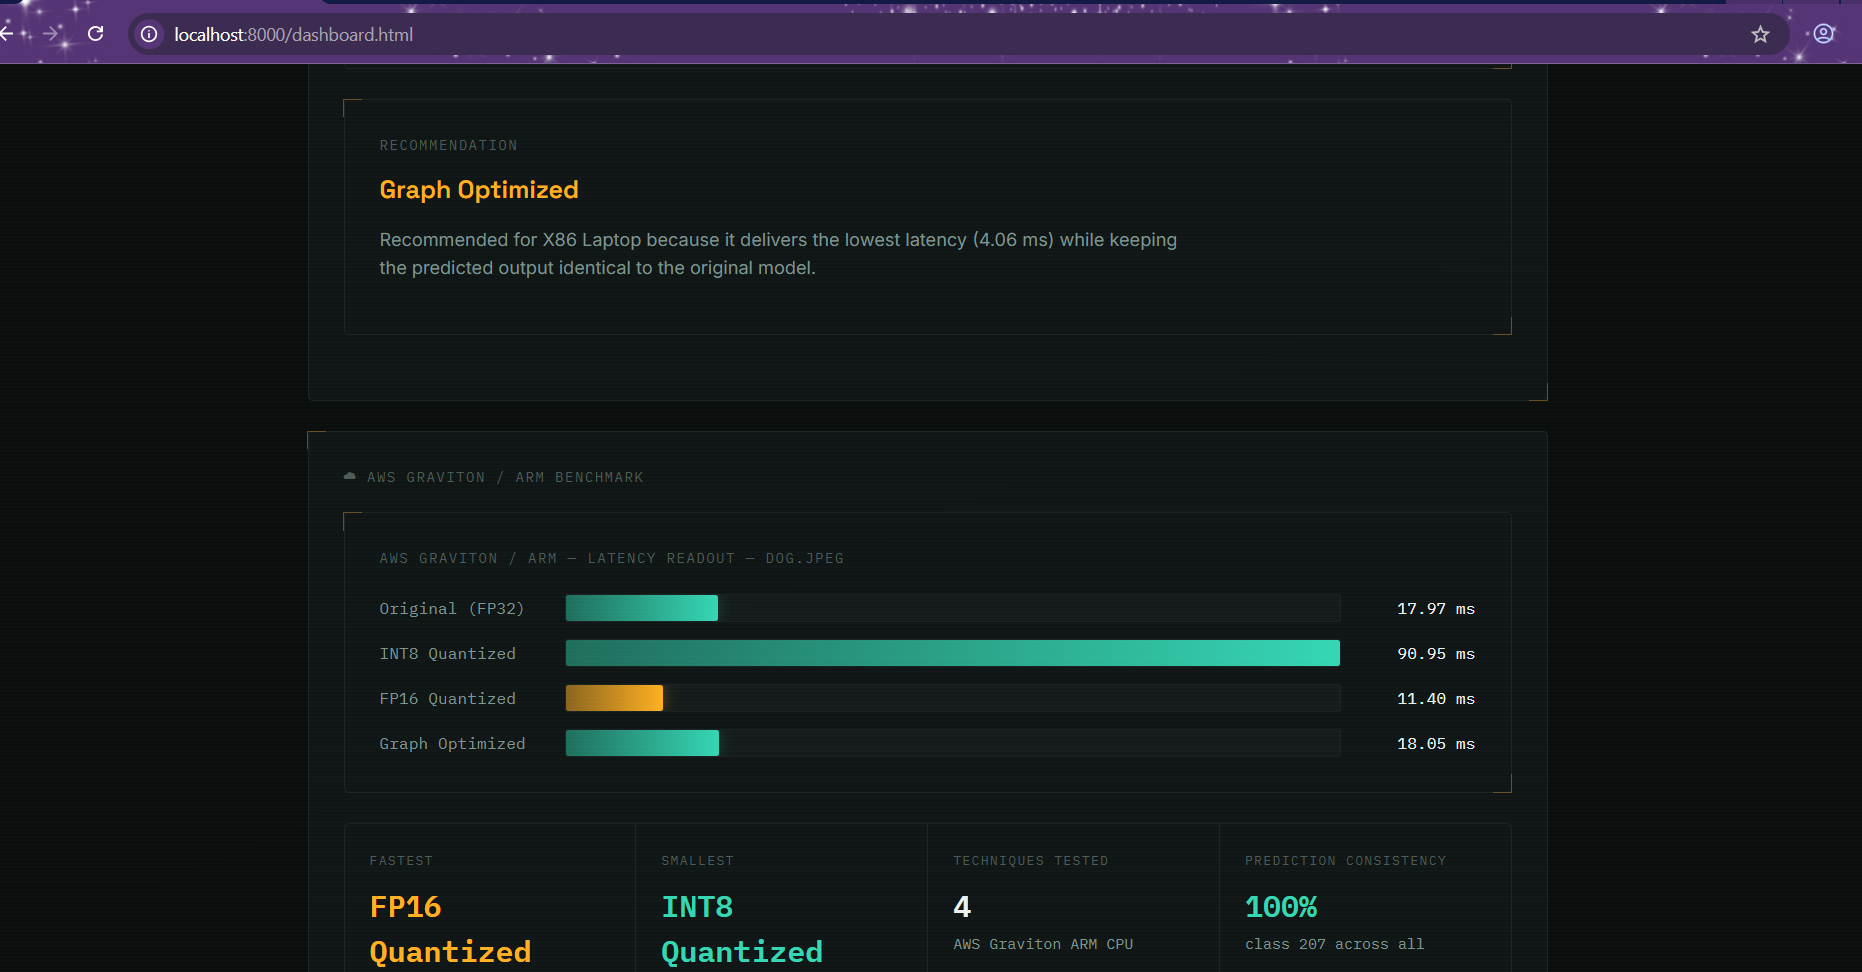
On the AWS Graviton/Arm environment, the results were different:
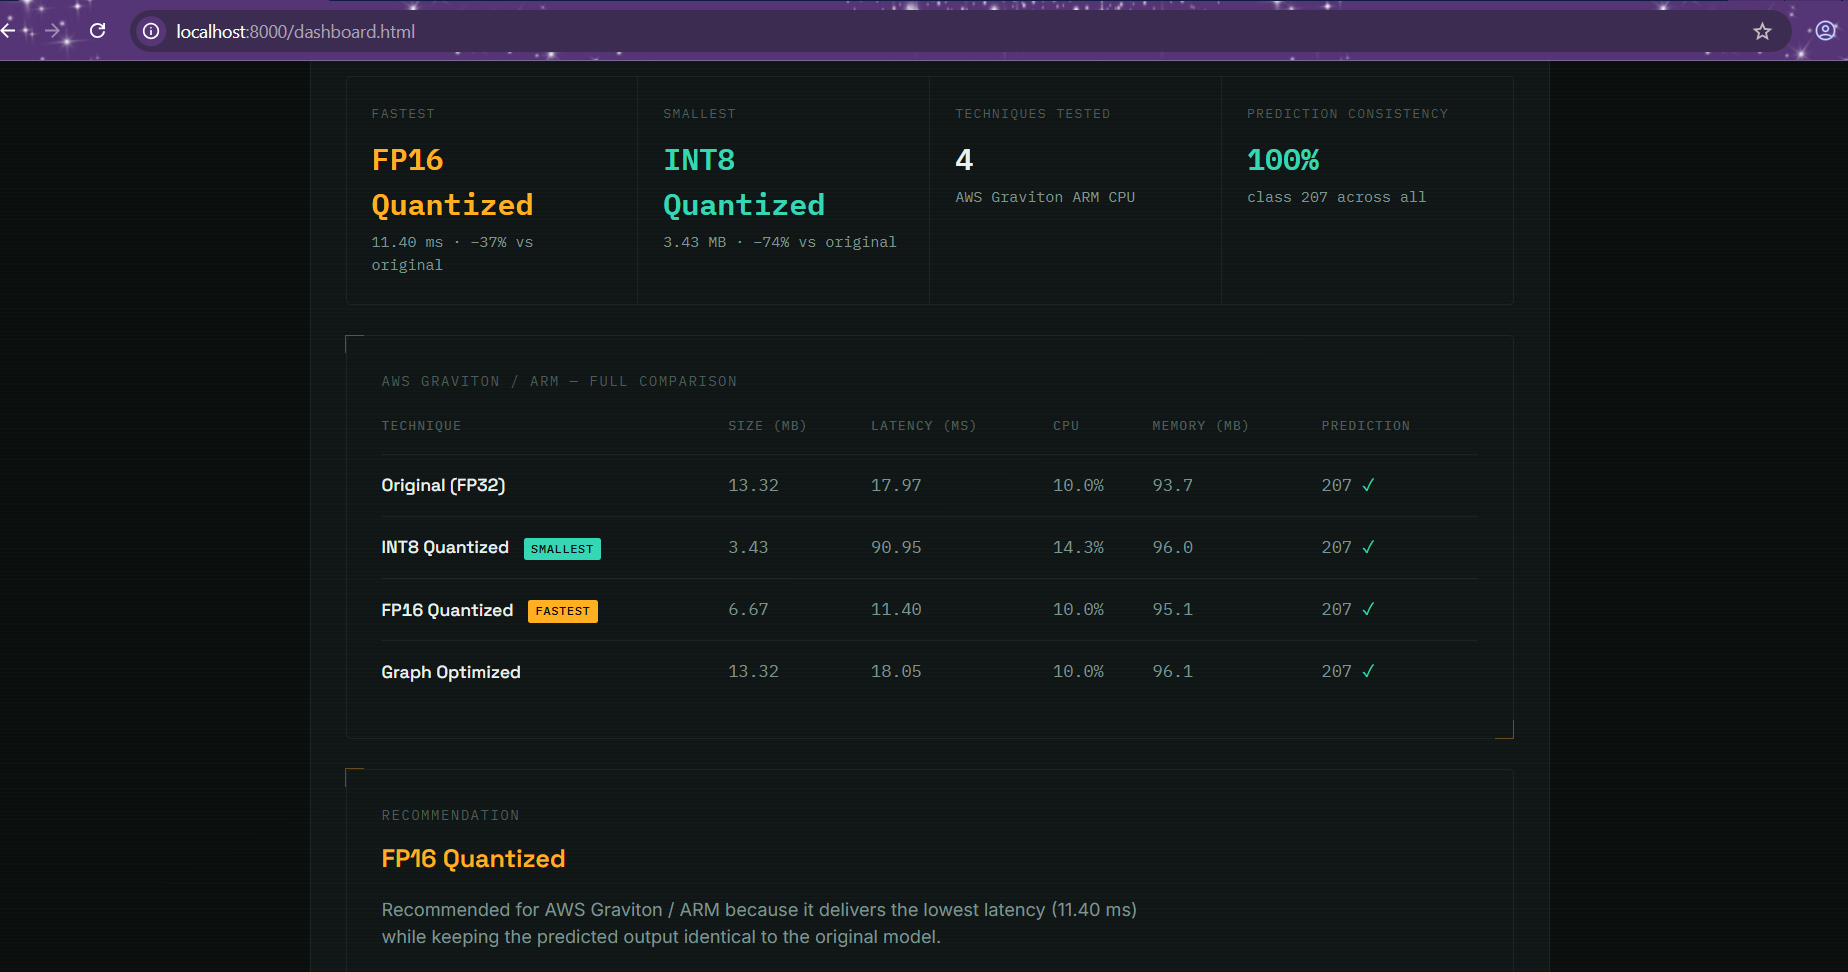
| Optimization | Latency |
|---|---|
| Original FP32 | 17.97 ms |
| INT8 Quantized | 90.95 ms |
| FP16 Quantized | 11.40 ms |
| Graph Optimized | 18.05 ms |
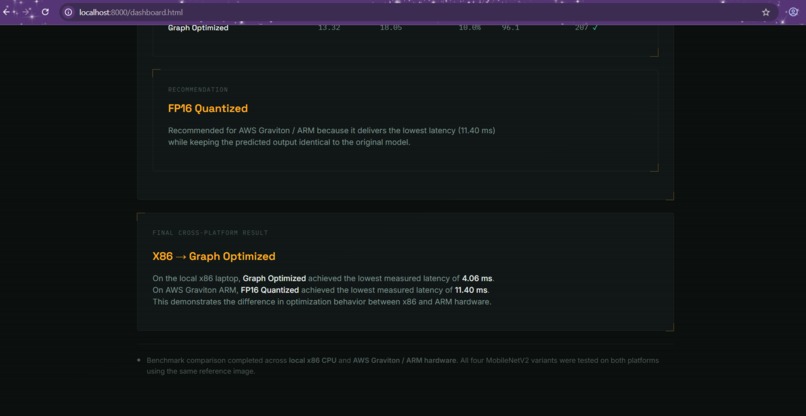
Here, FP16 Quantization performed the best, with a measured latency of 11.40 ms.
All four model variants produced the same predicted class as the original model for the reference image used in our benchmark.
Challenges We Ran Into
One of our biggest challenges was keeping the benchmarking process consistent between the x86 laptop and AWS Graviton/Arm environment.
We had to make sure that the same models, input image, and inference workflow were being used so that the comparison would be meaningful.
We also had to deal with different model optimization formats and make sure every model could be loaded and executed correctly through the inference runtime.
Another interesting challenge was understanding results that we did not initially expect. For example, INT8 produced a smaller model, but it was not the fastest option on either platform in our measurements.
This taught us an important lesson: optimization needs to be measured on the hardware where the model will actually run.
Accomplishments We're Proud Of
We are particularly proud that we were able to take the project beyond simply creating optimized models.
We built a complete workflow that:
- Creates multiple MobileNetV2 variants
- Benchmarks them on two different hardware platforms
- Collects system-level performance measurements
- Checks prediction consistency
- Stores the results in structured JSON files
- Presents the results through an interactive dashboard
- Provides a platform-specific recommendation
The final dashboard gives us a much clearer view of how the same optimization techniques behave differently on x86 and Arm.
What We Learned
The biggest takeaway from this project was that AI model optimization is hardware-dependent.
Our x86 laptop favored Graph Optimization, while AWS Graviton/Arm favored FP16 Quantization.
That difference was probably the most valuable result of the project because it showed us that there is no single optimization technique that should automatically be considered the best.
We also learned how to create reproducible benchmarks, work with optimized ONNX models, collect CPU and memory measurements, compare inference performance, and turn raw benchmark data into an understandable dashboard.
Most importantly, we learned to benchmark first and make optimization decisions based on evidence rather than assumptions.
How We Used Arm
For the Arm side of the project, we used AWS Graviton as our validation platform.
We ran the same MobileNetV2 variants on the Arm environment and compared the results against our local x86 laptop.
This allowed us to see how optimization techniques behave on an Arm-powered cloud platform and identify the optimization that performed best specifically on that hardware.
For our benchmark, FP16 Quantization achieved the lowest latency on AWS Graviton at 11.40 ms while maintaining the same predicted class as the original model.
Final Outcome
OptiArm Cloud Studio turned our initial question into a practical benchmarking workflow.
Instead of asking “Which optimization is best?”, the project asks:
“Which optimization is best for this particular hardware?”
The final workflow is:
Optimize → Benchmark → Compare → Visualize → Recommend
Our results demonstrate why hardware-aware optimization matters when deploying AI workloads, especially across different architectures such as x86 and Arm.
What's Next for OptiArm Cloud Studio?
We see several ways to take the project further.
In future versions, we would like to test more AI models, run larger benchmark workloads, include more Arm-based environments, and collect longer-running performance measurements.
We could also extend the dashboard with additional metrics such as throughput, energy efficiency, and cost per inference.
The long-term goal is to turn OptiArm Cloud Studio into a more general hardware-aware AI optimization and benchmarking tool that helps developers choose the right model optimization for their target platform.

Log in or sign up for Devpost to join the conversation.