-
-
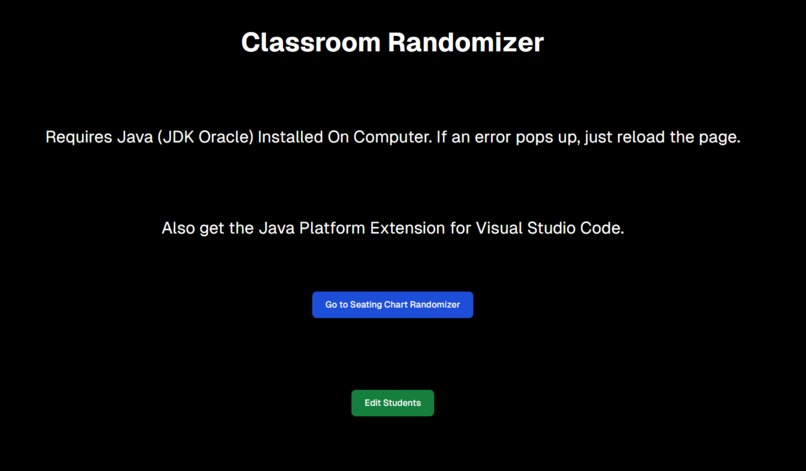
Home Page
-
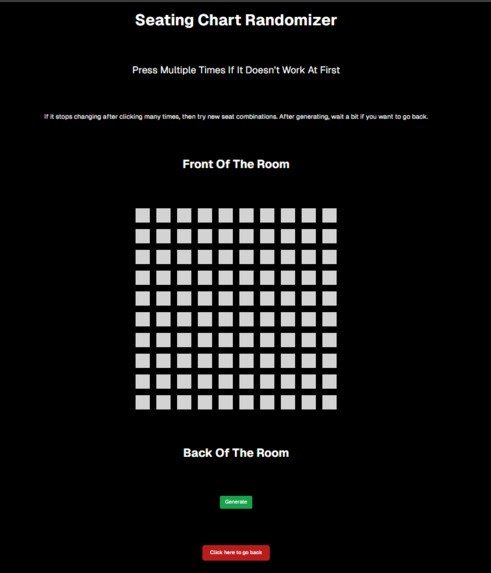
Generator Page
-
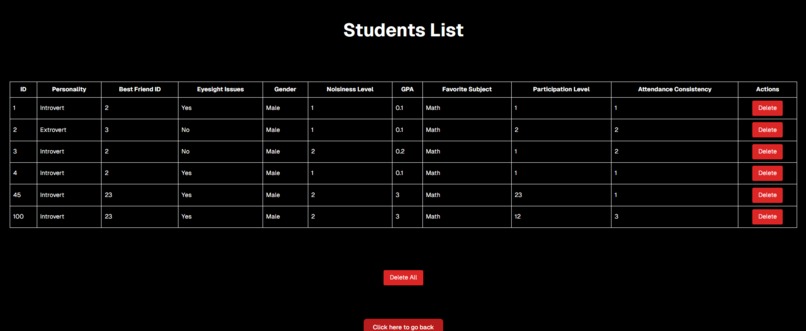
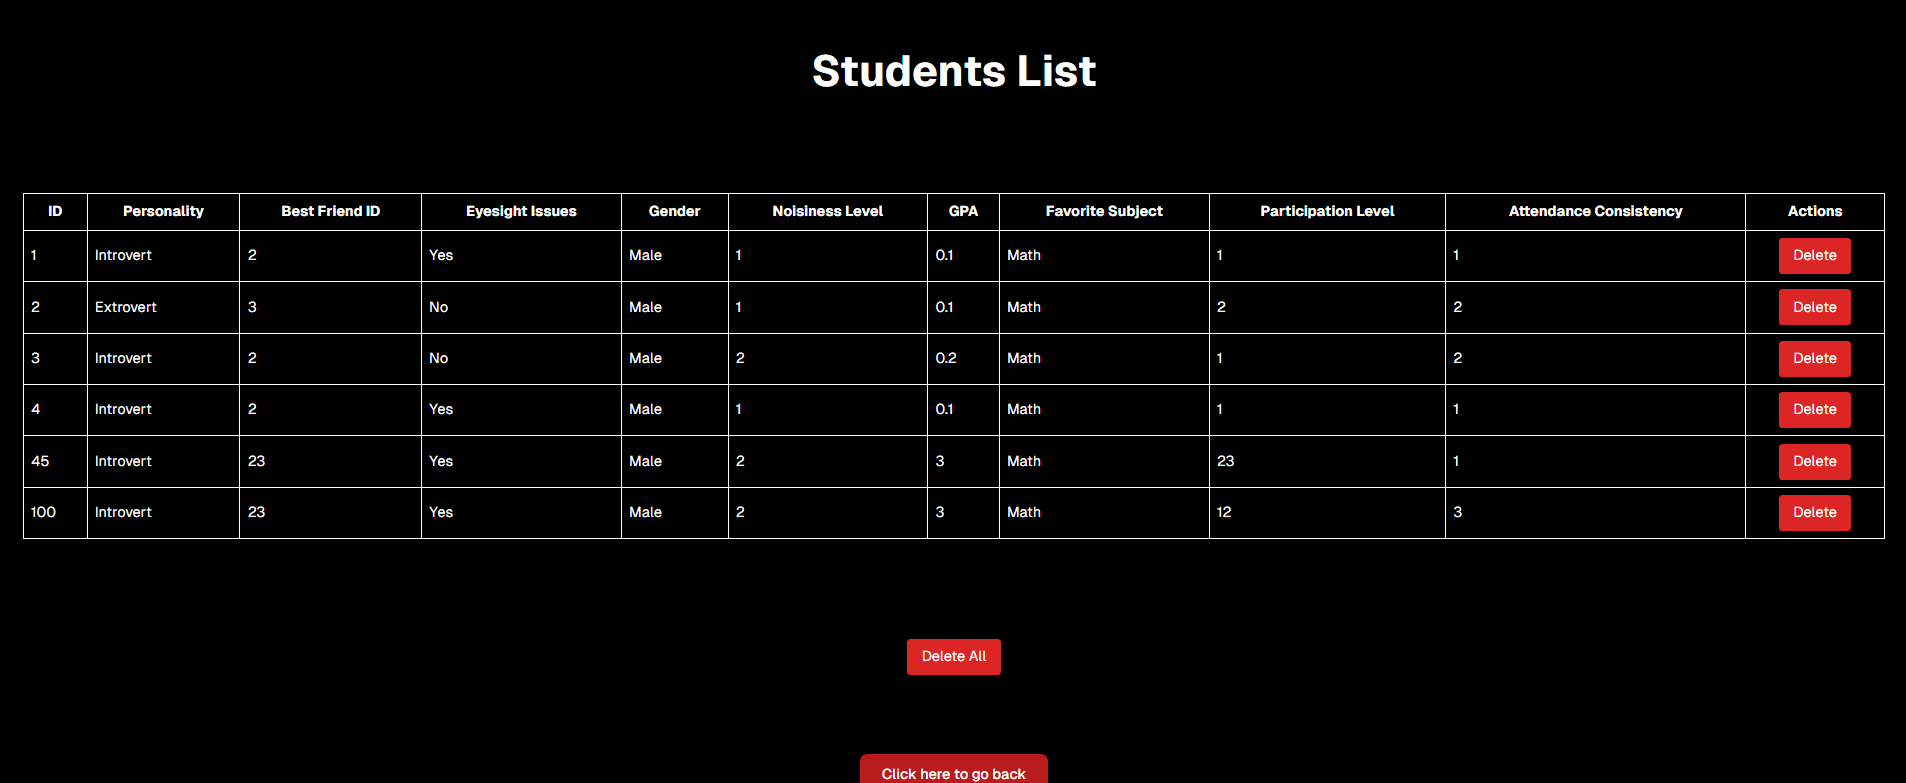
Student List Page
-
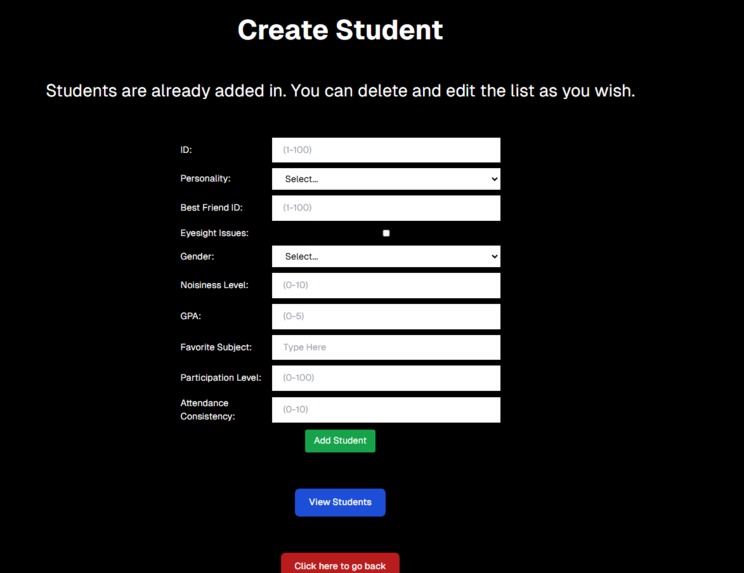
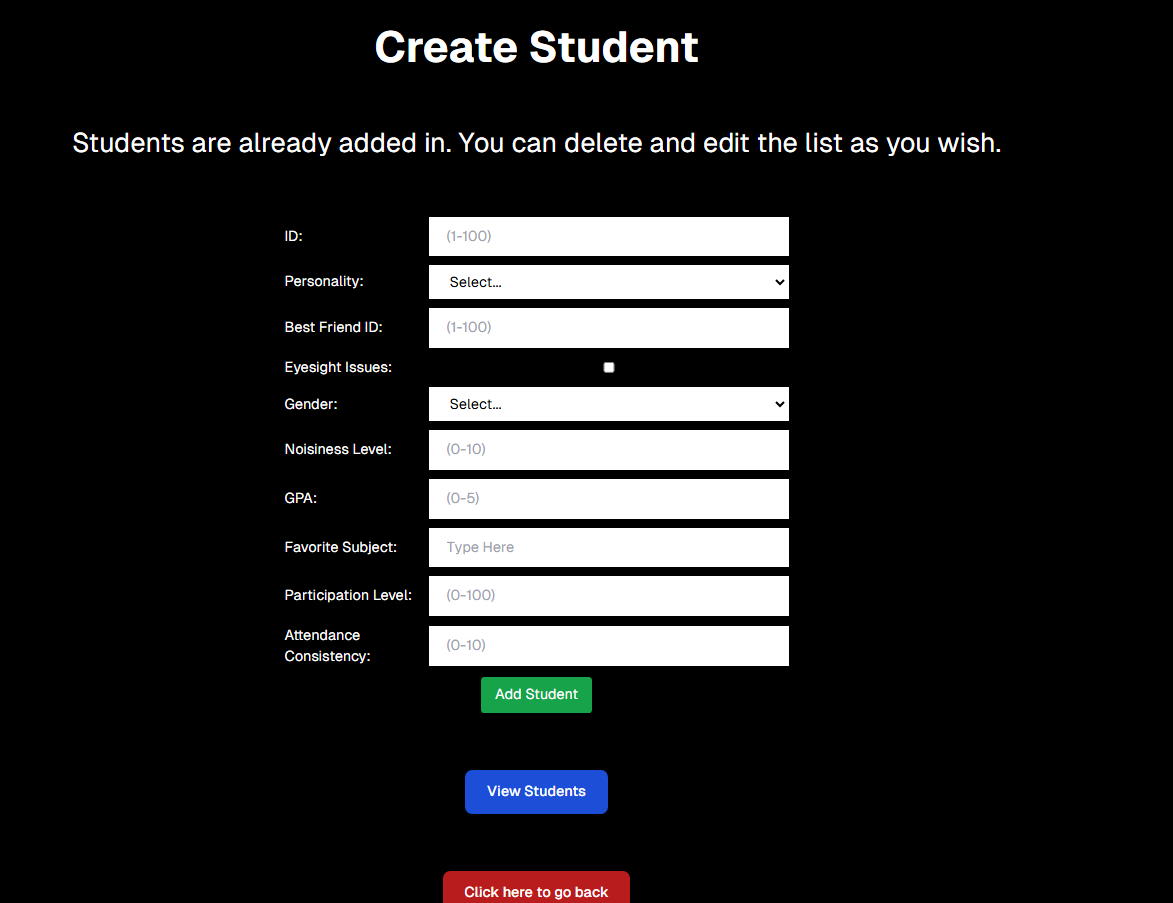
Create Student Page


Inspiration
The inspiration for Optimized Seating Chart came from countless conversations with teachers and educators who expressed frustration with the time-consuming task of creating seating arrangements that actually work. Many shared stories of manually drawing out charts, only to find that they didn’t account for important factors like student behavior, learning needs, or social conflicts. We realized there was a gap in tools designed specifically to address these challenges.
Our goal was to build a solution that not only optimizes seating based on academic performance but also considers softer elements like student friendships, teacher-defined preferences, and even classroom layout. Ultimately, we wanted to create a tool that empowers teachers to enhance the learning environment by placing students in positions where they can thrive—without the guesswork.
What it Does
Optimized Seating Chart is a smart, dynamic tool that generates customized seating charts tailored to the unique needs of each classroom. Teachers can input a variety of data points, such as:
- Student behavior (e.g., disruptive, quiet, needs extra support)
- Learning preferences (e.g., auditory, visual, hands-on)
- Social relationships (e.g., friends who work well together or students who should be separated)
- Physical constraints (e.g., wheelchair accessibility, proximity to the board, or grouping by rows or clusters)
Once the data is entered, the app runs it through an optimization algorithm that considers all the input and generates a seating chart designed to maximize student engagement, minimize distractions, and support the teacher’s overall classroom management goals. The tool also provides a real-time preview, allowing teachers to make adjustments on the fly if needed.
How We Built It
We built Optimized Seating Chart using Next.js for the frontend because of its ability to deliver a fast, interactive, and responsive user experience. The UI was designed with simplicity in mind, ensuring that even teachers with minimal tech experience can navigate the platform with ease.
On the backend, we used Java to implement the core algorithms that process the input data and generate optimized seating charts. Java was chosen for its performance capabilities and robust libraries, allowing us to handle complex data sets efficiently. We developed a REST API to connect the frontend and backend, ensuring smooth communication and data transfer between the two layers of the application.
To handle real-time updates and chart visualization, we integrated libraries like D3.js for dynamic rendering, giving teachers immediate feedback on how different input parameters affect the seating arrangement.
Challenges We Ran Into
One of the biggest challenges we faced was optimizing the algorithm to run efficiently with large and complex datasets. In early iterations, the app was sluggish when processing seating charts for larger classrooms or when handling a significant number of constraints. This led to delays and a subpar user experience.
Another challenge was ensuring that the frontend and backend communicated seamlessly. Initial API calls were inconsistent, causing incomplete data transfers and occasional crashes. We had to refactor significant portions of the codebase to streamline the data flow and improve reliability.
Lastly, we faced a UX challenge in designing a tool that could balance flexibility with simplicity. Teachers have diverse needs and classroom setups, so creating a solution that could accommodate a wide range of scenarios without becoming overly complicated required multiple iterations and user testing.
Accomplishments That We’re Proud Of
We’re incredibly proud of the progress we made in optimizing the algorithm. By refining our data structures and leveraging multi-threading in Java, we were able to significantly reduce the processing time, making the app fast and responsive even for large classrooms with complex seating requirements.
Another accomplishment is the user interface. We received positive feedback from teachers who tested the app, praising its intuitive design and the ability to customize seating arrangements with just a few clicks. One feature we’re particularly proud of is the “Conflict Highlighting” system, which visually flags potential issues in the seating chart, such as students who should be separated or those who need specific accommodations.
We also successfully implemented a feature that allows teachers to export their seating charts as PDFs or share them digitally with other staff members, making it easier to collaborate on classroom management.
What We Learned
The development of Optimized Seating Chart taught us a lot about building scalable, user-friendly applications. We gained hands-on experience with Next.js and Java, particularly in how to connect them via REST APIs for seamless frontend-backend integration.
We also learned a great deal about algorithm design, especially in terms of optimizing for multiple variables. Balancing factors like behavior, learning preferences, and social dynamics required us to dive deep into concepts like constraint satisfaction problems and heuristic optimization. This experience has broadened our understanding of how to design algorithms that are both efficient and adaptable.
Additionally, we learned the importance of user feedback. Early user testing provided invaluable insights into how teachers interact with the app, leading us to make several key improvements that we might not have considered otherwise.
What’s Next for Optimized Seating Chart
Looking ahead, we have several exciting plans for Optimized Seating Chart:
- Enhanced Customization: We plan to add more customization options, such as the ability to define “zones” within the classroom (e.g., quiet areas, group work zones) and assign students accordingly.
- Integration with School Systems: We aim to integrate the app with popular school management systems like Google Classroom and PowerSchool, allowing for seamless data import and export.
- Mobile App Development: Currently, the app is web-based, but we’re exploring the possibility of developing a mobile version to make it even more accessible for teachers on the go.
- AI-Driven Recommendations: We’re considering implementing machine learning to provide data-driven recommendations for seating arrangements based on past performance and behavior patterns.
- Domain and Marketing: We plan to purchase a custom domain and develop a marketing strategy to reach a wider audience, including school districts and educational institutions.
Our ultimate goal is to make Optimized Seating Chart the go-to solution for teachers seeking to create productive, harmonious classroom environments with minimal effort.

Log in or sign up for Devpost to join the conversation.